. 2024 Feb 2;26(2):266-278.
doi: 10.1093/neuonc/noad172.

NLGN4X TCR transgenic T cells to treat gliomas

Affiliations

NLGN4X TCR transgenic T cells to treat gliomas

Christoper Krämer et al. Neuro Oncol. .

Abstract

Background: Neuroligin 4 X-linked (NLGN4X) harbors a human leukocyte antigen (HLA)-A*02-restricted tumor-associated antigen, overexpressed in human gliomas, that was found to induce specific cytotoxic T cell responses following multi-peptide vaccination in patients with newly diagnosed glioblastoma.

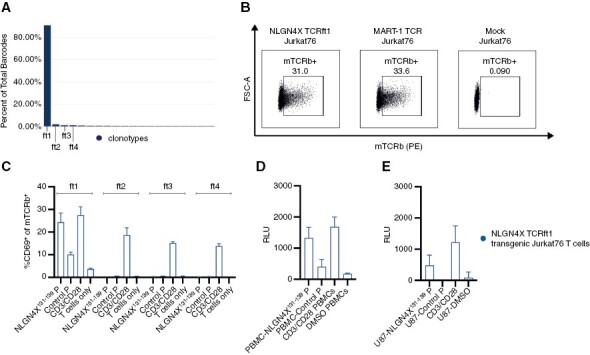
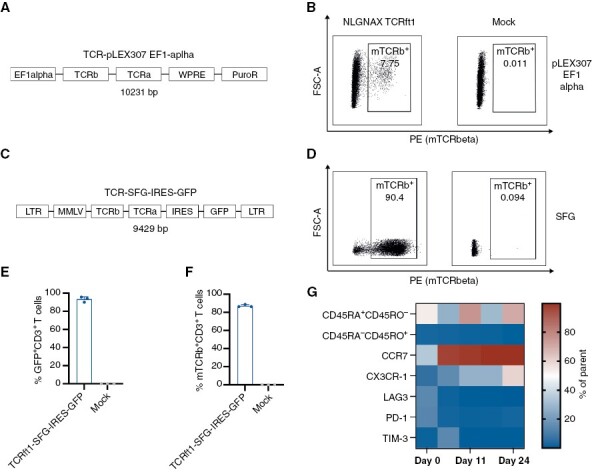
Methods: T cell receptor (TCR) discovery was performed using droplet-based single-cell TCR sequencing of NLGN4X-tetramer-sorted T cells postvaccination. The identified TCR was delivered to Jurkat T cells and primary human T cells (NLGN4X-TCR-T). Functional profiling of NLGN4X-TCR-T was performed by flow cytometry and cytotoxicity assays. Therapeutic efficacy of intracerebroventricular NLGN4X-TCR-T was assessed in NOD scid gamma (NSG) major histocompatibility complex (MHC) I/II knockout (KO) (NSG MHC I/II KO) mice bearing NLGN4X-expressing experimental gliomas.

Results: An HLA-A*02-restricted vaccine-induced T cell receptor specifically binding NLGN4X131-139 was applied for preclinical therapeutic use. Reactivity, cytotoxicity, and polyfunctionality of this NLGN4X-specific TCR are demonstrated in various cellular models. Intracerebroventricular administration of NLGN4X-TCR-T prolongs survival and leads to an objective response rate of 44.4% in experimental glioma-bearing NSG MHC I/II KO mice compared to 0.0% in control groups.

Conclusion: NLGN4X-TCR-T demonstrate efficacy in a preclinical glioblastoma model. On a global scale, we provide the first evidence for the therapeutic retrieval of vaccine-induced human TCRs for the off-the-shelf treatment of glioblastoma patients.Keywords cell therapy | glioblastoma | T cell receptor | tumor antigen.

Keywords: Keywords cell therapy; T cell receptor; glioblastoma; tumor antigen.


Conflict of interest statement

T-cell receptor-derived binding polypeptides PCT/EP2023/061716 to L.B., E.G., M.P, Y.C.C, W.W., M.K., and C.K. Non-integrating DNA vectors for the genetic modification of cells WO2019060253A1 to R.H. Honoraria from Adaptive Biotechnologies to L.B. Consulting fees from Servier, Bayer, GSK, MSD, and Roche to W.W. Royalties are received from The Jackson Laboratory from their licensing NSG MHC class I/II knockout mice to For Profit Companies by L.D.S.

Figures

Figure 1.
Figure 1.
NLGN4X ft1 TCR is specifically reactive to the Neuroligin-4, X-linked target epitope (A) VDJ analysis from single-cell TCR sequencing of multimer-sorted patient T cells after vaccination. Frequencies: ft1—90.82%; ft2—1.78%; ft3—0.96%; ft4—0.96%. (B) Exemplary flow cytometric analysis of the transfection efficiency of TCR-transfected Jurkat T cells. (C) NLGN4X ft1-4 TCR transfected Jurkat76 co-cultured with peptide-loaded BOLETH APC. Myelin oligodendrocyte glycoprotein (MOG35-55) was used as the control peptide. Mean with SEM of 3 technical replicates. Transfection efficiencies assessed by mTCRb expression of the respective TCRs ft1-4: ft1: 15.56% ft2: 12.13%, ft3: 14.63%, ft4: 17.93% (data not shown). (D) NFAT-reporter assay of NLGN4X TCR transfected Jurkat76 T cells co-cultured with peptide-loaded HLA-A*02+ PBMCs. RLU = relative luminescence units. Mean with SEM of 3 technical replicates. (E) NFAT-reporter assay of NLGN4X TCR transfected Jurkat76 T cells co-cultured with peptide-loaded HLA-A*02+ U87 glioma cells. RLU = relative luminescence units. Mean with SEM of 3 technical replicates.
Figure 2.
Figure 2.
Development of the manufacturing process of the T cell product. (A) Schematic overview of the TCRft1-pLEX307 EF1-alpha: EF1-alpha promoter—TCR beta chain (including the murine TCR beta constant region)—TCR alpha chain—Woodchuck hepatitis virus posttranscriptional regulatory element—puromycin resistance. (B) Exemplary transduction efficiency of TCRft1-pLEX307 EF1-alpha transduced human T cells by flow cytometric analysis of mTCRb, compared to Mock-transduced T cells. (C) Schematic overview of the TCR-SFG-IRES-GFP vector: long terminal repeat sequence—Moloney murine leukemia virus—TCR beta chain (including the murine TCR beta constant region)—TCR alpha chain—internal ribosomal entry site—green fluorescent protein—long terminal repeat sequence. (D) Exemplary transduction efficiency of TCRft1-SFG-IRES-GFP transduced human T cells by flow cytometric analysis of mTCRb, compared to Mock-transduced T cells. (E) GFP+ human T cells after transduction with the TCRft1-SFG-IRES-GFP retroviral vector. Mean with SEM of 3 technical replicates. (F) mTCRb expression of primary T cells 4 days after transduction with the TCRft1-SFG-IRES-GFP retroviral vector. Mean with SEM of 3 technical replicates. (G) Multi-color flow cytometry assessment of different phenotypic markers in human T cells after transduction with a TCRft1-SFG-IRES-GFP vector. n = 2 biological replicates.
Figure 3.
Figure 3.
NLGN4X-TCR-T showed comparable effective in vitro recognition and lysis of target cells as a clinically used control TCR. (A) Heatmap of the functional response (IFN-γ, TNF-α, GrzB) of primary human T cells from 3 different donors (D1-3) transduced with the NLGN4X131–139 TCR and co-cultured with peptide-loaded HLA-A*02+ K562 leukemia cells. For statistical analysis compare Figure 3B–D. n = 3 biological replicates. (B) TNF-α production of NLGN4X-TCR-T and Mart-1-TCR-T cultured with peptide-loaded HLA-A*02+ K562 leukemia cells. Target peptide: NLGN4X-TCR-T versus MART-1 TCR T cells, p = 0.0863. Mean with SEM of n = 3 biological replicates, 2-way ANOVA. (C) IFN-γ production of NLGN4X-TCR-T and MART-1-TCR-T cultured with peptide-loaded HLA-A*02+ K562 leukemia cells. Target peptide: NLGN4X-TCR-T versus MART-1-TCR-T, p = 0.2926. Mean with SEM of n = 3 biological replicates, 2-way ANOVA. (D) Granzyme B expression of NLGN4X-TCR-T versus MART-1-TCR-T cultured with peptide-loaded HLA-A*02+ K562 leukemia cells. Target peptide: NLGN4X-TCR-T versus MART-1-TCR-T, p = 0.3461. Mean with SEM of n = 3 biological replicates, 2-way ANOVA. (E) Exemplary overview of the modified Vital-FR assay used in this study: target cells that either endogenously expressed the target epitope or were exogenously loaded with the respective peptide were labeled with CellTraceTM FarRed and nontarget cells (irrelevant peptide or no target) were labeled with CellTraceTM Violet and cultured with target-specific TCR transduced T cells in the same well. Created with Biorender.com. (F) Live cells of either target peptide-loaded or unloaded K562 cells after overnight co-culture with NLGN4X-TCR-T or MART-1-TCR-T at an effector—target (E:T) cell ratio of 10:1 assessed by flow cytometric analysis. Mean with SEM of n = 3 biological replicates, 2-way ANOVA. Target peptide for NLGN4X-TCR-T is the NLGN4X131–139 peptide, and for MART-1-TCR-T the MART-127-35 peptide. Control peptide is the MOG35–55(myelin oligodendrocyte glycoprotein) peptide.
Figure 4.
Figure 4.
The NLGN4X TCR specifically recognizes and lyses glioma cells expressing the NLGN4X target epitope. (A) Heatmap of the functional response (CD69, 4-1BB, GrzB) of 3 different donors transduced with the NLGN4X TCRft1 and co-cultured with peptide-loaded HLA-A*02+ U87 glioma cells. For statistical analysis compare Supplementary Figure S5A–C. (B) Optical density (OD) measuring LDH release after overnight co-culture of NLGN4X-TCR-T and Flu (MHCI epitope) TCR transgenic T cells (Flu-TCR-T) with NLGN4X131-139 or Flu58-66 peptide-loaded U87 glioma cells. The E:T ratio was 2:1. Mean with SEM of n = 3 biological replicates, 2-way ANOVA. (C) NLGN4X-TCR-T were co-cultured with either peptide-loaded U87 glioma cells or unloaded cells and specific cytotoxicity was calculated using FACS-based counting of tumor cells. The E:T ratio was 2:1. Mean with SEM of n = 3 biological replicates, unpaired t-test. (D) Heatmap of the functional response (CD69, 4-1BB, GrzB) of 3 different donors transduced with an NLGN4X TCR or Flu TCR (here: negative control TCR) and co-cultured with U87 glioma endogenously expressing the NLGN4X protein sequence including the relevant epitope (U87 NLGN4X) or a tandem-minigene (U87 TMG) containing the antigenic sequence of NLGN4X. For statistical analysis compare Supplementary Figure S5D–F. (E) LDH release assay of NLGN4X-TCR-T versus Flu-TCR-T (TCR negative control) targeting either U87 NLGN4X, U87 TMG, or U87 (target negative control) glioma cells. The E:T ratio was 2:1. Mean with SEM of n = 3 biological replicates, 2-way RM-ANOVA. (F) Different patient-derived glioblastoma cell lines were evaluated for NLGN4X expression by Taqman quantitative PCR. PB1 was used for further in vitro testing. Normalized to Bestkeeper. Mean with SEM of 2-5 technical replicates. (G) Heatmap of the functional response (4-1BB, TNF-α, Perf, GrzB) of TCR-transgenic priamry human T cells from 5 different donors expressing either the NLGN4X TCR or Flu TCR and co-cultured with PB-1 patient-derived glioblastoma cells naturally expressing the NLGN4X131–139 epitope. Perf, perforin. For statistical analysis see Supplementary Figure S5G. (H) OD measuring LDH release of an overnight co-culture of NLGN4X-TCR-T versus Flu-TCR-T (TCR negative control) with PB-1 glioma cells. E:T ratio as indicated below. Mean with SEM of n = 3 biological replicates, 2-way RM-ANOVA. Target peptide for NLGN4X-TCR-T is the NLGN4X131–139 peptide. Control peptide is the Flu (influenza)58–66 MHC class I peptide, to which Flu-TCR-T are reactive.
Figure 5.
Figure 5.
Intraventricular delivery of NLGN4X-TCR-T mediates temporary tumor regression and increased survival in an intracranial tumor model. (A) Schematic experimental overview: NSG MHC I/II KO mice were challenged with intracranial U87 NLGN4X antigen overexpressing gliomas and after confirmation of tumor growth NLGN4X-TCR-T or Flu-TCR-T were injected at days 15 and 22 after tumor inoculation. Created with Biorender.com. (B) Preclinical survival of U87 TMG-bearing mice treated either with NLGN4X-TCR-T or Flu-TCR-T. NTC = No T cell control. n = 9 mice for NLGN4X-TCR-T, n = 8 mice for Flu-TCR-T, n = 7 for NTC, log-rank-test. (C) Radiographic response assessment according to the mRANO criteria: between days 11 and 67 CR was defined as a change in tumor volume of −100%, PR as < -65%, SD between −65% and +40% and PD as >+40%. (D) MRI image of one long-term surviving NLGN4X-TCR-T treated animal showing tumor regression at the initial tumor site until day 67 and tumor progression at day 98. (E) Individual growth curves of U87 TMG glioma cells of NLGN4X-TCR-T (I) and Flu-TCR-T (II) treated animals. Circled mice were analyzed by FACS as shown in Figure 5F. Log10-scaled growth. Thus, tumor volumes with V = 0 μl are not displayed in the graph. For visualization of tumor growth, the detection limit for tumor volumes was set to 0.1 μl. CR = complete response, PR = partial response, SD = stable disease, PD = progressive disease, D = death. (F) Representative flow cytometric analysis from 2 animals (M1 = mouse 1, M2 = mouse 2) with late-stage recurrence of the tumor showing persistence of primarily CD4+ T cells at the tumor site with a predominantly CCR7CD45RA effector memory phenotype and impaired proliferation with high PD-1 expression. Gated on live hCD3+ T cells. (G) Realtime quantitative PCR of the U87 TMG plasmid sequence in tumors of NLGN4X-TCR-T, Flu-TCR-T treated or NTC animals at late-stage time point compared to in vitro cultured U87 TMG and U87 cells. Relative expression to hGAPDH or hβ-actin, log10-scaled. n = 3 biological replicates. (H) Exemplary immunofluorescence staining of HLA-A expression: One NLGN4X-TCR-T-treated animal and one untreated animal at late stage timepoint shown. Immunofluorescence images of additional animals are shown in Supplementary Figure S8C.
Figure 6.
Figure 6.
NLGN4X-TCR-T exhibits an effector phenotype in the tumor microenvironment after intracerebroventricular delivery. (A) Experimental overview: U87 TMG gliomas were injected intracranially and NLGN4X-TCR-T or Flu-TCR-T were injected into the contralateral ventricle. After 6 days T cells were analyzed by flow cytometry and ex vivo activation was assessed. Created with Biorender.com. (B) Exemplary flow cytometry plots showing intratumoral CD3+ T cells, CD4–CD8 distribution, and mTCRb and GFP expression. Middle and right plots gated on CD3+ and CD8+ cells, respectively. (C) Normalized (to tumor volume) count of CD3+CD8+ T cells in the TME. n = 8 (NLGN4X-TCR-T), n = 7 (Flu-TCR-T). Unpaired t-test. (D) Exemplary FACS plots showing the CD45RA and CCR7 as well as Ki67 and PD-1 expression on intratumoral CD3+CD8+ T cells (TCM = T central memory cells, TN = naïve T cells, TEM = T effector memory cells, TEM-CD45RA+ = TEM re-expressing CD45RA). (E) Heatmap of phenotypic markers of intratumoral CD3+CD8+ T cells. n = 8 (NLGN4X-TCR-T), n = 7 (Flu-TCR-T). (F) Assessment of activation and effector cell markers of intratumoral CD8+ T cells. n = 8 (NLGN4X-TCR-T), n = 7 (Flu-TCR-T), 2-way ANOVA.

References

    1. Hilf N, Kuttruff-Coqui S, Frenzel K, et al. . Actively personalized vaccination trial for newly diagnosed glioblastoma. Nature. Jan 2019;565(7738):240–245. - PubMed
    1. Lim M, Weller M, Idbaih A, et al. . Phase 3 trial of chemoradiotherapy with temozolomide plus nivolumab or placebo for newly diagnosed glioblastoma with methylated MGMT promoter. Neuro Oncol. 2022;24(11):1935–1949. - PMC - PubMed
    1. Majzner RG, Ramakrishna S, Yeom KW, et al. . GD2-CAR T cell therapy for H3K27M-mutated diffuse midline gliomas. Nature. 2022;603(7903):934–941. - PMC - PubMed
    1. Brown CE, Alizadeh D, Starr R, et al. . Regression of glioblastoma after chimeric antigen receptor T-cell therapy. N Engl J Med. 2016;375(26):2561–2569. - PMC - PubMed
    1. Vitanza NA, Johnson AJ, Wilson AL, et al. . Locoregional infusion of HER2-specific CAR T cells in children and young adults with recurrent or refractory CNS tumors: an interim analysis. Nat Med. 2021;27(9):1544–1552. - PubMed

Publication types