. 2023 Sep 21;30(9):1064-1075.e8.
doi: 10.1016/j.chembiol.2023.08.008.

Metabolic modulation of mitochondrial mass during CD4+ T cell activation

Affiliations

Metabolic modulation of mitochondrial mass during CD4+ T cell activation

Kiran Kurmi et al. Cell Chem Biol. .

Abstract

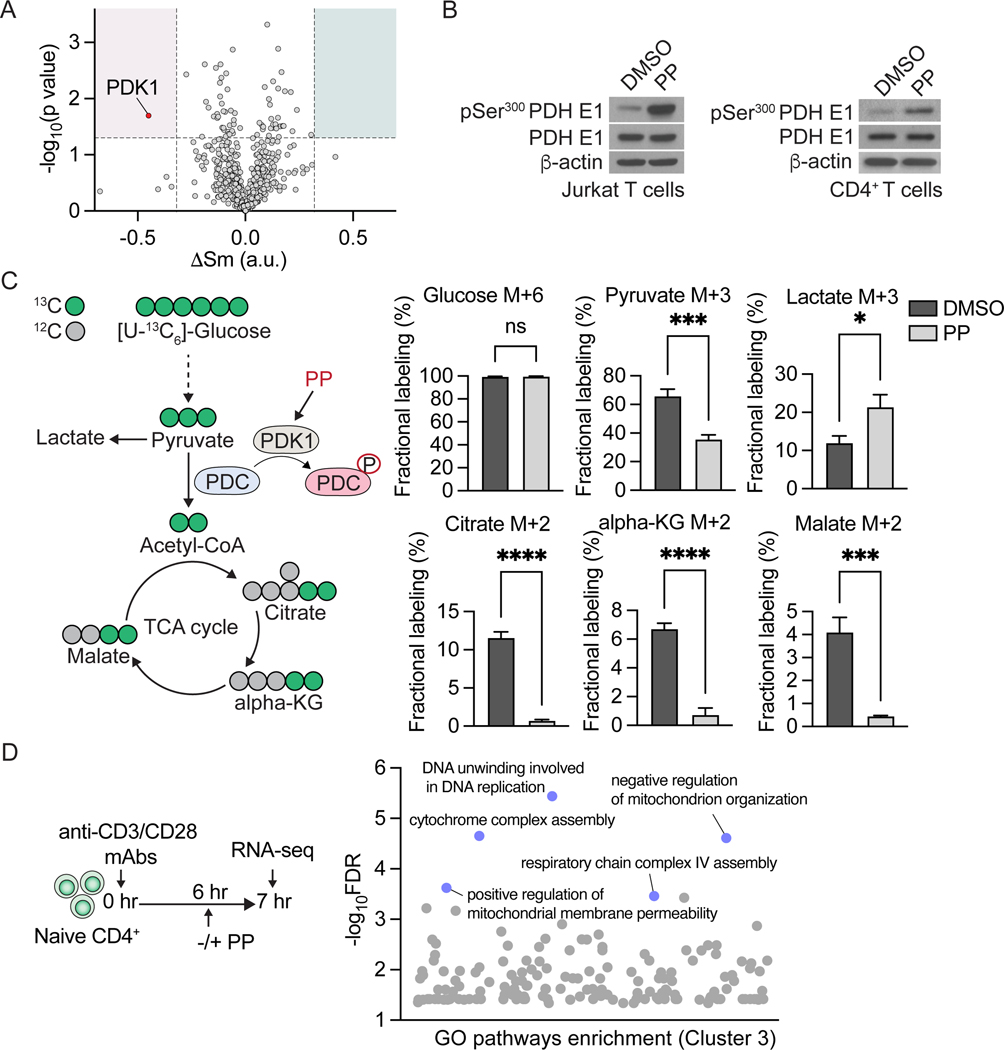
Mitochondrial biogenesis initiates within hours of T cell receptor (TCR) engagement and is critical for T cell activation, function, and survival; yet, how metabolic programs support mitochondrial biogenesis during TCR signaling is not fully understood. Here, we performed a multiplexed metabolic chemical screen in CD4+ T lymphocytes to identify modulators of metabolism that impact mitochondrial mass during early T cell activation. Treatment of T cells with pyrvinium pamoate early during their activation blocks an increase in mitochondrial mass and results in reduced proliferation, skewed CD4+ T cell differentiation, and reduced cytokine production. Furthermore, administration of pyrvinium pamoate at the time of induction of experimental autoimmune encephalomyelitis, an experimental model of multiple sclerosis in mice, prevented the onset of clinical disease. Thus, modulation of mitochondrial biogenesis may provide a therapeutic strategy for modulating T cell immune responses.

Keywords: CD4(+) T cells; T cell differentiation; high-throughput metabolic screen; mitochondrial biogenesis; pyruvate oxidation; pyrvinium pamoate.


Conflict of interest statement

Declaration of interests M.C.H. serves on the advisory boards for Alixia, Minovia, and MitoQ. M.C.H. has received funding from Agilent and Roche in the last five years. M.C.H. and K.K. have patents pending on the role of PP in T cells and mitochondria. A.S. is an employee of Flagship Labs 84, Inc, a subsidiary of Flagship Pioneering. J.M.D. reports grants from NIH during the conduct of the study, as well as personal fees from ElevateBio (consulting) and Third Rock Ventures (consulting) outside the submitted work. S.H. has consulted for Merck KGaA. I.S.H. reports financial support from Kojin Therapeutics and consulting fees for Ono Pharma USA. Fundings and fees from these companies are outside the scope of the current work. P.G. reports personal fees from RA Capital for consulting outside the submitted work. P.K.S. is a member of the SAB or BOD member of Applied Biomath, RareCyte Inc., and Glencoe Software; P.K.S. is also a member of the NanoString SAB, and the Sorger laboratory has received research funding from Novartis and Merck in the last five years. P.K.S. declares that none of these relationships have influenced the content of this manuscript. S.K.D. receives research funding unrelated to this project from Novartis and BMS and is a founder and scientific advisory board member for Kojin. A.H.S. has funding from Quark, Merck, AbbVie, Moderna, and Vertex unrelated to the submitted work. A.H.S. serves on advisory boards for SQZ Biotechnologies, Selecta, Elpiscience, Monopteros, Bicara, Fibrogen, Alixia, IOME, Corner Therapeutics, Glaxo Smith Kline, Amgen, and Janssen. She also is on scientific advisory boards for the Massachusetts General Cancer Center, Program in Cellular and Molecular Medicine at Boston Children’s Hospital, the Human Oncology and Pathogenesis Program at Memorial Sloan Kettering Cancer Center, the Gladstone Institute, and the Johns Hopkins Bloomberg-Kimmel Institute for Cancer Immunotherapy. She is an academic editor for the Journal of Experimental Medicine. A.H.S. has patents/pending royalties on the PD-1 pathway from Roche and Novartis.

Figures

Figure 1.
Figure 1.. High-throughput small molecule metabolic library identifies regulators of mitochondrial biogenesis in CD4+ T cells
(A) Schematic of experimental design for high-throughput chemical screening. Naive CD4+ T cells were isolated from PhaMexcised mice and activated for 24hr in the presence of 240 chemicals, each at ten different doses ranging from 15 μm (highest) to 0.75 nM (lowest). The screen was performed in duplicate. (B) Area under the curve (AUC) for mito-Dendra2. AUC was generated by integrating the area of the 10-point dose-response data for all 240 compounds using R and GraphPad Prism software. (C) Breakdown of the 240 compound mito-Dendra2 AUC into metabolic pathways. Hypergeometric enrichment analysis was computed for 17 different metabolic pathways (non-significant (ns), *p< 0.05, **p <0.01, ***p < 0.001). (D) mito-Dendra2 AUC plotted against % Live CD4+ T cells (AUC) for 240 compounds. Compounds that decrease mito-Dendra2 levels without decreasing viability (>60% live) are shown in green. (E) Rank plot of top hits showing the ratio of mito-Dendra2 (AUC) over cell size (AUC).
Figure 2.
Figure 2.. Pyrvinium pamoate impairs CD4+ T cell mitochondrial metabolism and content.
(A) Left: Chemical structure of pyrvinium, the active component of pyrvinium pamoate salt. Right: Dose-response curve of mito-Dendra2, live, and CD69hi for pyrvinium pamoate. Data are shown as mean ± SD from three replicates. Right: (B) Oxygen consumption rates (OCR) were measured in CD4+ T cells following DMSO and acute or 24 hr treatment with PP (2 nM). All results are mean ± SEM representative of two separate experiments (n=6 pools of two mice each). (C) Representative electron microscopy (EM) micrographs of CD4+ T cells post 24 hr of activation treated with DMSO or PP (1 nM). Scale bar, 0.5 μm. (D) Volcano plot showing changes in metabolite levels of CD4+ T cells that were activated with anti-CD3/CD28 for 6 hr and treated with either DMSO or PP (2 nM) for 1 hr. (E) Ratio of ATP over ADP metabolite levels of CD4+ T cells that were activated with anti-CD3/CD28 for 6 hr and treated with either DMSO or PP (2 nM) for 1 hr. ***p < 0.001 (Student’s t-test).
Figure 3.
Figure 3.. Pyrvinium pamoate inhibits pyruvate oxidation in the mitochondria.
(A) Volcano plot of proteins solubility shift ΔSm from PISA results. X-axis represents the log2 fold change in thermal stability of all mitochondrial and biogenesis proteins between PP (5 nM) over DMSO control, significance cutoff (fold change of 1.25 and p <0.05). (B) Immunoblots of lysates from Jurkat T cells (left) treated with 25 nM PP for 1hr and CD4+ T cells (right) activated with anti-CD3/CD28 mAbs for 6 hr and then treated with 2 nM PP for 1 hr. (C) Left: Schematic of uniformly-labeled 13C glucose (U-13C6) tracing experiment to TCA cycle intermediates in CD4+ T cells during early activation. The gray circle indicates 12C, and the green circle indicates 13C atoms from glucose. Right: Contribution of 13C6 glucose to metabolites. Naive CD4+ T cells were first activated for 3 hours and then cultured in U-13C6 glucose for additional 3 hours with either DMSO control or PP (2 nM). The labeling percentage of intracellular 13C6 glucose was the same between DMSO and PP. All experiments represent the mean ± SD of three independent experiments. non-significant (ns), *p <0.05, ***p < 0.001, ****p < 0.0001 (Student’s t-test ). (D) Left: Schematic of experimental design to assess the gene expression signature of CD4+ T cells treated with either DMSO or PP (2 nM) for 1 hr before RNA extraction. Right: Functional gene ontology (GO: Biological Process) enrichment analysis of all genes in cluster 3 (Table S4) in CD4+ T cells using g:Profiler. Benjamini-Hochberg FDR approach was used for multiple testing correction.
Figure 4.
Figure 4.. PP impairs CD4+ T cell proliferation, cytokine production, and helper T cell differentiation
(A) Rank plot of significantly downregulated genes from RNA-seq analysis of activated CD4+ T cells treated with either DMSO or PP (2 nM) for 1 hr. (B) Left: Representative CellTrace Violet dye dilution assay at day 3 after CD4+ T cells activation by anti-CD3/CD28 mAbs in the presence of DMSO, PP (1 nM), or PP (5 nM). Right: Quantification of proliferation and division index of the CellTrace Violet dilution assay from three independent experiments. (C) Effects of PP (1 nM) treatment on cytokine production on day 3 after culture with DMS or PP. Supernatants from cell culture were harvested and analyzed by Legendplex for cytokine concentration. (D) Naive CD4+ T cells were activated under Th1, Th2, Th17n, Th17p, or Treg cell-polarizing conditions for four days with or without PP (2 nM). Proportions of IFN-γ +, Tbet+, IL17+, and Foxp3+ cells under the corresponding polarizing conditions. All experiments represent the mean ± SD of three independent experiments. non-significant (ns), *p <0.05, **p <0.01, ***p < 0.001, ****p < 0.0001 (Student’s t-test , One-way ANOVA).
Figure 5.
Figure 5.. Administration of PP during the induction of EAE prevents disease onset and alters self reactive CD4+ T cell effector functions
(A) PP treatment prevents the development of experimental autoimmune encephalomyelitis (EAE). EAE was induced by immunization with MOG/CFA and pertussis toxin. Mice then received I.P. injection of vehicle or PP (0.7mg/KG) on days 0,1,3,5,7,9,11 post MOG. EAE clinical score was monitored daily and was analyzed by two-way ANOVA, and the results represent the mean ± SEM of two independent experiments. (B) CD4+ T cells isolated from draining lymph node (dLN) on day eight post-MOG immunization (no pertussis toxin) were re-stimulated with increasing concentrations of MOG peptide. MOG-specific proliferation was measured by cell trace violet (CTV) dilution assay. (C) MOG-specific production of IFN-γ from the supernatant of CD4+ T cells as in (B). (D) Quantitation of numbers of T cells in the central nervous system (CNS) of mice with active EAE at day 17 by flow cytometry. (E) Analysis of T cell composition in draining lymph node (dLN) of mice with active EAE at day 17 by flow cytometry. (F) Flow cytometry analysis of T cell proliferation(Ki67+), Th1/17 marker expression (RORγT+Tbet+, IFN-γ+, and IL-17+ ), and inflammatory cytokine (TNFα+) in the CNS at day 17 after EAE induction as (D). All experiments represent the mean ± SEM of two independent experiments. non-significant (ns), *p <0.05, **p <0.01, ***p < 0.001, ****p < 0.0001 (Student’s t-test, Two-way ANOVA).

References

    1. Vardhana SA, Hwee MA, Berisa M, Wells DK, Yost KE, King B, Smith M, Herrera PS, Chang HY, Satpathy AT, et al. (2020). Impaired mitochondrial oxidative phosphorylation limits the self-renewal of T cells exposed to persistent antigen. Nat Immunol 21, 1022–1033. 10.1038/s41590-020-0725-2. - DOI - PMC - PubMed
    1. Weinberg SE, Singer BD, Steinert EM, Martinez CA, Mehta MM, Martinez-Reyes I, Gao P, Helmin KA, Abdala-Valencia H, Sena LA, et al. (2019). Mitochondrial complex III is essential for suppressive function of regulatory T cells. Nature 565, 495–499. 10.1038/s41586-018-0846-z. - DOI - PMC - PubMed
    1. Akkaya B, Roesler AS, Miozzo P, Theall BP, Al Souz J, Smelkinson MG, Kabat J, Traba J, Sack MN, Brzostowski JA, et al. (2018). Increased Mitochondrial Biogenesis and Reactive Oxygen Species Production Accompany Prolonged CD4(+) T Cell Activation. J Immunol 201, 3294–3306. 10.4049/jimmunol.1800753. - DOI - PMC - PubMed
    1. Ron-Harel N, Santos D, Ghergurovich JM, Sage PT, Reddy A, Lovitch SB, Dephoure N, Satterstrom FK, Sheffer M, Spinelli JB, et al. (2016). Mitochondrial Biogenesis and Proteome Remodeling Promote One-Carbon Metabolism for T Cell Activation. Cell Metab 24, 104–117. 10.1016/j.cmet.2016.06.007. - DOI - PMC - PubMed
    1. Dominy JE, and Puigserver P (2013). Mitochondrial biogenesis through activation of nuclear signaling proteins. Cold Spring Harb Perspect Biol 5. 10.1101/cshperspect.a015008. - DOI - PMC - PubMed

Publication types

Substances