. 2023 Dec 6;111(23):3775-3788.e7.
doi: 10.1016/j.neuron.2023.08.018. Epub 2023 Sep 15.

Parkinson's disease-linked parkin mutation disrupts recycling of synaptic vesicles in human dopaminergic neurons

Affiliations

Parkinson's disease-linked parkin mutation disrupts recycling of synaptic vesicles in human dopaminergic neurons

Pingping Song et al. Neuron. .

Abstract

Parkin-mediated mitophagy has been studied extensively, but whether mutations in parkin contribute to Parkinson's disease pathogenesis through alternative mechanisms remains unexplored. Using patient-derived dopaminergic neurons, we found that phosphorylation of parkin by Ca2+/calmodulin-dependent protein kinase 2 (CaMK2) at Ser9 leads to activation of parkin in a neuronal-activity-dependent manner. Activated parkin ubiquitinates synaptojanin-1, facilitating its interaction with endophilin A1 and synaptic vesicle recycling. Neurons from PD patients with mutant parkin displayed defective recycling of synaptic vesicles, leading to accumulation of toxic oxidized dopamine that was attenuated by boosting endophilin A1 expression. Notably, combined heterozygous parkin and homozygous PTEN-induced kinase 1 (PINK1) mutations led to earlier disease onset compared with homozygous mutant PINK1 alone, further underscoring a PINK1-independent role for parkin in contributing to disease. Thus, this study identifies a pathway for selective activation of parkin at human dopaminergic synapses and highlights the importance of this mechanism in the pathogenesis of Parkinson's disease.

Keywords: CaMK2-mediated activation of parkin; PINK1-independent; Parkinson’s disease; human dopaminergic neurons; synaptic dysfunction; toxic oxidized dopamine.


Conflict of interest statement

Declaration of interests D.K. is the founder and scientific advisory board chair of Vanqua Bio, serves on the scientific advisory boards of The Silverstein Foundation, Intellia Therapeutics, AcureX, and is a venture partner at OrbiMed.

Figures

Figure 1.
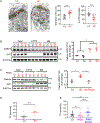
Figure 1.. Mutant parkin leads to increased dopamine oxidation in patient neurons
(A) DA oxidation measured by near infrared fluorescence (NIRF) assay (top) and quantification (bottom) in human iPSC-derived dopaminergic neurons from healthy control (C1), familial PD mutant PINK1 patient, and her sister who has both PINK1 and parkin mutation (PINK1&Parkin) on day 90 (n = 4 independent experiments, one-way ANOVA followed by Tukey’s test for multiple comparisons). (B) DA oxidation (left) quantified (right) in human iPSC-derived dopaminergic neurons from healthy controls (C1 and C2) and familial PD mutant parkin-linked patients (M1 and M2) transfected on day 90 with lentivirus empty vector or wild-type parkin for 60 days (n = 3 independent experiments, one-way ANOVA followed by Tukey’s test for multiple comparisons). (C) DA oxidation (top) quantified (bottom) in parkin mutant (M1) and its isogenic control (I-C) on day 150 (n = 3 independent experiments, unpaired two-tailed t test). (D) DA oxidation (top) quantified (bottom) in parkin mutant dopaminergic neurons (M1) transfected on day 60 with lentivirus empty vector or wild-type or C431F mutant parkin for another 20 days (n = 3 independent experiments, one-way ANOVA followed by Tukey’s test for multiple comparisons). All data are represented as mean ± SEM; ns, not significant; *p < 0.05; **p < 0.01; and ***p < 0.005.
Figure 2.
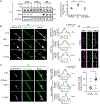
Figure 2.. Dysregulated synaptic vesicle recycling in parkin mutant neurons
(A) Representative electron microscopy images (left two sides) and quantification (right two sides) of synapses from human iPSC-derived dopaminergic neurons from isogenic control (I-C) and PD mutant parkin-linked patient (M1). Scale bars, 500 nm. Red arrow, regular sized SVs; red arrowhead, enlarged SVs; yellow lines, presynaptic membrane, rightmost, the number of SVs; second right, average diameter of SVs at synapses. n = 15 total synapses per line, n = 3 independent experiments, one-way ANOVA followed by Tukey’s test for multiple comparisons.). (B) Left, clathrin is decreased in the cytosolic fraction (CYTO) and increased in the synaptic membrane fraction (SM) of parkin mutant neurons (M1 and M2) compared with control neurons (C1 and C2) on day 150. Fractions were obtained from original total cell homogenate (total). β-III-Tubulin (β-III-Tub) was used as a neuronal marker. Right, quantification of the ratio of synaptic membrane-associated clathrin versus cytosolic clathrin (n = 3 independent experiments, one-way ANOVA followed by Tukey’s test for multiple comparisons).). (C) Left, clathrin is decreased in the CYTO and increased in the SM of parkin mutant neurons (M1) compared with either its isogenic control (I-C) or parkin mutant neurons transfected with lentivirus wild-type parkin. β-III-Tub was used as a neuronal marker. Right, quantification of the ratio of synaptic membrane-associated clathrin versus cytosolic clathrin (n = 3 independent experiments, one-way ANOVA followed by Tukey’s test for multiple comparisons).). (D) Time constants of pHluorin fluorescence recovery following exocytosis. Scatter plot (with lines representing means and SEM) compares synapses from isogenic control (I-C) (81.34 ± 14.40; n = 15 ROI) and parkin mutant dopaminergic neurons (M1) (219.2 ± 23.85; n = 19 ROI). Exocytosis was evoked by 40 electric pulses delivered at 20 Hz (Mann-Whitney test).). (E) Time constants of pHluorin fluorescence recovery following exocytosis. Scatter plot (with lines representing means and SEM) compares synapses from iPSC-derived dopaminergic neurons from PD patient who has both PINK1 and parkin mutation (PINK1&Parkin) (169.9 ± 17.54; n = 34 region of interest [ROI]), PINK1 mutation alone (79.53 ± 8.125; n = 41 ROI), and healthy control (C1) (99.22 ± 11.07; n = 28 ROI). Exocytosis was evoked by 40 electric pulses delivered at 20 Hz (Kruskal-Wallis test with Dunn’s test for multiple comparisons).). All data are represented as mean ± SEM; ns, not significant; *p < 0.05; **p < 0.01; ***p < 0.005; and ****p < 0.0001.
Figure 3.
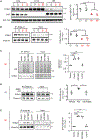
Figure 3.. Neuronal activity drives the dynamic recruitment of parkin onto synaptic vesicles
(A) Left, parkin is decreased in the cytosolic fraction (CYTO) and increased in the synaptic membrane fraction (SM) upon 50 mM KCl treatment for 1 min which is attenuated in the presence of 2 mM EDTA in isogenic control dopaminergic neurons (I-C). Fractions were obtained from original total cell homogenate (Total). β-III-Tubulin (β-III-Tub) was used as a neural specific marker. Right, quantification of the ratio of synaptic membrane-associated parkin versus cytosolic parkin (n = 3 independent experiments, one-way ANOVA followed by Tukey’s test for multiple comparisons). (B) Representative confocal time-lapse images (left) and corresponding linescans (right) of the location of parkin and SVs in living isogenic control (I-C) dopaminergic neurons expressing GFP-parkin and mCherry-synaptophysin (mCherry-SYP) with 50 mM KCl treatment. White (black in the linescans) arrows mark GFP-parkin and SVs before KCl treatment. Yellow arrows mark GFP-parkin and SVs after KCl treatment. Scale bars, 1 μm. (C) Representative confocal time-lapse images (left) and corresponding linescans (right) of the location of parkin and SVs in living isogenic control dopaminergic (I-C) neurons expressing GFP-parkin and mCherry-synaptophysin (mCherry-SYP) with vehicle treatment. White (black in the linescans) arrows mark GFP-parkin and SVs before or after vehicle treatment. Scale bars, 1 μm. (D) Representative confocal microscopy images (top) and quantitation (bottom) of immunostained presynaptic marker synaptophysin (SYP) (red) and parkin (green) colocalization after vehicle or 50 mM KCl treatment for 1 min at nerve terminals in isogenic control (I-C) human dopaminergic neurons. White arrowheads mark parkin that does not colocalize with SYP. Yellow arrowheads mark parkin colocalized with SYP. Scale bars, 5 μm. n = 10 total images, n = 3 independent experiments, unpaired two-tailed t test. All data are represented as mean ± SEM, *p < 0.05, and **p < 0.01. See also Videos S1 and S2.
Figure 4.
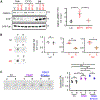
Figure 4.. PINK1 is not required for neuronal activity-dependent recruitment of parkin to synaptic vesicles
(A) Left, parkin is decreased in the cytosolic fraction (CYTO) and increased in the synaptic membrane fraction (SM) upon 50 mM KCl treatment for 1 min which is attenuated by 2 mM EDTA in PINK1 mutant dopaminergic neurons. Fractions were obtained from original total cell homogenate (Total). β-III-Tubulin (β-III-Tub) was used as a neural specific marker. Right, quantification of the ratio of synaptic membrane-associated parkin versus cytosolic parkin (n = 3 independent experiments, one-way ANOVA followed by Tukey’s test for multiple comparisons). (B) Representative confocal time-lapse images (left) and corresponding linescans (right) of the location of parkin and SVs in living PINK1 mutant dopaminergic neurons expressing GFP-parkin and mCherry-synaptophysin (mCherry-SYP) with 50 mM KCl treatment. White (black in the linescans) arrows mark GFP-parkin and SVs before KCl treatment. Yellow arrows mark GFP-parkin and SVs after KCl treatment. Scale bars, 1 μm. n = 10 total images, n = 3 independent experiments, unpaired two-tailed t test. All data are represented as mean ± SEM, *p < 0.05.
Figure 5.
Figure 5.. CaMK2 activates parkin and promotes its recruitment to synaptic vesicles
(A) Western blot (left) and quantification (right) showing the increased phosphorylation of parkin upon neuronal depolarization induced by 50 mM KCl treatment for 1 min in PINK1 mutant neurons (n = 3 independent experiments, unpaired two-tailed t test). (B) Western blot (left) and quantification (right) showing the increased CaMK2 protein in parkin mutant neurons M1 compared with its isogenic control (I-C) neurons (n = 4 independent experiments, unpaired two-tailed t test). (C) Western blot (left) and quantification (right) showing the increased phosphorylation of parkin upon neuronal depolarization induced by 50 mM KCl treatment for 1 min was abolished in the presence of 2 μM KN93 in PINK1 mutant neurons (n = 3 independent experiments, unpaired two-tailed t test). (D) Autoradiography shows CaMK2 phosphorylates parkin in vitro. (E) Left, the recruitment of parkin onto synaptic membrane (SM) was inhibited in the presence of 2 μM KN93 for 30 min (CaMK2 inhibitor) but not 2 μM KN92 (an inactive derivative of KN-93) in isogenic control dopaminergic neurons. Fractions were obtained from original total cell homogenate (Total). β-III-Tubulin (β-III-Tub) was used as a neural specific marker. Right, quantification of the ratio of synaptic membrane-associated parkin versus cytosolic parkin (n = 3 independent experiments, one-way ANOVA followed by Tukey’s test for multiple comparisons). (F) DA oxidation measured by NIRF assay (left) and quantification (right) in parkin mutant dopaminergic neurons transfected on day 60 with lentivirus empty vector, wild-type or S9/198A double-mutant parkin for 20 days (n = 3 independent experiments, one-way ANOVA followed by Tukey’s test for multiple comparisons). (G) DA oxidation measured by NIRF assay (left) and quantification (right) in parkin mutant dopaminergic neurons transfected on day 60 with lentivirus empty vector or S9/198D double-mutant parkin for 20 days (n = 3 independent experiments, unpaired two-tailed t test). (H) The S9E phosphomimetic mutation disrupts the parkin closed conformation. 1H-15N correlation spectra of the 15N-labeled Ubl domain (50 μM) from human parkin were acquired in the absence (left sides) and presence (right sides) of an equimolar parkin R0RBR fragment that contains a Ubl-binding site as part of the closed conformation. The spectrum of the wild-type Ubl domain (upper) more-or-less disappears when R0RBR is added due to the increase in molecular weight of the complex. The mutant Ubl domain gives a well-folded spectrum (lower) almost identical to the wild-type spectrum but is unaffected by the R0RBR addition. Spectra acquired at 25°C with ns = 8. All data are represented as mean ± SEM; ns, not significant; *p < 0.05; and **p < 0.01.
Figure 6.
Figure 6.. The localization of SYNJ1 and its interaction with endophilin A1 is disrupted by mutant parkin
(A) Left, SYNJ1 is increased in the cytosolic fraction (CYTO) and decreased in the synaptic membrane fraction (SM) in parkin mutant neurons (M1 and M2) compared with control neurons (C1 and C2). Fractions were obtained from original total cell homogenate (Total). β-III-Tubulin (β-III-Tub) was used as a neuralspecific marker. Right, quantification of the ratio of synaptic membrane-associated SYNJ1 versus cytosolic SYNJ1 (n = 3 independent experiments, one-way ANOVA followed by Tukey’s test for multiple comparisons). (B) Western blot (left) and quantification (right) of immunoprecipitated endogenous endophilin A1 (Endo A1) and co-immunoprecipitated endogenous SYNJ1 showing decreased SYNJ1/endophilin A1 binding in parkin mutant neurons (M1 and M2) compared with healthy control (C1 and C2) upon 50 mM KCl treatment for 2 min. 10% of input was loaded (n = 3 independent experiments, one-way ANOVA followed by Tukey’s test for multiple comparisons). (C) Western blot (left) and quantification (right) of immunoprecipitated endogenous SYNJ1 and co-immunoprecipitated ubiquitin (UB) (for ubiquitinated SYNJ1) showing that upon 50 mM KCl 2 min treatment, the SYNJ1 ubiquitination is increased in wild-type and phosphomimetic (S9/198D) but not E3 ligase activity dead (C431F) mutant parkin expressed parkin mutant neurons (M1) (n = 3 independent experiments, one-way ANOVA followed by Tukey’s test for multiple comparisons). (D) Western blot (left) and quantification (right) of immunoprecipitated anti-endophilin A1 (Endo A1) and co-immunoprecipitated endogenous SYNJ1 showing increased SYNJ1/Endo A1 binding upon 50 mM KCl treatment for 2 min, which is abolished by 2 μM KN93 treatment in isogenic control human dopaminergic neurons. 10% of input was loaded for the experiment (n = 3 independent experiments, one-way ANOVA followed by Tukey’s test for multiple comparisons). (E) Western blot (left) and quantification (right) of immunoprecipitated endogenous endophilin A1 (Endo A1) and co-immunoprecipitated SYNJ1 showing that upon 50 mM KCl 2 min treatment the interaction of SYNJ1 with Endo A1 is increased upon the expression of wild-type and phosphomimetic (S9/198D) but not E3 ligase activity dead mutant (C431F) parkin in parkin mutant neurons (M1) (n = 3 independent experiments, one-way ANOVA followed by Tukey’s test for multiple comparisons). All data are represented as mean ± SEM; *p < 0.05; **p < 0.01; ns, not significant.
Figure 7.
Figure 7.. Elevating endophilin A1 levels rescues accumulation of oxidized dopamine in mutant parkin patient neurons
(A) Left, clathrin is increased in cytosolic (CYTO) and decreased in synaptic membrane (SM) fractions of parkin mutant neurons (M1) transfected with lentivirus wild-type endophilin A1 (E) compared with neurons transfected with lentivirus empty vector (V). β-III-Tub was used as a neural specific marker. Right, quantification of the ratio of synaptic membrane-associated clathrin versus cytosolic clathrin (n = 3 independent experiments, one-way ANOVA followed by Tukey’s test for multiple comparisons). (B) DA oxidation (left) quantified (right) in human iPSC-derived dopaminergic neurons from familial PD mutant parkin-linked patients (M1 and M2) and the isogenic control (I-C) transfected with lentivirus empty vector (V) or endophilin A1 (E) for 60 days (n = 3 independent experiments, unpaired two-tailed t test). (C) DA oxidation (left) quantified (right) in human iPSC-derived dopaminergic neurons from healthy control (C1), familial PD mutant PINK1 patient and her sister who has both PINK1 and parkin mutation transfected on day 50 with lentivirus empty vector (V) or endophilin A1 (E) for 30 days (n = 3 independent experiments, one-way ANOVA followed by Tukey’s test for multiple comparisons). All data are represented as mean ± SEM; ns, not significant; *p < 0.05; **p < 0.01; and ***p < 0.005.

References

    1. Klein C, and Krainc D (2011). Movement disorders in 2011: translating new research findings into clinical practice. Nat. Rev. Neurol 8, 65–66. 10.1038/nrneurol.2011.212. - DOI - PubMed
    1. Surmeier DJ, Obeso JA, and Halliday GM (2017). Selective neuronal vulnerability in Parkinson disease. Nat. Rev. Neurosci 18, 101–113. 10.1038/nrn.2016.178. - DOI - PMC - PubMed
    1. Nguyen M, Wong YC, Ysselstein D, Severino A, and Krainc D (2019). Synaptic, mitochondrial, and lysosomal dysfunction in Parkinson’s disease. Trends Neurosci 42, 140–149. 10.1016/j.tins.2018.11.001. - DOI - PMC - PubMed
    1. Burbulla LF, Song PP, Mazzulli JR, Zampese E, Wong YC, Jeon S, Santos DP, Blanz J, Obermaier CD, Strojny C, et al. (2017). Dopamine oxidation mediates mitochondrial and lysosomal dysfunction in Parkinson’s disease. Science 357, 1255–1261. 10.1126/science.aam9080. - DOI - PMC - PubMed
    1. Edvardson S, Cinnamon Y, Ta-Shma A, Shaag A, Yim YI, Zenvirt S, Jalas C, Lesage S, Brice A, Taraboulos A, et al. (2012). A deleterious mutation in DNAJC6 encoding the neuronal-specific clathrin-uncoating co-chaperone auxilin, is associated with juvenile parkinsonism. PLoS One 7, e36458. 10.1371/journal.pone.0036458. - DOI - PMC - PubMed

Publication types

MeSH terms