. 2024 Jan:151:104609.
doi: 10.1016/j.mvr.2023.104609. Epub 2023 Sep 15.

Microvascular smooth muscle cells exhibit divergent phenotypic switching responses to platelet-derived growth factor and insulin-like growth factor 1

Affiliations

Microvascular smooth muscle cells exhibit divergent phenotypic switching responses to platelet-derived growth factor and insulin-like growth factor 1

Marisa A Bickel et al. Microvasc Res. 2024 Jan.

Abstract

Objective: Vascular smooth muscle cell (VSMC) phenotypic switching is critical for normal vessel formation, vascular stability, and healthy brain aging. Phenotypic switching is regulated by mediators including platelet derived growth factor (PDGF)-BB, insulin-like growth factor (IGF-1), as well as transforming growth factor-β (TGF-β) and endothelin-1 (ET-1), but much about the role of these factors in microvascular VSMCs remains unclear.

Methods: We used primary rat microvascular VSMCs to explore PDGF-BB- and IGF-1-induced phenotypic switching.

Results: PDGF-BB induced an early proliferative response, followed by formation of polarized leader cells and rapid, directionally coordinated migration. In contrast, IGF-1 induced cell hypertrophy, and only a small degree of migration by unpolarized cells. TGF-β and ET-1 selectively inhibit PDGF-BB-induced VSMC migration primarily by repressing migratory polarization and formation of leader cells. Contractile genes were downregulated by both growth factors, while other genes were differentially regulated by PDGF-BB and IGF-1.

Conclusions: These studies indicate that PDGF-BB and IGF-1 stimulate different types of microvascular VSMC phenotypic switching characterized by different modes of cell migration. Our studies are consistent with a chronic vasoprotective role for IGF-1 in VSMCs in the microvasculature while PDGF is more involved in VSMC proliferation and migration in response to acute activities such as neovascularization. Better understanding of the nuances of the phenotypic switching induced by these growth factors is important for our understanding of a variety of microvascular diseases.

Keywords: Aging; IGF-1; Microvascular VSMC; Microvessels; PDGF; Phenotypic switching; Somatotropic axis; Vascular smooth muscle cell.


Conflict of interest statement

Declaration of competing interest Marisa A. Bickel, David M. Sherry, Elizabeth C. Bullen, Michaela L. Vance, Eric W. Howard, and Shannon M. Conley declare no conflict of interest. Ken Jones is CEO for Bioinformatic Solutions, and declares no conflict of interest.

Figures

Figure 1.
Figure 1.. PDGF-BB and IGF-1 affect VSMCs through distinctly different pathways.
RNA from serum-starved control, IGF-1- (24 hour) and PDGF-BB- (48 hour) treated VSMCs was collected and processed for bulk RNAseq. A. PCA plot showing clustering of samples based on gene expression similarity. B. Venn diagram of total number differentially expressed genes (DEGs) between PDGF-BB- and IGF-1-treated cells when compared to the control (significance cutoff set at FDR adjusted p<0.05). C&D. Volcano plots showing the distribution of genes; DEGs are shown in blue (C) and green (D). A small number of genes involved in VSMC phenotypic switching are individually marked. Sequencing data were from 3 independent RNA samples per group, collected from at least two different experiments (i.e. cells that were cultured and treated at different times).
Figure 2.
Figure 2.. PDGF-BB and IGF1 induce distinct modes of migration in VSMCs.
A-C. VSMCs were cultured in plates with 2 mm diameter silicone rubber pegs attached to the bottom to create cell-free areas (CFA). To assess cell migration, images of the cell-free area (CFA) in each well were collected when the peg was removed (T=0 hours, black outline), and at intervals up to 48 hours after peg removal (T=48 hours, magenta outline), to determine the percentage of the cell-free area invaded by the VSMCs. Control VSMCs are shown in (A), PDGF-BB treated are in (B) and IGF-1 treated are in (C). D. Percent of the cell free area invaded by migrating VSMCs is plotted over time (mean ±SD). * indicates comparisons between PDGF-BB and control cells, + indicates comparisons between IGF-1 and control cells. One symbol, p≤0.05; two symbols, p≤0.01; four symbols, p≤0.0001 by two-way ANOVA with Tukey’s post-hoc comparison. N=4 wells per timepoint per group, from two independent timecourse experiments. Scale bar: 250 μm
Figure 3.
Figure 3.. Growth factors differentially affect VSMC migration.
A & C. Phase-contrast micrographs of VSMCs at the margin of the cell-free area (CFA) were captured after 48 hours of serum starvation followed by 48 hours of growth factor treatment as indicated. B. Percent migration of VSMCs into the cell-free area 48 hours after growth factor treatment is plotted. Cell morphology at the leading edges differs among groups as does the effect of inhibitory factors such as TGF-β and ET-1. D. Change in the circularity index of the migratory edge between T=0 and T=48 hours was measured as an indicator of the mode of VSMC migration under the indicated treatment conditions. Circularity index is 1 for a perfect circle and decreases as edge complexity increases. Plotted are means ± SD. Between-group differences were Analyzed by one-way ANOVA analysis with Tukey’s Multiple Comparison Test (*, p≤0.05; **, p≤0.01; ***, p≤0.001; n.s., not significant). Data are shown as mean ± SD. Scale bars: 100 μm. N=9-13 wells per group, from four independent experiments.
Figure 4.
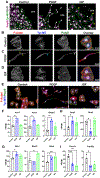
Figure 4.. Migratory polarization of VSMCs is differentially regulated by PDGF-BB versus IGF1.
A. VSMCs underwent migration assay. Cells were fixed after 48 hours of growth factor treatment and labeled for tyrosinated microtubules (magenta) and polyglutamylated proteins (green) to identify lamellipodia. Nuclei were counterstained with DAPI (gray). Images were captured at 10x magnification at the leading edge of migrating cell clusters. White arrowheads highlight specification of a leading edge lamellipodium. Blue * indicate empty areas between migrating cells treated with IGF-1, and yellow arrows highlight distribution of poly-glutamylated proteins on the leading side in IGF-1 treated cells. White arrows highlight smaller lamellipodia not forming at the leading edge. B-E. At 48 hrs post-growth factor treatment, non-confluent VSMCs were labeled for F-actin stress fibers (phalloidin, red); tyrosinated microtubules (Tyr MT, blue); polyglutamylated proteins (a marker for lamellipodia, PolyE, green), and nuclei (DAPI, gray) to assess changes in cell polarization and cytoskeletal arrangement with growth factor treatment. B-D. Shown are 1-2 cells per condition (20x), yellow arrows highlight rearrangement of actin stress fibers into subcortical actin in PDGF-BB treated cells. Blue arrows highlight rearrangement of microtubules. White arrowhead highlights accumulation of polyglutamylated proteins and specification of lamellipodia at the leading edge. E. Shown are additional example cells at lower magnification of overlay of each treatment group. F-I. Shown are expression values (FPKM) for DEGs from bulk RNAseq highlighting genes associated with lamellipodia, actin organization, cell polarization, and GTPase signaling. All graphs show mean FPKM ± SD and statistical significance was analyzed by ANOVA with FDR adjusted p-values. (*, p ≤0.05; **, p ≤0.01; and ***, p ≤0.001) Scale bars: 50 μm (A), 20 μm (B-E). B-E: Two wells of cells/treatment were analyzed in each experiment and experiments were repeated at least twice. F-I. Sequencing data were from 3 independent RNA samples per group, collected from at least two different experiments (i.e. cells that were cultured and treated at different times).
Figure 5.
Figure 5.. TGF-β and ET-1 suppress migratory polarization.
A. VSMCs underwent migration assay, and were labeled (48 hours post-growth factor treatment) for tyrosinated microtubules (magenta), polyglutamylated proteins (green), and nuclei (gray). Images were captured at 10x magnification at the leading edge of migrating cell clusters. White arrowheads highlight specification of a leading edge lamellipodium. White arrows highlight smaller lamellipodia not forming at the leading edge. B-F. Non-confluent VSMCs were fixed and immunolabeled after 48 hours of growth factor treatment. Cells were labeled for F-actin stress fibers (phalloidin, red); tyrosinated microtubules (Tyr MT, blue); polyglutamylated proteins (a marker for lamellipodia, PolyE, green), and nuclei (DAPI, gray) to assess changes in cell polarization and cytoskeletal arrangement with the addition of inhibitory factors (TGF-β, ET-1). B-E. Shown are 1-2 cells per condition imaged at 20x magnification. White arrowhead highlights accumulation of polyglutamylated proteins and specification of lamellipodia at the leading edge. F. Shown are additional example cells. G-I. Individual cell morphometry was analyzed after either 24 or 48 hours of growth factor treatment using fluorescently labeled images of sparsely plated cells (as in B-F). Shown are polarity index (F), cell area (G), and cell perimeter (H). N=20-48 individual cells analyzed per group per timepoint, experiments were repeated 2-5 times per condition, and analyzed cells came from multiple coverslips in each experiment. Data were analyzed by two-way ANOVA analysis with Tukey’s multiple comparison correction (*, p≤0.05; **, p≤0.01; ***, p≤0.001; ****, p≤0.0001). Data are shown as mean ± SD. Scale bars: 20 μm.
Figure 6
Figure 6. VSMC transcription factors are altered by growth factor treatment.
RNA from VSMCs stimulated with PDGF-BB, IGF-1, or without stimulation were harvested and analyzed by RNAseq (see Fig. 1). A-E. Shown are expression values (FPKM) for select VSMC transcription factors associated with phenotypic switching. Also included are some transcription factors associated with age-related pathologies such as atherosclerosis and cerebral small vessel disease (D), and those associated with epithelial-to-mesenchymal transition (C). Sequencing data were from 3 independent samples per group. All graphs show mean FPKM ± SD. Statistical significance was analyzed by ANOVA (FDR adjusted p values: *, p ≤0.05; **, p ≤0.01; and ***, p ≤0.001). Sequencing data were from 3 independent RNA samples per group, collected from at least two different experiments (i.e. cells that were cultured and treated at different times).
Figure 7:
Figure 7:. Summary of differential effects of IGF-1 and PDGF-BB on microvascular smooth muscle cell phenotypic switching.
Diagram illustrates main findings. Shown on the left and right are select genes identified from our RNAseq analyses that are differentially regulated by PDGF-BB and IGF-1 and have been previously associated with the listed cellular functions (in-text references and [120-128]).

Similar articles

Cited by

References

    1. Savji N., et al., Association between advanced age and vascular disease in different arterial territories: a population database of over 3.6 million subjects. J Am Coll Cardiol, 2013. 61(16): p. 1736–43. - PubMed
    1. Csipo T., et al., Assessment of age-related decline of neurovascular coupling responses by functional near-infrared spectroscopy (fNIRS) in humans. Geroscience, 2019. 41(5): p. 495–509. - PMC - PubMed
    1. Ungvari Z., et al., Mechanisms of Vascular Aging, A Geroscience Perspective: JACC Focus Seminar. J Am Coll Cardiol, 2020. 75(8): p. 931–941. - PMC - PubMed
    1. Meng H., et al., Synthetic VSMCs induce BBB disruption mediated by MYPT1 in ischemic stroke. iScience, 2021. 24(9): p. 103047. - PMC - PubMed
    1. Farina FM, et al., miR-128-3p Is a Novel Regulator of Vascular Smooth Muscle Cell Phenotypic Switch and Vascular Diseases. Circ Res, 2020. 126(12): p. e120–e135. - PubMed

Publication types

MeSH terms

Substances

LinkOut - more resources