. 2023 Oct 10:574:216384.
doi: 10.1016/j.canlet.2023.216384. Epub 2023 Sep 14.

Multi-omic analysis reveals metabolic pathways that characterize right-sided colon cancer liver metastasis

Affiliations

Multi-omic analysis reveals metabolic pathways that characterize right-sided colon cancer liver metastasis

Montana T Morris et al. Cancer Lett. .

Abstract

There are well demonstrated differences in tumor cell metabolism between right sided (RCC) and left sided (LCC) colon cancer, which could underlie the robust differences observed in their clinical behavior, particularly in metastatic disease. As such, we utilized liquid chromatography-mass spectrometry to perform an untargeted metabolomics analysis comparing frozen liver metastasis (LM) biobank samples derived from patients with RCC (N = 32) and LCC (N = 58) to further elucidate the unique biology of each. We also performed an untargeted RNA-seq and subsequent network analysis on samples derived from an overlapping subset of patients (RCC: N = 10; LCC: N = 18). Our biobank redemonstrates the inferior survival of patients with RCC-derived LM (P = 0.04), a well-established finding. Our metabolomic results demonstrate increased reactive oxygen species associated metabolites and bile acids in RCC. Conversely, carnitines, indicators of fatty acid oxidation, are relatively increased in LCC. The transcriptomic analysis implicates increased MEK-ERK, PI3K-AKT and Transcription Growth Factor Beta signaling in RCC LM. Our multi-omic analysis reveals several key differences in cellular physiology which taken together may be relevant to clinical differences in tumor behavior between RCC and LCC liver metastasis.

Keywords: Bile acids; EGFR; Laterality; Metabolomics; ROS; TGF-β.


Conflict of interest statement

Declaration of competing interest The authors declare that they have no known competing financial interests or personal relationships that could have appeared to influence the work reported in this paper.

Figures
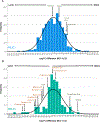
Figure 1
Figure 1. RL Distribution of Bile Acids and Carnitines.
This figure shows the location on each Right-Left (RL) distribution of key metabolites belonging to the class of carnitine (orange) or bile acid (dark green). Panel A represents those metabolites detected in HILIC (−) mode, and panel B those detected in RPLC (+) mode. The RL-Index of each metabolite is a measure of their preference for either the left or right side, based on the distribution of differences in normalized abundances (log fold change difference from normal liver) for each metabolite between the two sides (RCC-LCC). -CA = carnitine; GCDCA = glycochenodeoxycholic acid; TDCA = taurodeoxycholic acid; TLCA-SO4 = Taurolithocholic acid sulfate; GDCA = glycodeoxycholic acid; DCA = deoxycholic acid; HILIC = hydrophilic interaction liquid chromatography; RPLC = reverse phase liquid chromatography
Figure 2
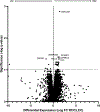
Figure 2. Differential Expression Analysis of RCC versus LCC.
This figure shows a volcano plot of all the genes selected for analysis by differential expression between RCC and LCC. The significance is calculated by taking the negative log10 of the Benjamini-Hochberg (BH FDR)-corrected Welch’s T-test for each comparison. Differential expression is displayed as the log of the fold change of FPKM (Fragments per kilobase of transcript per million mapped reads) normalized abundance between right (RCC) and left (LCC) side derived tumors. The horizonal line represents a significance cutoff of α<0.1, and those genes meeting the threshold of α<0.05 are labelled.
Figure 3
Figure 3. IPA Network Analysis of Top Differentially Expressed (DE) Genes.
An IPA nodal network analysis was carried out with default network settings, utilizing all genes from the DE analysis meeting the significance threshold of α<0.1. The figure shows the top network generated, with a score of 52. The legend in the top left guides interpretation of the relationships. Nodal shapes correspond to molecular functions. Vertical Rhombi represent enzymes, horizontal rhombi represent peptidases, double circles represent complexes and molecular groups, horizontal ovals represent transcription regulators, vertical ovals represent transmembrane receptions and squares represent cytokines. Circles are nonspecific.
Figure 4
Figure 4. Immunohistochemistry of TGF-β and CERCAM of RCC and LCC Liver Metastasis Cohorts.
Left panel shows representative immunohistochemical staining for TGF-β and CERCAM in RCC and LCC-derived metastatic liver tumor samples. Right panel shows the percentage of cells positively stained for TGF-β and CERCAM, with higher expression in the RCC cohort (N=4) than that in the LCC-derived liver metastasis cohort (N=4). All values are presented as mean ± standard deviation. Student’s t-test was used ***p ≤ 0.001
Figure 5
Figure 5. Potential Mechanisms of Pathogenicity and EGFRi Resistance in RCC LM.
This summarizes the findings that suggest potential candidate mechanisms for RCC resistance to EGFR inhibitor therapy. Dark colored or glowing elements indicate observed or IPA-predicted findings (i.e., a differentially expressed gene, or metabolite class), with green elements signifying upregulation, and red downregulation. These elements are also labelled by corresponding colored arrows. Differentially expressed genes are indicated with asterisks corresponding to level of significance and predicted differential regulation of molecules (via IPA) are indicated with crosses (*<0.05, **<0.01; ††<0.01, †††<0.001). Finally, both the MEK-ERK and PI3K-AKT pathways were predicted to be significantly upregulated by the IPA Network Analysis, which is indicated by their enlarged activation arrows and green highlights.

References

    1. Petrelli F, Tomasello G, Borgonovo K, Ghidini M, Turati L, Dallera P, Passalacqua R, Sgroi G, Barni S, Prognostic Survival Associated With Left-Sided vs Right-Sided Colon Cancer: A Systematic Review and Meta-analysis, JAMA Oncol, 3 (2017) 211–219. - PubMed
    1. Yahagi M, Okabayashi K, Hasegawa H, Tsuruta M, Kitagawa Y, The Worse Prognosis of Right-Sided Compared with Left-Sided Colon Cancers: a Systematic Review and Meta-analysis, J Gastrointest Surg, 20 (2016) 648–655. - PubMed
    1. Narayanan S, Gabriel E, Attwood K, Boland P, Nurkin S, Association of Clinicopathologic and Molecular Markers on Stage-specific Survival of Right Versus Left Colon Cancer, Clin Colorectal Cancer, 17 (2018) e671–e678. - PMC - PubMed
    1. Meguid RA, Slidell MB, Wolfgang CL, Chang DC, Ahuja N, Is there a difference in survival between right- versus left-sided colon cancers?, Ann Surg Oncol, 15 (2008) 2388–2394. - PMC - PubMed
    1. Wang ZX, Wu HX, He MM, Wang YN, Luo HY, Ding PR, Xie D, Chen G, Li YH, Wang F, Xu RH, Chemotherapy With or Without Anti-EGFR Agents in Left- and Right-Sided Metastatic Colorectal Cancer: An Updated Meta-Analysis, J Natl Compr Canc Netw, 17 (2019) 805–811. - PubMed

Publication types

Substances