. 2023 Sep 16;21(1):630.
doi: 10.1186/s12967-023-04494-9.

A novel NET-related gene signature for predicting DLBCL prognosis

Affiliations

A novel NET-related gene signature for predicting DLBCL prognosis

Huizhong Shi et al. J Transl Med. .

Abstract

Background: Diffuse large B-cell lymphoma (DLBCL) is an aggressive malignancy. Neutrophil extracellular traps (NETs) are pathogen-trapping structures in the tumor microenvironment that affect DLBCL progression. However, the predictive function of NET-related genes (NRGs) in DLBCL has received little attention. This study aimed to investigate the interaction between NRGs and the prognosis of DLBCL as well as their possible association with the immunological microenvironment.

Methods: The gene expression and clinical data of patients with DLBCL were downloaded from the Gene Expression Omnibus database. We identified 148 NRGs through the manual collection of literature. GSE10846 (n = 400, GPL570) was used as the training dataset and divided into training and testing sets in a 7:3 ratio. Univariate Cox regression analysis was used to identify overall survival (OS)-related NETs, and the least absolute shrinkage and selection operator was used to evaluate the predictive efficacy of the NRGs. Kaplan-Meier plots were used to visualize survival functions. Receiver operating characteristic (ROC) curves were used to assess the prognostic predictive ability of NRG-based features. A nomogram containing the clinical information and prognostic scores of the patients was constructed using multivariate logistic regression and Cox proportional risk regression models.

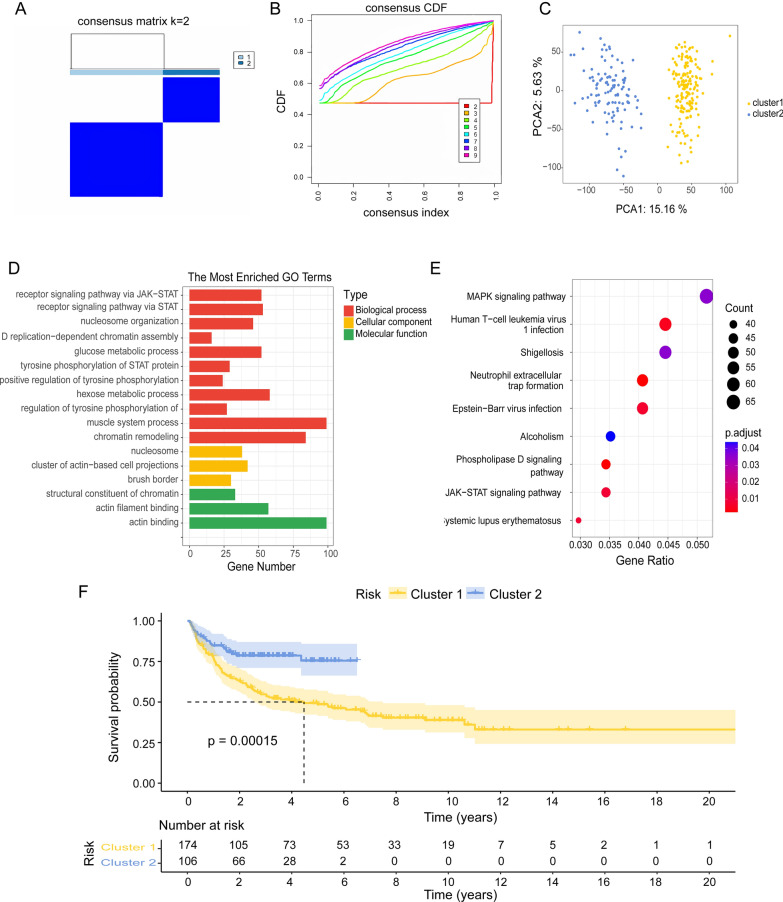
Results: We identified 36 NRGs that significantly affected patient overall survival (OS). Eight NRGs (PARVB, LYZ, PPARGC1A, HIF1A, SPP1, CDH1, S100A9, and CXCL2) were found to have excellent predictive potential for patient survival. For the 1-, 3-, and 5-year survival rates, the obtained areas under the receiver operating characteristic curve values were 0.8, 0.82, and 0.79, respectively. In the training set, patients in the high NRG risk group presented a poorer prognosis (p < 0.0001), which was validated using two external datasets (GSE11318 and GSE34171). The calibration curves of the nomogram showed that it had excellent predictive ability. Moreover, in vitro quantitative real-time PCR (qPCR) results showed that the mRNA expression levels of CXCL2, LYZ, and PARVB were significantly higher in the DLBCL group.

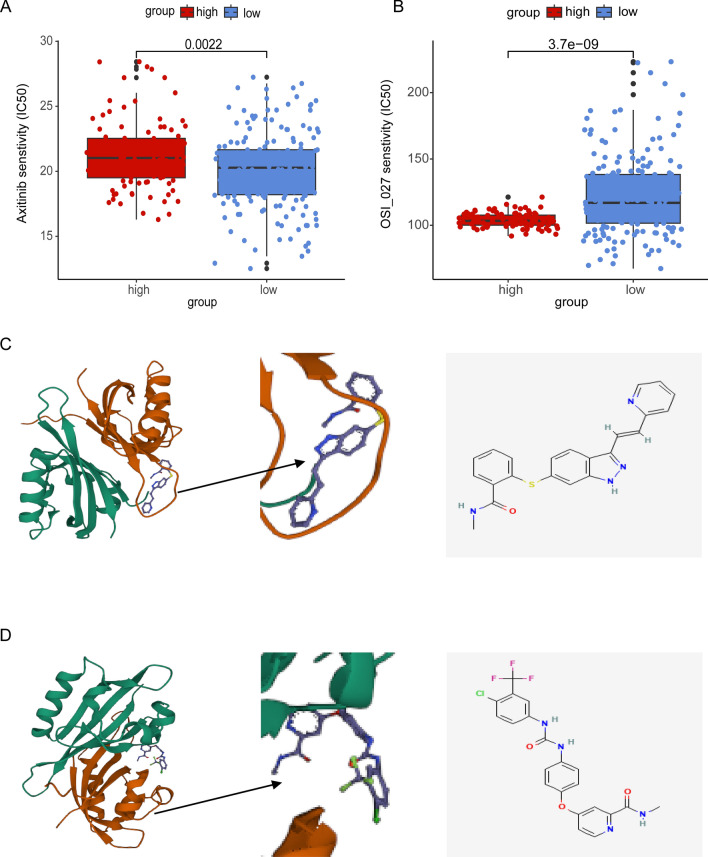
Conclusions: We developed a genetic risk model based on NRGs to predict the prognosis of patients with DLBCL, which may assist in the selection of treatment drugs for these patients.

Keywords: Diffuse large B-cell lymphoma; Neutrophil extracellular traps; Prognostic biomarker; Prognostic model; Tumor microenvironment.


Conflict of interest statement

The authors declare that they have no competing financial interests exist.

Figures

Fig. 1
Fig. 1
Consensus clustering and functional annotation of DEGs between the two clusters. A, B Consensus matrix heatmap defining two clusters (k = 2) and their correlation area. C PCA showing a clear difference in the transcriptomes between cluster 1 (n = 174) and cluster 2 (n = 106). D, E GO and KEGG enrichment analyses of DEGs between two clusters. F Kaplan–Meier curves for OS of the two clusters
Fig. 2
Fig. 2
Screening for prognosis-related NRGs and functional identification of DEGs between high- and low-risk groups. A Venn diagram analysis showing the overlap of NET sets and univariate Cox results. B Establishment of signatures via least absolute shrinkage and selection operator (LASSO) logistic regression analysis. The 36 genes are represented by different colors in the LASSO coefficient profile. C Selection of the optimal parameter (lambda) in the LASSO model, and generation of a coefficient profile plot. DF Bubble charts depicting GO-enriched DEG items in three functional categories: biological processes (BP, D), cell composition (CC, E), and molecular function (MF, F)
Fig. 3
Fig. 3
Evaluation of prognostic signature to predict the OS of patients with DLBCL. A Patients in the high-risk group had significantly shorter OS than those in the low-risk group. B ROC curves for predicting the 1-, 3-, and 5-year survival according to the NRGs score in the training cohort. C Univariate Cox regression analysis of the risk scores and clinical parameters. D Multivariate Cox regression analysis of the risk scores and cliAaa clinical parameters. E, F Ranked dot and scatter plots showing the NRGs score distribution and patient survival status. G NRG risk model gene expression value
Fig. 4
Fig. 4
Validation of the NRG prognostic signature on DLBCL cohorts. A Kaplan–Meier curve of the prognostic model in the validation cohort. B ROC curves for predicting the 1-, 3-, and 5-year survival according to the NRGs score in the validation cohort. C Kaplan–Meier curve of the prognostic model in the GSE11318 cohort. D ROC curves for predicting the 1-, 3-, and 5-year survival according to the NRGs score in the GSE11318 cohort. E Kaplan–Meier curve of the prognostic model in the GSE34171 cohort. F ROC curves for predicting the 1-, 3-, and 5-year survival according to the NRGs score in the GSE34171 cohort
Fig. 5
Fig. 5
Construction and validation of a nomogram. A Nomogram for predicting the 1-, 3-, and 5-year OS of patients with DLBCL in the training cohort. BD Calibration curves of the clinicopathologic nomogram predicted and observed 1-, 3-, and 5-year survival of patients with DLBCL
Fig. 6
Fig. 6
Tumor immune microenvironment analysis of the high- and low-risk groups. A Difference between tumor-infiltrating immune cells. The blue box reflects the low-risk group and the red box represents the high-risk group. B Heatmap showing Spearman’s correlations between differential immune cells and eight OS-related NRGs. Blue denotes a negative correlation and red denotes a positive correlation. The correlation coefficient increases with the degree of color. *p < 0.05, **p < 0.01, ***p < 0.001
Fig. 7
Fig. 7
Pearson correlation of the risk scores of the targets of immunotherapy and targeted therapy. A CTLA4. B DOT1L. C CD47. D IDH1. E IDH2. F MCL1. G MDM2. H PLK1. I CHEK1. J ASXL1. K BCL2. L CD33
Fig. 8
Fig. 8
Relationships between risk score and therapeutic sensitivity and molecular docking simulation. A Treatment response of axitinib. B Treatment response of OSI_027. C Left: HIF1A- AXITINIB. Right: Chemical formula of AXITINIB. D Left: HIF1A-SORAFENIB. Right: Chemical formula for SORAFENIB
Fig. 9
Fig. 9
Relative expression of the eight NRGs was assessed by qPCR. A CDH1. B CXCL2. C HIF1A. D LYZ. E PARVB. F PPARGCA1. G S100A9. H SPP1. *p < 0.05, **p < 0.01, ***p < 0.001

References

    1. Sehn LH, Salles G. Diffuse large B-cell lymphoma. N Engl J Med. 2021;384(9):842–858. - PMC - PubMed
    1. International Non-Hodgkin's Lymphoma Prognostic Factors Project A predictive model for aggressive non-Hodgkin's lymphoma. N Engl J Med. 1993;329(14):987–994. - PubMed
    1. Sehn LH, et al. The revised International Prognostic Index (R-IPI) is a better predictor of outcome than the standard IPI for patients with diffuse large B-cell lymphoma treated with R-CHOP. Blood. 2007;109(5):1857–1861. - PubMed
    1. Zhou Z, et al. An enhanced International Prognostic Index (NCCN-IPI) for patients with diffuse large B-cell lymphoma treated in the rituximab era. Blood. 2014;123(6):837–842. - PMC - PubMed
    1. Olszewski AJ, Winer ES, Castillo JJ. Validation of clinical prognostic indices for diffuse large B-cell lymphoma in the National Cancer Data Base. Cancer Causes Control. 2015;26(8):1163–1172. - PubMed

Publication types