. 2023 Sep 16;14(1):5758.
doi: 10.1038/s41467-023-41385-5.

Performance of tumour microenvironment deconvolution methods in breast cancer using single-cell simulated bulk mixtures

Affiliations

Performance of tumour microenvironment deconvolution methods in breast cancer using single-cell simulated bulk mixtures

Khoa A Tran et al. Nat Commun. .

Abstract

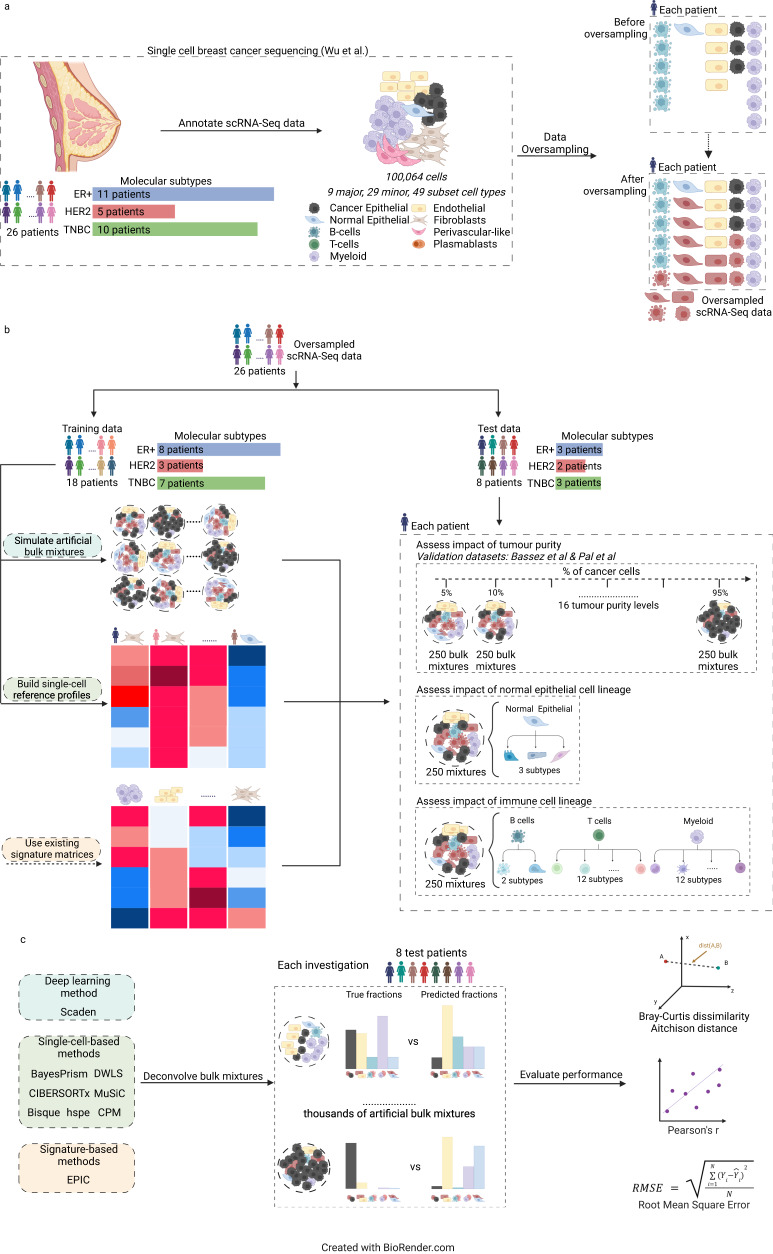
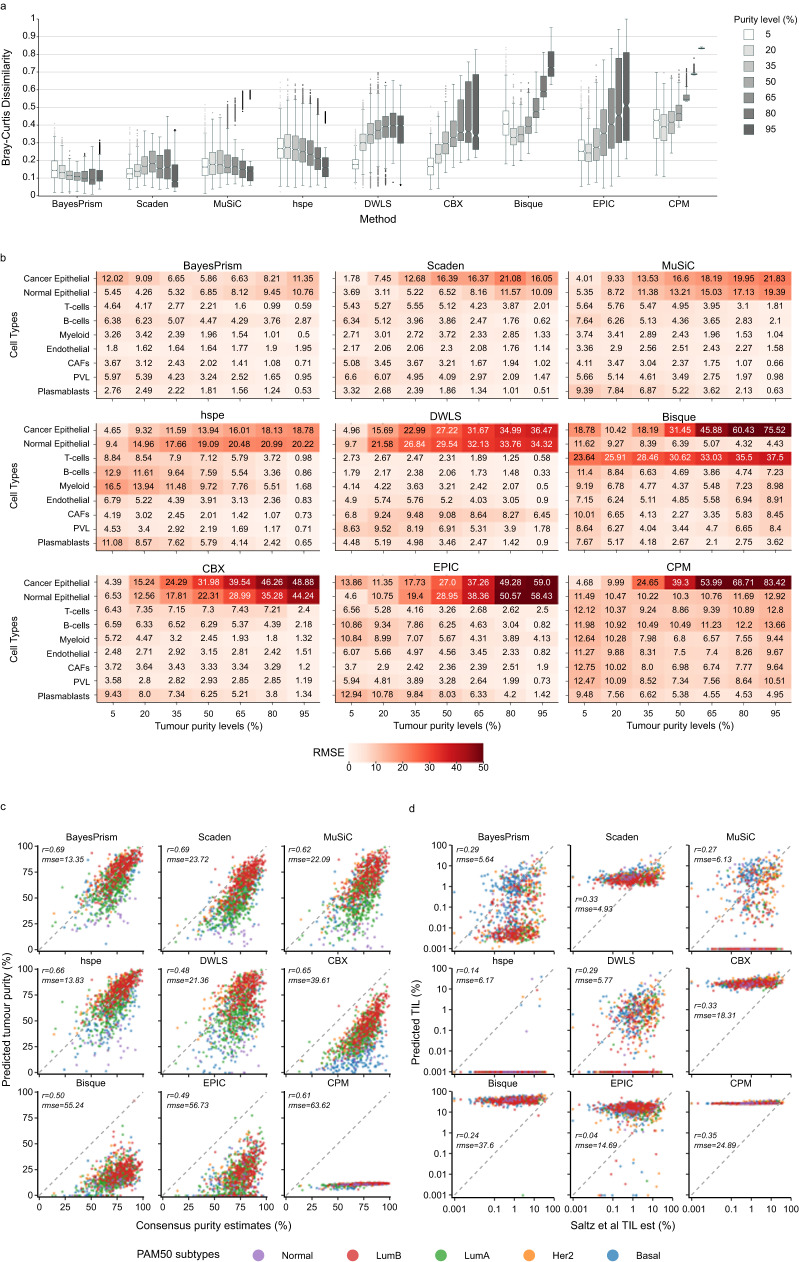
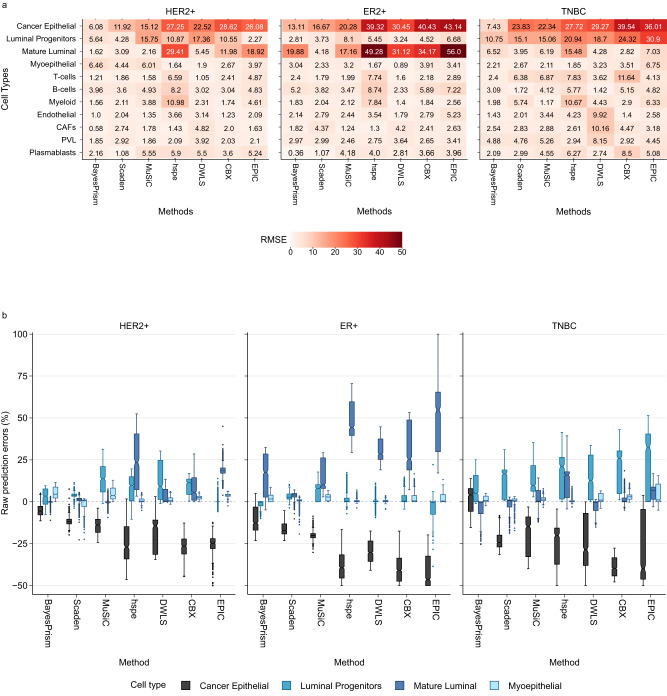
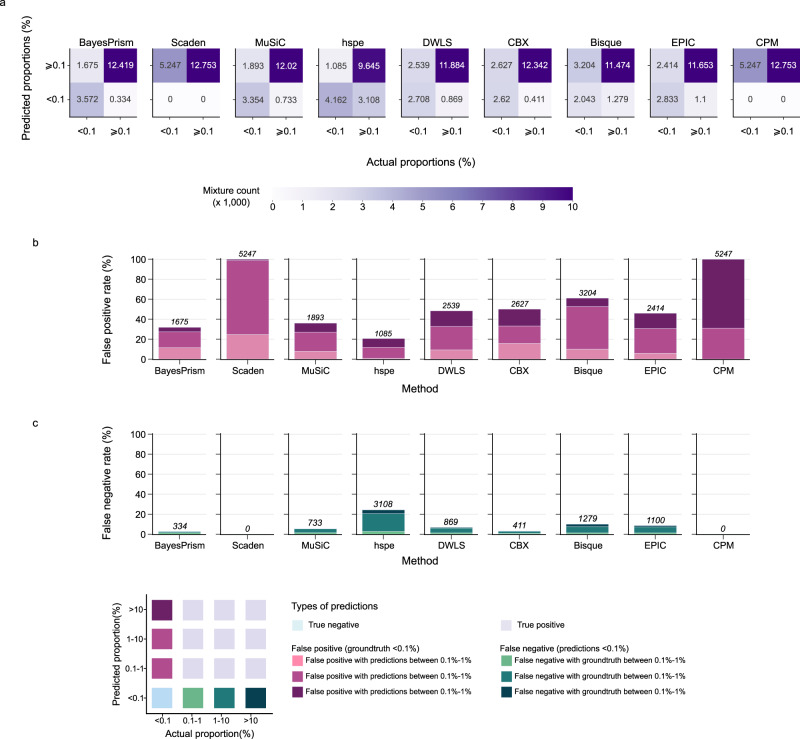
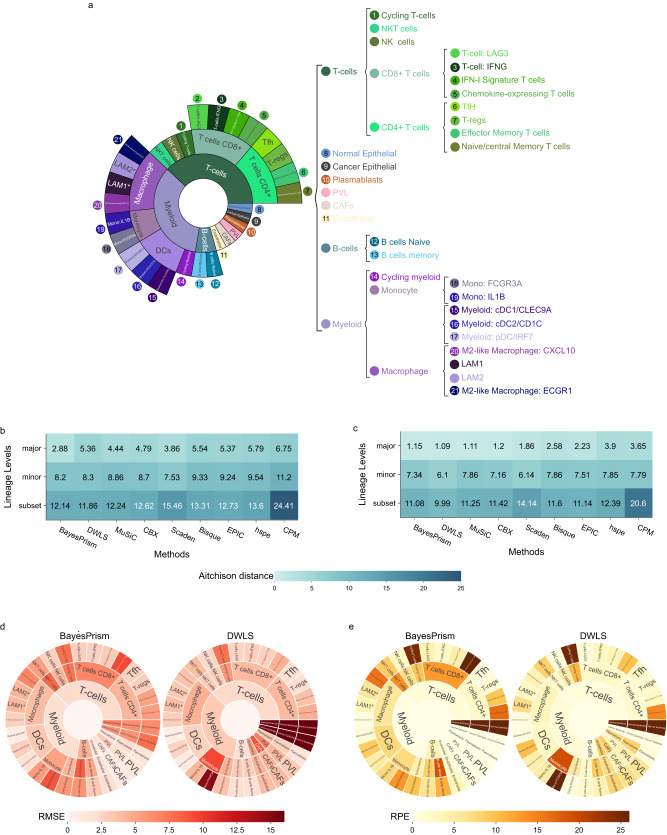
Cells within the tumour microenvironment (TME) can impact tumour development and influence treatment response. Computational approaches have been developed to deconvolve the TME from bulk RNA-seq. Using scRNA-seq profiling from breast tumours we simulate thousands of bulk mixtures, representing tumour purities and cell lineages, to compare the performance of nine TME deconvolution methods (BayesPrism, Scaden, CIBERSORTx, MuSiC, DWLS, hspe, CPM, Bisque, and EPIC). Some methods are more robust in deconvolving mixtures with high tumour purity levels. Most methods tend to mis-predict normal epithelial for cancer epithelial as tumour purity increases, a finding that is validated in two independent datasets. The breast cancer molecular subtype influences this mis-prediction. BayesPrism and DWLS have the lowest combined numbers of false positives and false negatives, and have the best performance when deconvolving granular immune lineages. Our findings highlight the need for more single-cell characterisation of rarer cell types, and suggest that tumour cell compositions should be considered when deconvolving the TME.


Conflict of interest statement

J.V.P. and N.W. are co-founders of genomiQa. O.K. has consulted for XING Technologies on development of diagnostic assays for HR deficiency. The remaining authors declare that there are no competing interests.

Figures

Fig. 1
Fig. 1. Experimental design of the benchmarking study.
Workflow to benchmark performance of nine transcriptomic-based TME deconvolution methods in different biological conditions using scRNA-seq breast cancer data. a Annotated scRNA-seq data from Wu et al. is oversampled so that within each patient, the number of cells in the less abundant cell types matches the number in the most abundant cell type. b Oversampled scRNA-seq data are assigned to train data (n = 18 patients) and test data (n = 8 patients). Train data was used to generate either artificial bulk mixtures or single-cell reference matrix as input to the different TME deconvolution methods (left block). Test data was used to generate artificial bulk mixtures for different benchmarking investigations (tumour purity, normal epithelial cell lines, immune cell linage) (right block). c Within each investigation, the overall deconvolution performance of the nine benchmarked methods was evaluated using Bray-Curtis dissimilarity, Aitchison distance, RMSE and Pearson’s r, while the performance of predicting individual components was assessed using RMSE. ER+: estrogen receptor positive, HER2+: Human Epidermal growth factor Receptor 2 positive, TME: tumour microenvironment, TNBC: triple-negative breast cancer, RMSE: Root Mean Square Error, scRNA-seq: single-cell RNA sequencing. Figure was made using BioRender.com.
Fig. 2
Fig. 2. Impact of variable tumour purity on deconvolution.
a Bray-Curtis dissimilarity between predicted and ground truth cell compositions across 7 tumours purity levels (from 5% to 95%, 15% interval). Deconvolution methods are organised in order of decreasing performance based on their median Bray-Curtis dissimilarity values. n = 2000 artificial bulk at each purity level. Each box represents the middle 50% of Bray-Curtis values, which includes the first quartile (Q1), the median, and the third quartile (Q3). Upper and lower whiskers depict maxima and minima of Bray-Curtis values, excluding outliers. Outliers are Bray-Curtis values that are more than 1.5x the interquartile range from either Q1 or Q3. Higher Bray-Curtis dissimilarity indicates poorer performance. b Median RMSE between predicted and actual cell compositions, aggregated by cell type. Seven tumour purity levels are shown (from 5% to 95%, 15% interval). Darker shade of red represents higher RMSE values and poorer performance, with numeric RMSE values shown. Major cell types (y-axis) are organised into three categories: epithelial (normal epithelial and cancer epithelial), immune (T-cells, B-cells and myeloid), and stromal cells (endothelial, CAFs, PVL and plasmablasts). CAFs: Cancer Associated Fibroblasts, PVL: Perivascular-like, RMSE: Root Mean Square Error. Scatter plots of predicted tumour purity (cancer epithelial proportions, y-axis) versus tumour purity derived from copy number variations by Aran et al. (x-axis) in linear scale (c), and predicted lymphocytes (T-cells and B-cells, y-axis) versus tumour-infiltrating lymphocytes (TIL) estimations by Saltz et al. (x-axis) in log scale (d). Each point represents one bulk mixture from TCGA breast cancer patient, with its colour representing the associated molecular subtypes. Dotted 45-degree diagonal line represents perfect prediction where predicted proportions match actual proportions. Each subplot is annotated with its correlation coefficient (r) and root mean square error (rmse). Source data are provided as a Source Data file.
Fig. 3
Fig. 3. Impact of normal epithelial lineages and molecular subtypes on deconvolution.
a RMSE between predicted and actual cell compositions, aggregated by molecular subtypes (HER2+, ER+ and TNBC). Darker shade of red represents higher RMSE values and poorer performance, with numeric RMSE values shown. Cell types (y-axis) are organised into four categories: cancer epithelial, normal epithelial (luminal progenitors, mature luminal and myoepithelial), immune (T-cells, B-cells and myeloid), and stromal cells (endothelial, CAFs, PVL and plasmablasts). CAFs: Cancer Associated Fibroblasts, PVL: Perivascular-like, RMSE: Root Mean Square Error. b Raw prediction errors of seven methods, BayesPrism, Scaden, MuSiC, CBX, DWLS, hspe and EPIC, for cancer epithelial and three minor subtypes of normal epithelial cells aggregated by molecular subtypes (HER2+, ER+ and TNBC). Higher positive and lower negative raw prediction errors represent poorer performance. Mixtures were synthesised at a fixed purity level of 50% using three minor cell types of normal epithelial cells and eight other major cell types (cancer epithelial, T-cells, B-cells, myeloid, endothelial, CAFs, plasmablasts and PVL). n = 2000 artificial bulk mixtures. Each box represents the middle 50% of raw prediction errors, which includes the first quartile (Q1), the median, and the third quartile (Q3). Upper and lower whiskers depict maxima and minima of raw prediction errors, excluding outliers. Outliers are raw prediction errors that are more than 1.5x the interquartile range from either Q1 or Q3. Zero line indicates a perfect match between prediction and ground truth. Source data are provided as a Source Data file.
Fig. 4
Fig. 4. The performance of the nine deconvolution methods assessed by false positive and false negative rates.
a Confusion matrices depicting all nine methods’ performance on predicting whether a cell type is absent (< 0.1%) or present (≥ 0.1%) in a mixture. For each confusion matrix, x-axis represents predicted absence/presence, y-axis represents actual absence/presence, and false positive, true positive, false negative, and true negative numbers are aggregated across all cell types. b Predicting cell type presence when cell type absent in the mixture. Percentages of the three levels of false positives out of the total number of false positives and true negatives (actual proportion <0.1%). Counts of false positives are shown above each bar for all cell types. c Predicting cell type absence when cell type present in the mixture. Percentages of the three levels of false negatives out of total number of all false negatives and true positives (predicted proportions <0.1%). Counts of false negatives are shown above each bar for all cell types. Figure legend for both (b) and (c) illustrates definitions of true negative, false positive, true positive, and false negative predictions. The more accurate a method in predicting presence/absence, the lower false positive rates and false negative rates are. Source data are provided as a Source Data file.
Fig. 5
Fig. 5. Impact of immune lineages on deconvolution.
a The relationship of immune cells in the major, minor and subset cell types. b, c Aitchison distance between predicted and actual compositions of 2000 mixtures containing 23 subset cell types of T-cells, B-cells and myeloid at 50% tumour purity level. The median Aitchison distance across 2000 mixtures is shown for each of the nine methods using either b all cell types or c only immune cell types. Lighter shade of teal indicates smaller Aitchison distance and between performance. RMSE (red) (d) and RPE (orange) (e) between predicted and actual cell proportions of BayesPrism and DWLS, aggregated into major, minor and subset cell types. Darker shades of red and orange represent higher RMSE and RPE values and poorer performance, respectively. Cancer epithelial, normal epithelial, endothelial, CAFs, PVL and plasmablast cell types were used for artificial bulk simulation at all three levels and, therefore, possess three sets of RMSE and RPE values across the lineage levels. Several minor immune cell types, such as NK cells or memory B-cells, do not have any subset cell types and were therefore re-used at the subset level, resulting in two sets of RMSE and RPE values at minor and subset level. RMSE: Roost Mean Square Error, RPE: relative proportion error. Source data are provided as a Source Data file.

References

    1. Balkwill FR, Capasso M, Hagemann T. The tumor microenvironment at a glance. J. Cell Sci. 2012;125:5591–5596. - PubMed
    1. Runa F, et al. Tumor Microenvironment Heterogeneity: Challenges and Opportunities. Curr. Mol. Biol. Rep. 2017;3:218–229. - PMC - PubMed
    1. Zhang L, et al. Intratumoral T Cells, Recurrence, and Survival in Epithelial Ovarian Cancer. N. Engl. J. Med. 2003;348:203–213. - PubMed
    1. Syn NL, Teng MWL, Mok TSK, Soo RA. De-novo and acquired resistance to immune checkpoint targeting. Lancet Oncol. 2017;18:e731–e741. - PubMed
    1. Newell F, et al. Multiomic profiling of checkpoint inhibitor-treated melanoma: Identifying predictors of response and resistance, and markers of biological discordance. Cancer Cell. 2022;40:88–102.e7. - PubMed

Publication types