. 2023 Sep 16;14(1):5764.
doi: 10.1038/s41467-023-41511-3.

Phenylalanine-tRNA aminoacylation is compromised by ALS/FTD-associated C9orf72 C4G2 repeat RNA

Affiliations

Phenylalanine-tRNA aminoacylation is compromised by ALS/FTD-associated C9orf72 C4G2 repeat RNA

Mirjana Malnar Črnigoj et al. Nat Commun. .

Abstract

The expanded hexanucleotide GGGGCC repeat mutation in the C9orf72 gene is the main genetic cause of amyotrophic lateral sclerosis and frontotemporal dementia. Under one disease mechanism, sense and antisense transcripts of the repeat are predicted to bind various RNA-binding proteins, compromise their function and cause cytotoxicity. Here we identify phenylalanine-tRNA synthetase (FARS) subunit alpha (FARSA) as the main interactor of the CCCCGG antisense repeat RNA in cytosol. The aminoacylation of tRNAPhe by FARS is inhibited by antisense RNA, leading to decreased levels of charged tRNAPhe. Remarkably, this is associated with global reduction of phenylalanine incorporation in the proteome and decrease in expression of phenylalanine-rich proteins in cellular models and patient tissues. In conclusion, this study reveals functional inhibition of FARSA in the presence of antisense RNA repeats. Compromised aminoacylation of tRNA could lead to impairments in protein synthesis and further contribute to C9orf72 mutation-associated pathology.


Conflict of interest statement

The authors declare no competing interests.

Figures

Fig. 1
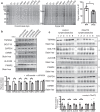
Fig. 1. Antisense RNA from the C9orf72 mutation binds various proteins.
a Schematic representation of the RNA pull-down assay and RNA constructs used in the experiments. b Silver stained SDS-PAGE gels with labelled bands analyzed with mass spectrometry. The proteins were obtained with RNA pull-down assay performed on the nuclear and cytoplasmic fractions of mouse brain lysate. The RNA constructs 32×C4G2-S1m and S1m were used. Results were repeated in two independent experiments. c The identified proteins detected as interactors with western blot from the RNA pull-down assay performed on protein lysates from human postmortem brain tissue with 32×C4G2-S1m and control RFP-S1m and S1m RNA constructs. Results were repeated in two independent experiments. Source data are provided as a Source data file.
Fig. 2
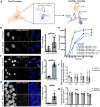
Fig. 2. FARSA interacts with antisense RNA in the nucleus and cytoplasm of C9orf72 patient-derived cells and the presence of C4G2 RNA reduces aminoacylation of tRNAPhe.
a Schematic representation (created with Biorender.com) of RNA-protein proximity ligation assay (PLA). Increased PLA signals in C9orf72 patient-derived cells with expanded repeats relative to controls: 0.78 ± 0.36 in three control (ncells = 545) versus 2.49 ± 0.92 in three C9orf72 patient-derived (ncells = 600) fibroblasts cell lines in 3 independent experiments (unpaired Student’s t-test, p-value (two-sided) = 0.006) (b), 4.85 ± 0.77 in three control (ncells = 1010) versus 44.98 ± 3.95 in three C9orf72 patient-derived (ncells = 986) lymphoblastoid cell lines in 3 independent experiments (unpaired Student’s t-test, p-value (two-sided) = 0.0000006) (c), and 0.31 ± 0.08 in one control (ncells = 3818) versus 6.00 ± 1.12 in one C9orf72 patient-derived (ncells = 2863) induced pluripotent stem cells (iPSCs) in 3 independent experiments (unpaired Student’s t-test, p-value (two-sided) = 0.004) (d). For all three cell types, C9orf72 patient-derived and control cells are displayed above and below, respectively. e In vitro aminoacylation assays performed with recombinant FARS protein (43.75 ng/µL) showed decreased activity of tRNAPhe charging with Phe in the presence of 32×C4G2 RNA repeats (blue squares) as compared to control RFP RNA (green circles) at three different concentrations of RNA: 0.04 ng/µL, 0.4 ng/µL and 4 ng/µL (shades of blue and green). Positive control reaction containing both FARSA and FARSB subunits but without any RNA constructs is presented with black lines and triangles. Negative control with only FARSB is presented with gray lines and triangles. The experiment was repeated 3 times. f Discriminating between aminoacylated and free tRNA 3’ ends revealed a significant decrease in tRNAPhe aminoacylation in C9orf72 patient-derived versus control lymphoblastoid cell lines, relative to total aminoacids content: 0.77 ± 0.03 (Phe-tRNAPhe) (p-value (two-sided) = 0.026), 0.93 ± 0.17 (Asn-tRNAAsn) (p-value (two-sided) = 0.782), 0.78 ± 0.11 (Leu-tRNALeu) (p-value (two-sided) = 0.429), and 0.84 ± 0.32 (Pro-tRNAPro) (p-value (two-sided) = 0.761). Statistics was done using unpaired Student’s t-test. The concentration of respective amino acid in C9orf72 patient-derived and control lymphoblastoid cell lines was used for normalization. Experiment was performed on four C9orf72 patient-derived and four control biologically independent cell lines. g The concentration of free Phe did not significantly differ between C9orf72 patient-derived and control lymphoblastoid cells. Concentration of free aminoacids relative to total aminoacid levels: Phe (1.00 ± 0.04; p-value (two-sided) = 0.957), Asn (0.92 ± 0.02; p-value (two-sided) = 0.046), Leu (1.00 ± 0.04; p-value (two-sided) = 0.99), Pro (0.90 ± 0,06; p-value (two-sided) = 0.352). Experiment was performed on six C9orf72 patient-derived and six control cell lines. Scale bars: 10 µm. Graphs present mean values ± s.e.m. with statistical significance labeled as: *p < 0.05, **p < 0.01, ***p < 0.001. Source data are provided as a Source data file.
Fig. 3
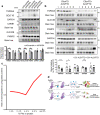
Fig. 3. Expression of Phe-containing proteins is decreased in HEK293T cells, FARSA knockdown HEK293 cells and C9orf72 patient-derived lymphoblastoid cell lines.
a Click chemistry experiment in HEK293T cell line stably expressing mutated FARSA protein showed reduced global expression levels of Phe-containing proteins in the presence of 32×C4G2 RNA. Phe-content normalized to whole protein expression and relative to S1m transfected cells was for RFP 105.1 ± 6.83 and for 32×C4G2 81.4 ± 5.64 (p-value (two-sided) = 0.037). Statistics was done using unpaired Student’s t-test on four independent experiments. The Western blot analysis of Phe-rich protein expression levels in (b) FARSA knockdown HEK293 cells and (c) C9orf72 patient-derived lymphoblastoid cells showed decreased expression of Phe-rich proteins TSPAN5, PXMP2, GOLT1B, and ALG10B whereas there was no decrease in expression of Phe-low proteins LAMINB1 and GAPDH. Expression levels in FARSA knockdown HEK293 cells relative to shScramble average (100%) are as follows: TSPAN5 (76.2 ± 10.6%; p-value = 0.023), PXMP2 (81.1 ± 10.9%; p-value = 0.026), GOLT1B (87.5 ± 3.1%; p-value = 0.048), ALG10B (77.9 ± 9.4%; p-value = 0.049), GAPDH (101.6 ± 6.5%; p-value = 0.897) and LAMINB1 (106.1 ± 7.1%; p-value = 0.249). Statistics was done using nested t-test on 4 independent experiments. Expression levels in lymphoblastoid cell lines are as follows: 14.41 ± 4.46 in control and 8.63 ± 3.55 in C9orf72 patient-derived cells for TSPAN5 (p-value (two-sided) = 0.033); 10.1 ± 2.15 in control and 3.88 ± 1.68 in C9orf72 patient-derived cells for PXMP2 (p-value (two-sided) = 0.00028); 15.75 ± 3.6 in control and 11.22 ± 1.88 in C9orf72 patient-derived cells for GOLT1B (p-value (two-sided) = 0.0027); 9.39 ± 0.27 in control and 8.44 ± 0.24 in C9orf72 patient-derived cells for ALG10B (p-value (two-sided) = 0.038); 9.350 ± 0.508 in control and 10.036 ± 0.507 in C9orf72 patient-derived cells for LAMINB1 (p-value (two-sided) = 0.362); 15.167 ± 0.586 in control and 14.430 ± 0.714 in C9orf72 patient-derived cells for GAPDH (p-value (two-sided) = 0.444). Statistics were done using unpaired Student’s t-test on six C9orf72 patient-derived and six control biologically independent samples. Stain free images represent loading comparison for all proteins above the stain free image and are vertically compressed for design reasons. Molecular weight is marked on western blot pictures in kDa. Graphs present mean values relative to shScramble in HEK293 or control lymphoblastoid cell lines ± s.e.m. with statistical significance labeled as *p < 0.05, **p < 0.01, ***p < 0.001. Source data are provided as a Source data file.
Fig. 4
Fig. 4. Decreased expression of Phe-rich proteins in differentiated FARSA knockdown motor neuron-like NSC-34 cells and post-mortem cerebellum tissue of C9orf72 patients.
Western blot analysis revealed decreased expression of GOLT1B, PXMP2 and ALG10B Phe-rich proteins but not Phe-low proteins GAPDH and LAMB1 in (a) differentiated motor neuron-like NSC-34 cells. Expression levels relative to shScramble average (100%) are as follows: TSPAN5 (84.2 ± 9.8%, p-value = 0.198), PXMP2 (83.5 ± 5.0%, p-value = 0.044), GOLT1B (70.0 ± 8.5%, p-value = 0.017), ALG10B (74.4 ± 1.3%, p-value = 0.0023), GAPDH (109.6 ± 11.3%, p-value = 0.923) and LAMINB1 (125.3 ± 21.2%, p-value = 0.596). Statistics was done using nested t-test on 3 independent experiments. Expression levels of TSPAN5 and ALG10B were significantly reduced in (b) RIPA lysates extracted from frozen cerebellar gray matter of ALS/FTD cases with a C9orf72 mutation (C9 + ALS/FTD). Expression levels relative to controls (ALS/FTD cases without C9orf72 mutation (C9- ALS/FTD)) average (100%) were as follows: ALG10B (53.8 ± 10.8%, p-value (two-sided) = 0.048), TSPAN5 (60.3 ± 5.1%, p-value (two-sided) = 0.0009), GAPDH (76.7 ± 4.0%, p-value (two-sided) = 0.0004), LAMINB1 (94.1 ± 9.6%, p-value (two-sided) = 0.773). Statistics was done using unpaired Student’s t-test on twelve C9 + ALS/FTD and 12 C9- ALS/FTD biologically independent samples Stain free images represent loading comparison for all proteins above the stain free image and are vertically compressed for design reasons. Molecular weight is marked on western blot pictures in kDa. Graphs present mean values ± s.e.m. with statistical significance labeled as *p < 0.05, **p < 0.01, ***p < 0.001. c Proteomic analysis indicates that the ratio of downregulated to upregulated genes, presented with the red line, increases with the increasing % of Phe in the proteins in C9orf72-patient derived lymphoblastoid cell lines. Mass spectrometry analysis was performed on six C9orf72 patient-derived and six control biologically independent samples for each sample once. d Schematic representation (created with Biorender.com) of results. Source data are provided as a Source data file.

References

    1. Schwartz JL, Jones KL, Yeo GW. Repeat RNA expansion disorders of the nervous system: post-transcriptional mechanisms and therapeutic strategies. Crit. Rev. Biochem. Mol. Biol. 2021;56:31. - PMC - PubMed
    1. Swinnen B, Robberecht W, Van Den Bosch L. RNA toxicity in non-coding repeat expansion disorders. EMBO J. 2020;39:e101112. - PMC - PubMed
    1. DeJesus-Hernandez M, et al. Expanded GGGGCC hexanucleotide repeat in noncoding region of C9ORF72 causes chromosome 9p-linked FTD and ALS. Neuron. 2011;72:245–256. - PMC - PubMed
    1. Renton AE, et al. A hexanucleotide repeat expansion in C9ORF72 is the cause of chromosome 9p21-linked ALS-FTD. Neuron. 2011;72:257–268. - PMC - PubMed
    1. Smith BN, et al. The C9ORF72 expansion mutation is a common cause of ALS+/−FTD in Europe and has a single founder. Eur. J. Hum. Genet. 2012;21:102–108. - PMC - PubMed

Publication types