

Genome-wide promoter responses to CRISPR perturbations of regulators reveal regulatory networks in Escherichia coli
- PMID: 37717013
- PMCID: PMC10505187
- DOI: 10.1038/s41467-023-41572-4
Genome-wide promoter responses to CRISPR perturbations of regulators reveal regulatory networks in Escherichia coli
Abstract
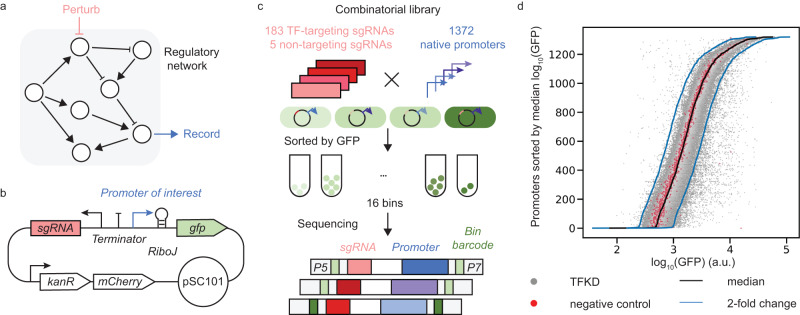
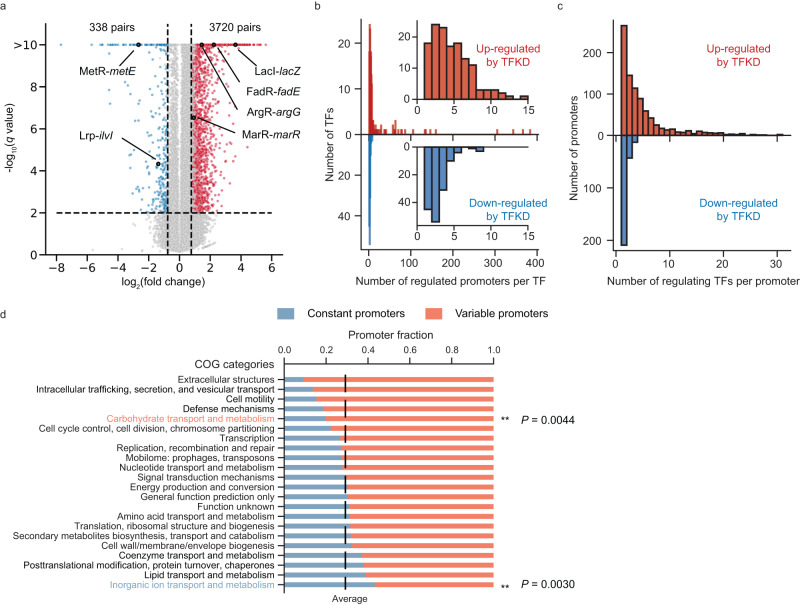
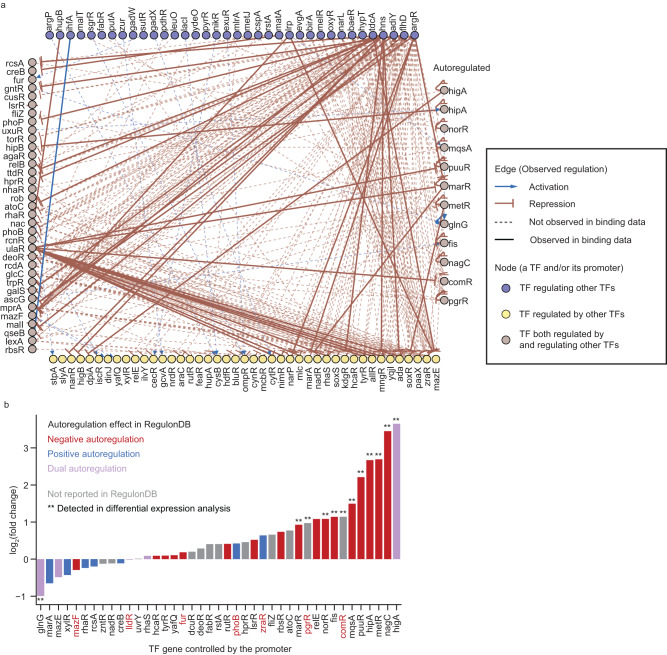
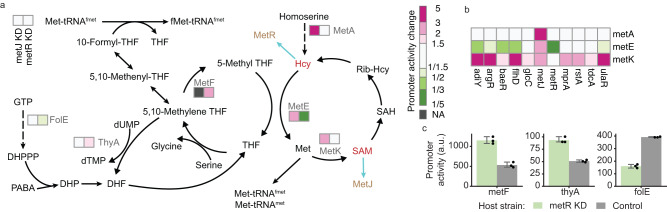
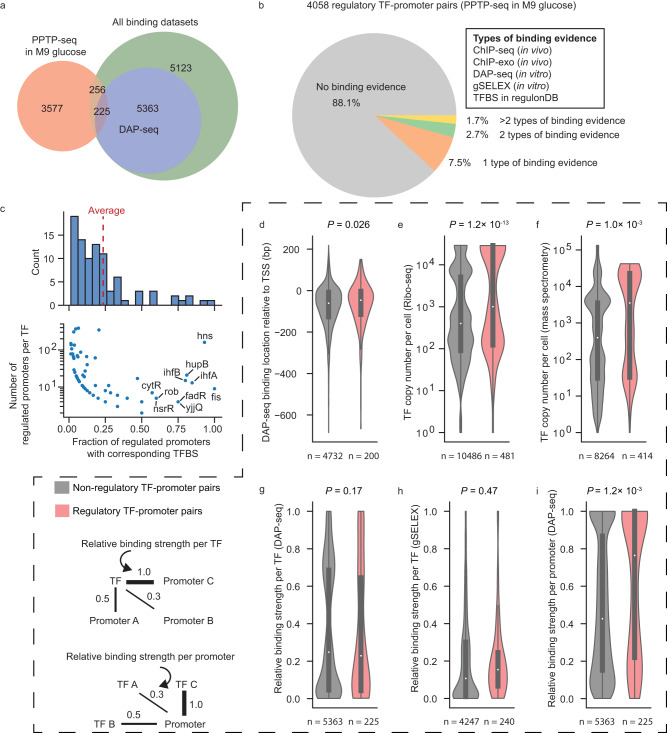
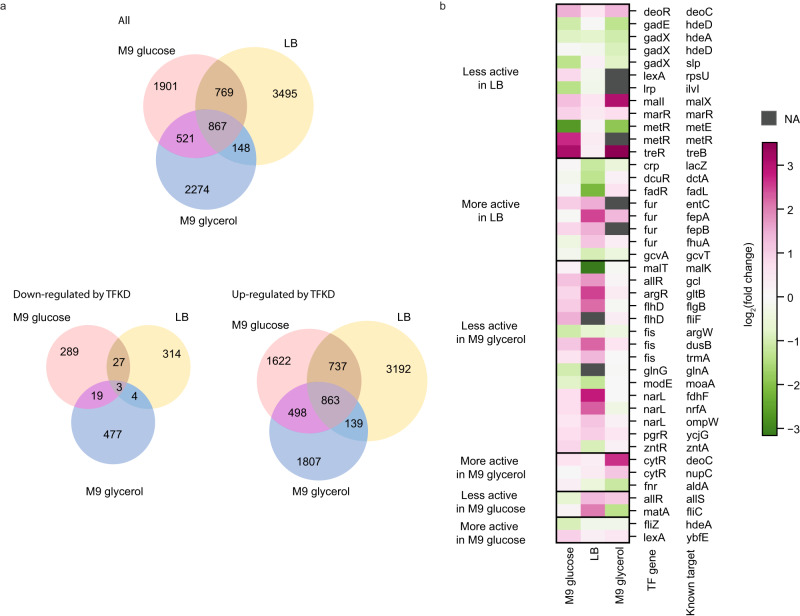
Elucidating genome-scale regulatory networks requires a comprehensive collection of gene expression profiles, yet measuring gene expression responses for every transcription factor (TF)-gene pair in living prokaryotic cells remains challenging. Here, we develop pooled promoter responses to TF perturbation sequencing (PPTP-seq) via CRISPR interference to address this challenge. Using PPTP-seq, we systematically measure the activity of 1372 Escherichia coli promoters under single knockdown of 183 TF genes, illustrating more than 200,000 possible TF-gene responses in one experiment. We perform PPTP-seq for E. coli growing in three different media. The PPTP-seq data reveal robust steady-state promoter activities under most single TF knockdown conditions. PPTP-seq also enables identifications of, to the best of our knowledge, previously unknown TF autoregulatory responses and complex transcriptional control on one-carbon metabolism. We further find context-dependent promoter regulation by multiple TFs whose relative binding strengths determined promoter activities. Additionally, PPTP-seq reveals different promoter responses in different growth media, suggesting condition-specific gene regulation. Overall, PPTP-seq provides a powerful method to examine genome-wide transcriptional regulatory networks and can be potentially expanded to reveal gene expression responses to other genetic elements.
© 2023. Springer Nature Limited.
Conflict of interest statement
The authors declare no competing interests.
Figures
Similar articles
-
Expression levels of transcription factors in Escherichia coli: growth phase- and growth condition-dependent variation of 90 regulators from six families.Microbiology (Reading). 2014 Sep;160(Pt 9):1903-1913. doi: 10.1099/mic.0.079889-0. Epub 2014 Jul 18. Microbiology (Reading). 2014. PMID: 25037164
-
Coupled Single-Cell CRISPR Screening and Epigenomic Profiling Reveals Causal Gene Regulatory Networks.Cell. 2019 Jan 10;176(1-2):361-376.e17. doi: 10.1016/j.cell.2018.11.022. Epub 2018 Dec 20. Cell. 2019. PMID: 30580963 Free PMC article.
-
Tunable transcription factor library for robust quantification of regulatory properties in Escherichia coli.Mol Syst Biol. 2022 Jun;18(6):e10843. doi: 10.15252/msb.202110843. Mol Syst Biol. 2022. PMID: 35694815 Free PMC article.
-
Applications of CRISPR in a Microbial Cell Factory: From Genome Reconstruction to Metabolic Network Reprogramming.ACS Synth Biol. 2020 Sep 18;9(9):2228-2238. doi: 10.1021/acssynbio.0c00349. Epub 2020 Aug 31. ACS Synth Biol. 2020. PMID: 32794766 Review.
-
Functional genomic assays to annotate enhancer-promoter interactions genome wide.Hum Mol Genet. 2022 Oct 20;31(R1):R97-R104. doi: 10.1093/hmg/ddac204. Hum Mol Genet. 2022. PMID: 36018818 Free PMC article. Review.
Cited by
-
Guide RNA structure design enables combinatorial CRISPRa programs for biosynthetic profiling.Nat Commun. 2024 Jul 27;15(1):6341. doi: 10.1038/s41467-024-50528-1. Nat Commun. 2024. PMID: 39068154 Free PMC article.
-
Deciphering regulatory architectures of bacterial promoters from synthetic expression patterns.PLoS Comput Biol. 2024 Dec 26;20(12):e1012697. doi: 10.1371/journal.pcbi.1012697. eCollection 2024 Dec. PLoS Comput Biol. 2024. PMID: 39724021 Free PMC article.
-
Deciphering regulatory architectures from synthetic single-cell expression patterns.ArXiv [Preprint]. 2024 Jun 5:arXiv:2401.15880v2. ArXiv. 2024. Update in: PLoS Comput Biol. 2024 Dec 26;20(12):e1012697. doi: 10.1371/journal.pcbi.1012697. PMID: 38351929 Free PMC article. Updated. Preprint.
-
Accelerating Genetic Sensor Development, Scale-up, and Deployment Using Synthetic Biology.Biodes Res. 2024 Jun 25;6:0037. doi: 10.34133/bdr.0037. eCollection 2024. Biodes Res. 2024. PMID: 38919711 Free PMC article.
-
Deciphering regulatory architectures from synthetic single-cell expression patterns.bioRxiv [Preprint]. 2024 Jun 5:2024.01.28.577658. doi: 10.1101/2024.01.28.577658. bioRxiv. 2024. Update in: PLoS Comput Biol. 2024 Dec 26;20(12):e1012697. doi: 10.1371/journal.pcbi.1012697. PMID: 38352569 Free PMC article. Updated. Preprint.
References
Publication types
MeSH terms
Substances
Grants and funding
LinkOut - more resources
Full Text Sources
Molecular Biology Databases
Miscellaneous
