

Using surveillance data for early warning modelling of highly pathogenic avian influenza in Europe reveals a seasonal shift in transmission, 2016-2022
- PMID: 37717056
- PMCID: PMC10505205
- DOI: 10.1038/s41598-023-42660-7
Using surveillance data for early warning modelling of highly pathogenic avian influenza in Europe reveals a seasonal shift in transmission, 2016-2022
Erratum in
-
Author Correction: Using surveillance data for early warning modelling of highly pathogenic avian influenza in Europe reveals a seasonal shift in transmission, 2016-2022.Sci Rep. 2023 Oct 3;13(1):16612. doi: 10.1038/s41598-023-43740-4. Sci Rep. 2023. PMID: 37789088 Free PMC article. No abstract available.
Abstract
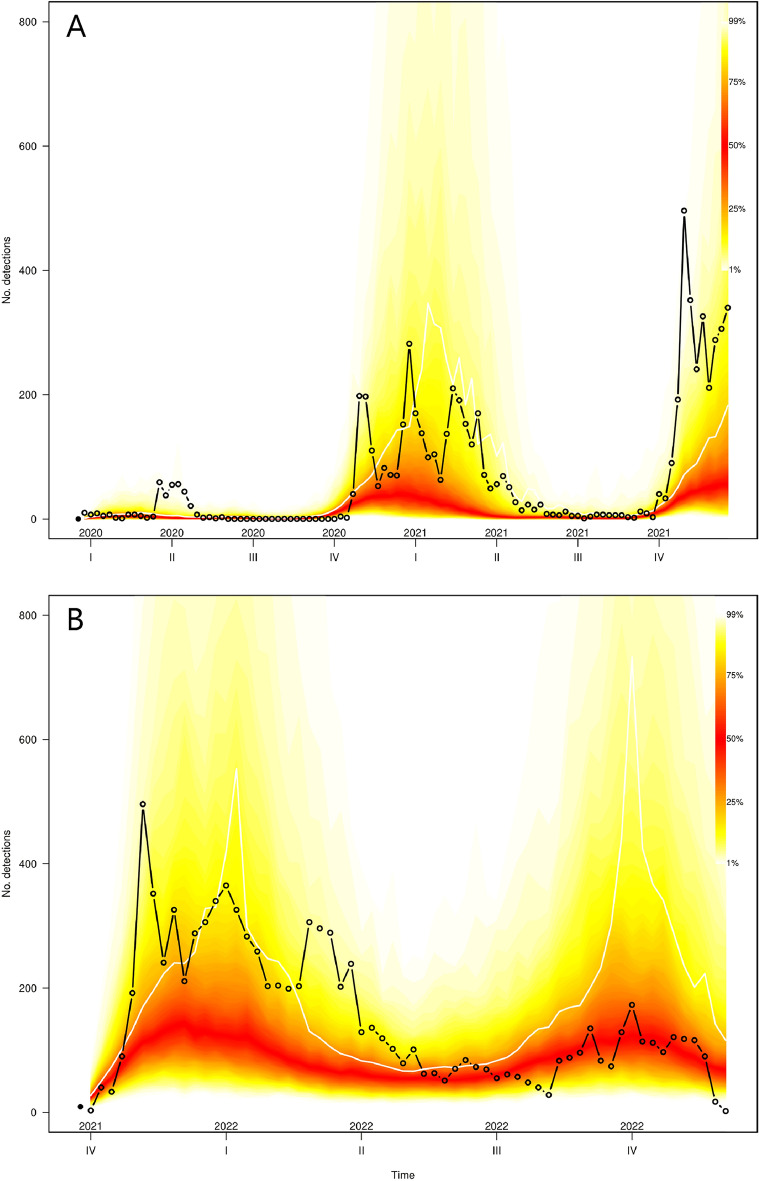
Avian influenza in wild birds and poultry flocks constitutes a problem for animal welfare, food security and public health. In recent years there have been increasing numbers of outbreaks in Europe, with many poultry flocks culled after being infected with highly pathogenic avian influenza (HPAI). Continuous monitoring is crucial to enable timely implementation of control to prevent HPAI spread from wild birds to poultry and between poultry flocks within a country. We here utilize readily available public surveillance data and time-series models to predict HPAI detections within European countries and show a seasonal shift that happened during 2021-2022. The output is models capable of monitoring the weekly risk of HPAI outbreaks, to support decision making.
© 2023. Springer Nature Limited.
Conflict of interest statement
The authors declare no competing interests.
Figures
Similar articles
-
Prediction models show differences in highly pathogenic avian influenza outbreaks in Japan and South Korea compared to Europe.Sci Rep. 2025 Feb 25;15(1):6783. doi: 10.1038/s41598-025-91384-3. Sci Rep. 2025. PMID: 40000899 Free PMC article.
-
Different environmental drivers of highly pathogenic avian influenza H5N1 outbreaks in poultry and wild birds.PLoS One. 2013;8(1):e53362. doi: 10.1371/journal.pone.0053362. Epub 2013 Jan 7. PLoS One. 2013. PMID: 23308201 Free PMC article.
-
Emergence and spread of highly pathogenic avian influenza A(H5N8) in Europe in 2016-2017.Transbound Emerg Dis. 2018 Oct;65(5):1217-1226. doi: 10.1111/tbed.12861. Epub 2018 Mar 14. Transbound Emerg Dis. 2018. PMID: 29536643
-
Rational approach to vaccination against highly pathogenic avian influenza in Nigeria: a scientific perspective and global best practice.Arch Virol. 2023 Sep 29;168(10):263. doi: 10.1007/s00705-023-05888-2. Arch Virol. 2023. PMID: 37775596 Review.
-
Avian influenza: the Canadian experience.Rev Sci Tech. 2009 Apr;28(1):349-58. doi: 10.20506/rst.28.1.1875. Rev Sci Tech. 2009. PMID: 19618638 Review.
Cited by
-
An overview of avian influenza surveillance strategies and modes.Sci One Health. 2023 Oct 19;2:100043. doi: 10.1016/j.soh.2023.100043. eCollection 2023. Sci One Health. 2023. PMID: 39077039 Free PMC article. Review.
-
Environmental Suitability of Kazakhstan to Highly Pathogenic Avian Influenza Using Data on Eurasian Outbreaks, 2020-2024.Viruses. 2025 Apr 16;17(4):574. doi: 10.3390/v17040574. Viruses. 2025. PMID: 40285016 Free PMC article.
-
Predictiveness and drivers of highly pathogenic avian influenza outbreaks in Europe.Sci Rep. 2025 Jul 17;15(1):20286. doi: 10.1038/s41598-025-04624-x. Sci Rep. 2025. PMID: 40675996 Free PMC article.
-
Modern technologies and solutions to enhance surveillance and response systems for emerging zoonotic diseases.Sci One Health. 2023 Dec 12;3:100061. doi: 10.1016/j.soh.2023.100061. eCollection 2024. Sci One Health. 2023. PMID: 39077381 Free PMC article. Review.
-
Evaluation of risk-based antigen and antibody surveillance strategies and their association with HPAI outbreaks in South Korean duck farms.Front Vet Sci. 2025 Jul 3;12:1582269. doi: 10.3389/fvets.2025.1582269. eCollection 2025. Front Vet Sci. 2025. PMID: 40678492 Free PMC article.
References
-
- Mine J, et al. Genetics of Japanese H5N8 high pathogenicity avian influenza viruses isolated in winter 2020–2021 and their genetic relationship with avian influenza viruses in Siberia. Transbound. Emerg. Dis. 2022;69:e2195–e2213. - PubMed
-
- Ramey AM, et al. Highly pathogenic avian influenza is an emerging disease threat to wild birds in North America. J. Wildl. Manage. 2022;86:e22171.
MeSH terms
Associated data
LinkOut - more resources
Full Text Sources
Medical
