. 2023 Sep 16;14(1):5756.
doi: 10.1038/s41467-023-41527-9.

The impact of methane leakage on the role of natural gas in the European energy transition

Affiliations

The impact of methane leakage on the role of natural gas in the European energy transition

Behrang Shirizadeh et al. Nat Commun. .

Abstract

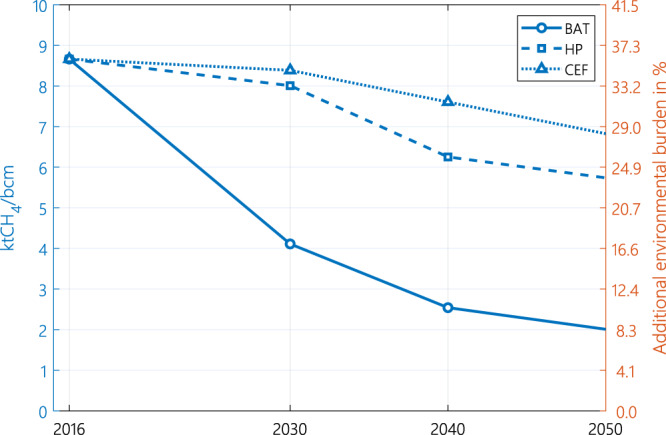
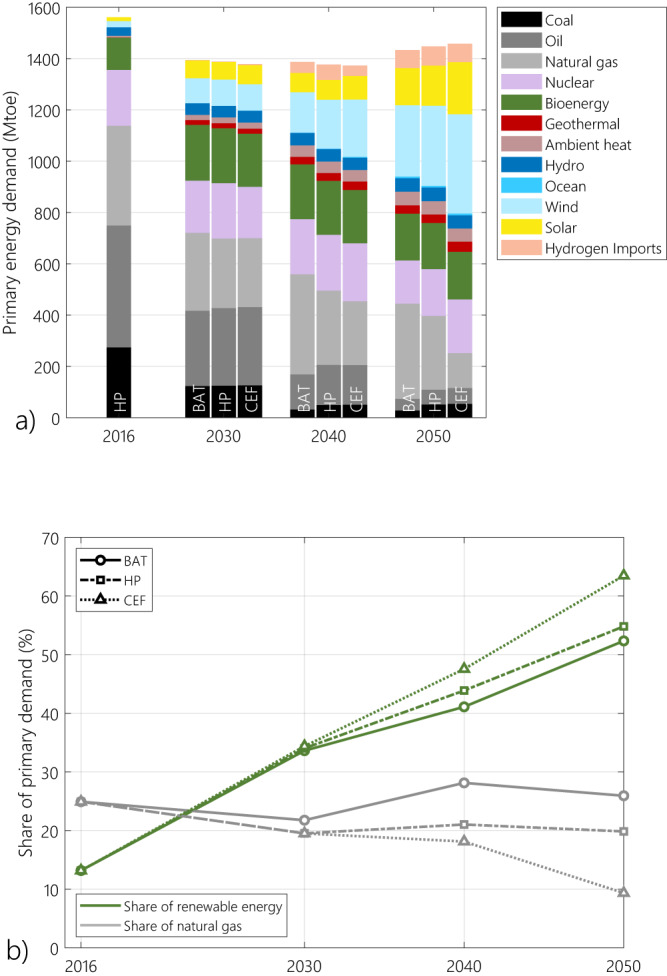
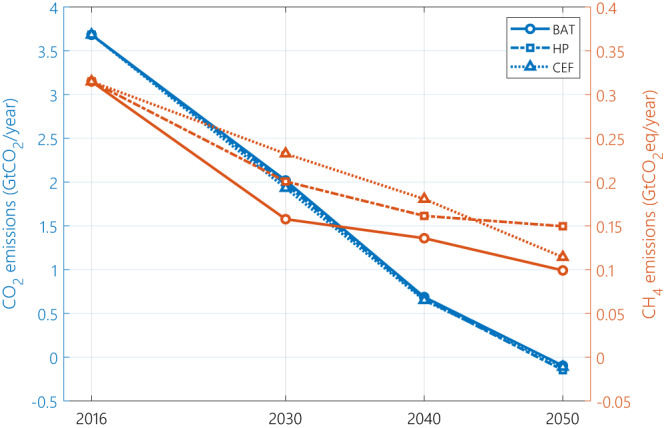
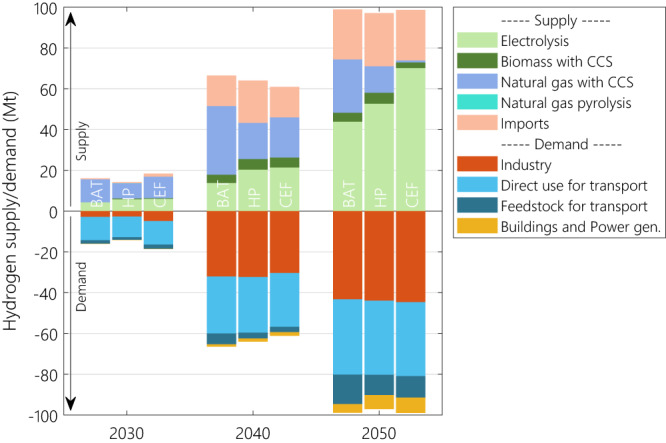
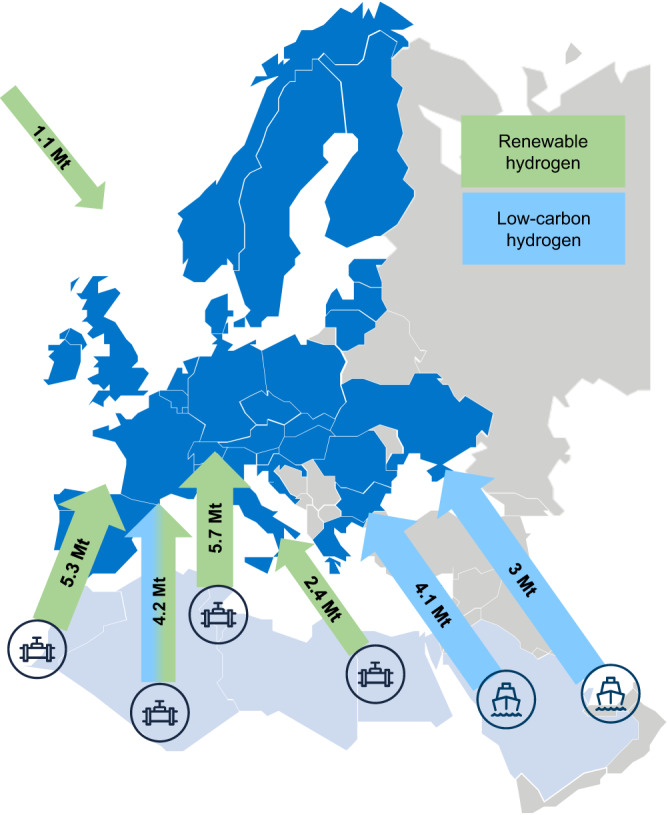
Decarbonising energy systems is a prevalent topic in the current literature on climate change mitigation, but the additional climate burden caused by methane emissions along the natural gas value chain is rarely discussed at the system level. Considering a two-basket greenhouse gas neutrality objective (both CO2 and methane), we model cost-optimal European energy transition pathways towards 2050. Our analysis shows that adoption of best available methane abatement technologies can entail an 80% reduction in methane leakage, limiting the additional environmental burden to 8% of direct CO2 emissions (vs. 35% today). We show that, while renewable energy sources are key drivers of climate neutrality, the role of natural gas strongly depends on actions to abate both associated CO2 and methane emissions. Moreover, clean hydrogen (produced mainly from renewables) can replace natural gas in a substantial proportion of its end-uses, satisfying nearly a quarter of final energy demand in a climate-neutral Europe.


Conflict of interest statement

The authors declare no competing interests.

Figures

Fig. 1
Fig. 1. Methane intensity of natural gas consumed in Europe for each methane emission scenario.
The “Additional environmental burden” represents the additional CO2eq (in GWP20) associated with the methane footprint of a unit of natural gas consumed in Europe, in percentage of the combustion EF of natural gas. BAT stands for the best available technology scenario, HP stands for the harmonised pledges scenario and CEF stands for the current emission factors scenario.
Fig. 2
Fig. 2. Evolution of primary energy demand.
(a) Energy supply mix and (b) the share of renewables and natural has for each of the methane emission cases, compared to the historical levels (2016). BAT, HP and CEF stand for the best available technology, harmonized pledges and current emission factors scenarios respectively. Primary energy decreases by at least 100 Mtoe between 2016 and 2050. This decrease is mainly due to the massive replacement of fossil fuels by renewables, where the energy supply is already mostly in its final consumption form (for instance electricity for wind and solar power and hydroelectricity). In contrast, in a highly fossil-based energy system, the primary energy demand tends to be higher due to conversion losses of fossil energy sources to final end-uses (electricity, transport, low-temperature heating, etc.).
Fig. 3
Fig. 3. Evolution of gross final energy consumption.
(a) Energy consumption mix by energy vector and (b) the share of renewables and natural has for each of the methane emission cases, compared to the historical levels (2016). BAT, HP and CEF stand for the best available technology, harmonized pledges and current emission factors scenarios respectively. Final energy demand experiences an 11% to 13% decrease between 2016 and 2050. In a growing economic environment with positive GDP (gross domestic product) growth, the growth in economic activities is expected to lead to higher final energy demand. In our analysis, while the final energy in the form it is consumed (for instance transport demand in tonne-kilometres and heating demand in the form of thermal energy demand—TWhth) soars, the final energy carrier’s demand quantity shrinks. This decrease is due to efficiency measures taken in the industrial processes by 2030, as well as the shift to more efficient final end-use energy carriers such as electricity and hydrogen. For instance, both electric vehicles and heat pumps for space heating are about two to three times more efficient than their combustion-based counterparts (internal combustion engine vehicles and boilers).
Fig. 4
Fig. 4. The evolution of CO2 emissions (left axis, blue) and methane emissions (right axis, orange) for the three emission scenarios from the historical values (2016) to 2050.
Both CO2 and methane emissions are represented in GtCO2eq/year terms, but the scale of the secondary vertical axis (methane emissions) is an order of magnitude smaller than the primary vertical axis. The best available technology scenario is represented by abbreviation BAT, harmonized pledges by HP and current emission factors by CEF.
Fig. 5
Fig. 5. Evolution of the hydrogen supply and demand for each of the methane emission scenarios between 2030 and 2050.
The positive values indicate hydrogen supply, while the negative values indicate hydrogen demand. BAT, HP and CEF stand for the best available technology, harmonized pledges and current emission factors scenarios respectively.
Fig. 6
Fig. 6. European hydrogen imports from the neighbouring regions for the best available technology scenario.
The green colour represents renewable hydrogen (electrolysis based on wind and solar power) imports and the blue colour represents low-carbon hydrogen (reformation of natural gas with CCS) imports. Maritime hydrogen imports (via ammonia shipping) are shown with a ship logo, while pipeline gaseous hydrogen imports are shown with pipe logos.
Fig. 7
Fig. 7. Fossil fuel prices trajectories implemented in the modelling.
Short term oil and natural gas prices are expected to peak in reaction to the war in Ukraine and of the supply restriction. Long term prices paths follow the IEA STEPS scenario. STEPS is one of three key scenarios of the International Energy Agency, standing for stated policies.

References

    1. Sachs JD, et al. Six transformations to achieve the sustainable development goals. Nat. Sustain. 2019;2:805–814.
    1. IPCC. in Global Warming of 1.5 °C. An IPCC Special Report on the Impacts of Global Warming of 1.5 °C above Pre-industrial Levels and Related Global Greenhouse Gas Emission Pathways, in the Context of Strengthening the Gobal Response to the Threat of Climate Change, Sustainable Development, and Efforts to Eradicate Poverty (eds Masson-Delmotte, V. et al.) 3–24 (Cambridge University Press, Cambridge, UK and New York, NY, 2018).
    1. DeAngelo J, et al. Energy systems in scenarios at net-zero CO2 emissions. Nat. Commun. 2021;12:1–10. - PMC - PubMed
    1. Babacan O, et al. Assessing the feasibility of carbon dioxide mitigation options in terms of energy usage. Nat. Energy. 2020;5:720–728.
    1. Victoria M, Zhu K, Brown T, Andresen GB, Greiner M. Early decarbonisation of the European energy system pays off. Nat. Commun. 2020;11:1–9. - PMC - PubMed