. 2023 Sep 16;14(1):5746.
doi: 10.1038/s41467-023-41393-5.

A cleavage rule for selection of increased-fidelity SpCas9 variants with high efficiency and no detectable off-targets

Affiliations

A cleavage rule for selection of increased-fidelity SpCas9 variants with high efficiency and no detectable off-targets

Péter István Kulcsár et al. Nat Commun. .

Abstract

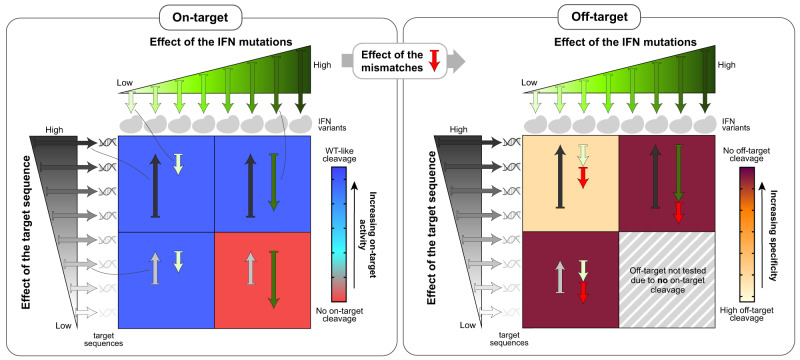
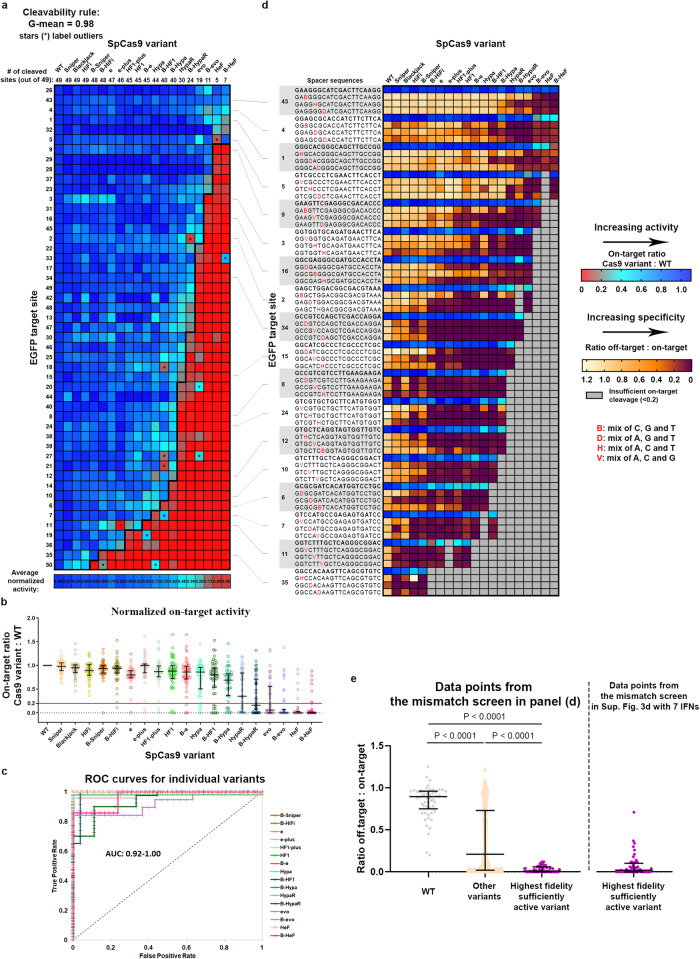
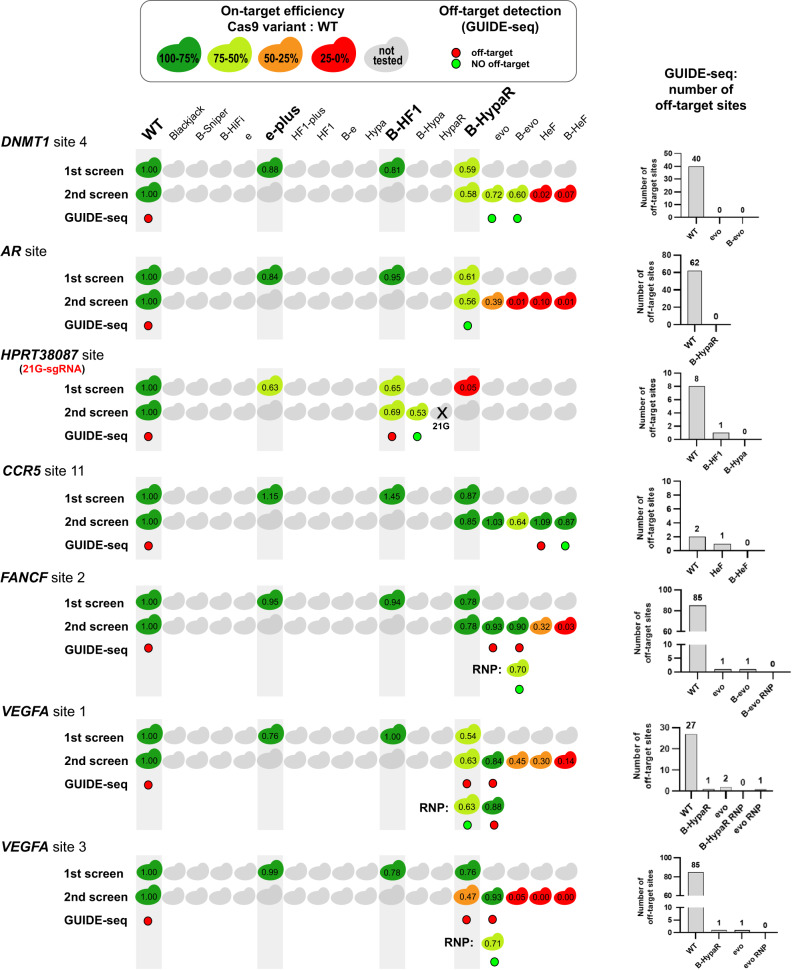
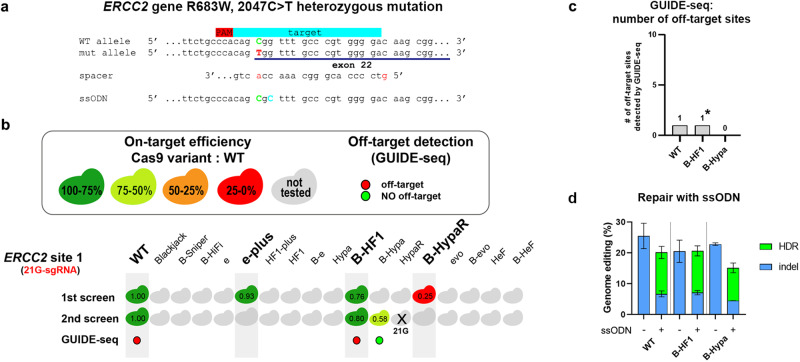
Streptococcus pyogenes Cas9 (SpCas9) has been employed as a genome engineering tool with a promising potential within therapeutics. However, its off-target effects present major safety concerns for applications requiring high specificity. Approaches developed to date to mitigate this effect, including any of the increased-fidelity (i.e., high-fidelity) SpCas9 variants, only provide efficient editing on a relatively small fraction of targets without detectable off-targets. Upon addressing this problem, we reveal a rather unexpected cleavability ranking of target sequences, and a cleavage rule that governs the on-target and off-target cleavage of increased-fidelity SpCas9 variants but not that of SpCas9-NG or xCas9. According to this rule, for each target, an optimal variant with matching fidelity must be identified for efficient cleavage without detectable off-target effects. Based on this insight, we develop here an extended set of variants, the CRISPRecise set, with increased fidelity spanning across a wide range, with differences in fidelity small enough to comprise an optimal variant for each target, regardless of its cleavability ranking. We demonstrate efficient editing with maximum specificity even on those targets that have not been possible in previous studies.


Conflict of interest statement

The authors declare no competing interests.

Figures

Fig. 1
Fig. 1. Simplified explanatory figure of the cleavage rule.
A simplified explanatory figure of the “cleavage rule” is presented to interpret the results shown in Fig. 2 and Supplementary Figs. 2, 3. Three main factors, namely target sequence contribution (effect of the target sequence), mismatches and fidelity-increasing mutations, that collectively determine whether an IFN will cleave a target or its off-targets. The coloring of the heatmap in this figure corresponds to that of the heatmaps in other figures within the manuscript. The left panel shows the on-target activity of two IFNs from different fidelity ranks on two targets from different cleavability ranks. When the activating effect of the target sequence contribution is larger than the inhibitory effect of the fidelity-increasing mutations, the SpCas9 variant cleaves the target (blue background), but when it is smaller, then the variant does not cleave the target (red background). The right panel shows the effect of a mismatch on the activity of the IFNs from the first panel on the same targets. When the activating effect of the target sequence contribution is larger than the combined inhibitory effect of the fidelity-increasing mutations and the mismatches, the SpCas9 variant cleaves the off-target sequence (yellow background), but when it is smaller, the variant does not cleave (burgundy background). In the case of the optimal, target-matched IFN the inhibitory effect of the fidelity-increasing mutations is only slightly smaller than the activating effect of the target sequence, so that it can still effectively cleave the on-target sequence, but when the effect of a mismatch is added, the combined inhibitory effect exceeds the contribution of the target sequence, and therefore it does not cleave any off-target. The effect of the same mismatch can vary in different sequential contexts, but for simplicity, here we apply the same effect in all of the example cases.
Fig. 2
Fig. 2. Extending the set of IFNs enables increased specificity.
Heatmaps show the normalized EGFP disruption activity of SpCas9 nucleases with a perfectly matching and d partially mismatching 20G-sgRNAs in N2a cells. a The bold line indicates the dividing line defined by the cleavage rule between the classes of cleaved and not-cleaved values. The G-mean value indicates how well the data points above and below the bold line correspond to cleaved and not-cleaved (<0.20 activity normalized to WT) experimental values. Targets and IFNs are shown in the same order as in Supplementary Fig. 3. b Normalized on-target disruption activities of various SpCas9 variants presented on a scatter dot plot. The sample points correspond to data presented in (a) n = 49. The median and interquartile range are shown; data points are plotted as open circles representing the mean of biologically independent triplicates. Continuous red line indicates 0.20 normalized disruption activity, under which we consider the IFNs not to be active on a given target. Statistical significance was assessed by using RM one-way ANOVA and is shown in Supplementary Data file 9. c The ROC curves demonstrate that the order of the target sequences, determined by the cleavage rule, competently separates the classes of cleaved and not-cleaved normalized disruption values of each of the 19 variants from (a). d Mismatch screen of the nuclease variants either with perfectly matching 20G-sgRNAs or with mismatched sgRNAs (a mixture of three different sgRNAs used for each examined mismatch position) as indicated in the figure. Gray boxes: not determined because on-target activity was too low. Targets from higher ranks (cleavable by many IFNs) require higher fidelity nucleases, while targets from lower ranks (cleavable by few IFNs) require lower fidelity nucleases for editing with both high efficiency and high specificity. e Matching IFNs to targets further increases the specificity of editing. The highest fidelity still active variants from the 19 IFNs in (d) provide more specific editing then those from the 7 IFNs shown at the right of the panel. The median and interquartile range of data points selected from (d) is presented as indicated; n = 54, 654, 54, respectively. Dots are shown for each variant with each mismatching spacer position, provided that the on-target activity exceeded 70%; data are omitted otherwise. Statistical significance was assessed by RM one-way ANOVA, statistical details and exact p-values are available in Methods and in Supplementary Data file 9. a–e Target sequences, raw and processed disruption data and statistical details are reported in Supplementary Data files 1–4, 9.
Fig. 3
Fig. 3. The cleavage rule still applies in a different cell line (HEK293) and on endogenous target sites examined by NGS.
Heatmaps show the normalized value of the percentage of genome modification induced by SpCas9 variants with a, c perfectly matching and e partially mismatching 20G-sgRNAs. a, c The bold line indicates the dividing line defined by the cleavage rule between the classes of cleaved and not-cleaved values. The G-mean value indicates how well the data points above and below the bold line correspond to the cleaved and not-cleaved (<0.20 activity normalized to WT) experimental values. b, d Normalized on-target genome modification rates of various SpCas9 variants presented on a scatter dot plot. The sample points correspond to data presented in (a) and (c); n = 52, 6481, respectively. Continuous red line indicates 0.20 normalized disruption activity, under which we consider the IFNs not to be active on a given target. The median and interquartile range are shown; data points are plotted as open circles representing the mean of biologically independent triplicates. Statistical significance was assessed by Friedman test and is shown in Supplementary Data file 9. c, d The data are compiled from experiments from Kim et al. and contain only selected sequences to avoid the effect of 5’ extended sgRNAs known to diminish the activity of all IFNs except Sniper and the SpCas9 variants containing the Blackjack mutations, (details can be found in Materials and Methods section and in Supplementary Data file 7). The G-mean score of a 1.00 and c 0.98 (only 171 out of 32,405 data points are outliers) confirms that the cleavage rule is the main factor determining the activity of IFNs on genomic target sequences. e The ROC curves verify that the order of the target sequences, determined by the cleavage rule, competently separates the classes of the cleaved and not-cleaved targets based on the normalized genome modification values of each individual variant from (c). f Mismatch screen of six nuclease variants with 30 sgRNAs on either perfectly matching or one-base mismatching target sequences. Data are compiled from experiments from Kim et al. and contain outcomes on 1,800 off-target sequences (details can be found in Materials and Methods section and in Supplementary Data file 7). g Matching IFNs and targets further increases the specificity of editing. The median and interquartile range of data points that are selected from (f) is presented as indicated; n = 30, 87, 30, respectively. Dots are shown for each variant and target pair, where the on-target activity exceeded 70%. Statistical significance was assessed by RM one-way ANOVA, statistical details and p-values are available in Methods and in Supplementary Data file 9. a–g Target sequences, heatmap, NGS and data selected from Kim et al. and statistical details are reported in Supplementary Data files 1, 5, 7, 9.
Fig. 4
Fig. 4. Sequence contributions are evident in vitro, supporting that it directly affects the enzymatic activity of IFNs.
The effect of increased-fidelity mutations and sequence contributions seen in cellulo also manifests in the rate constants of in vitro cleavage activities of the variants employing 21 targets of Fig. 2. a Representative agarose gel showing the activity of B-evoSpCas9 variant in a plasmid-cleaving in vitro assay at different timepoints in triplicates. b Plot showing values representing the consumption of the intact circular plasmid (not-cleaved) derived from the intensity of bands from the representative agarose gel in (a). Exponential curves were fitted to the timepoints of each replicate separately. c The average k values of three individual fits are shown for 21 EGFP target sites, separated into categories based on the in cellulo cleavage results. The median and interquartile range are shown; data points represent the mean of the fitted k value triplicates; n = 21, 16, 5, 9, 12, respectively. Differences between groups were tested by using either two-tailed unpaired Student’s t-test with Welch’s correction (B-SpCas9-HF1) or by using two-tailed Mann–Whitney test (B-evoSpCas9) in the cases where differences did not meet the assumptions of unpaired t-test. Statistical details and exact p-values are available in Materials and Methods section and in Supplementary Data file 9. a–c Data related to Supplementary Fig. 6. Target and primer sequences, in vitro data and statistical details are reported in Supplementary Data files 1, 8, 9.
Fig. 5
Fig. 5. Increased-fidelity SpCas9 variants in the higher fidelity ranks with in-between activity/fidelity.
a, c The results of an on-target EGFP disruption assay for WT and different SpCas9 variants on various target sites shown on a column graph. Means and SD are shown; n = 3 biologically independent samples (overlaid as white circles). a, Reverting three mutations of xCas9 back to the WT residues, suggested by Guo et al. as being responsible for its increased fidelity and target-selectivity, did not increase its activity the way we expected. Statistical significance was assessed by RM one-way ANOVA and shown in Supplementary Data file 9. b Normalized on-target activities of various SpCas9 variants presented on a scatter dot plot. The sample points correspond to data presented in (c); n = 14. Continuous red line indicates 0.20 normalized disruption activity, under which we consider the IFNs not to be active on a given target. The median and interquartile range are shown; data points are plotted as open circles representing the mean of biologically independent triplicates. Differences between SpCas9 variants were tested by using either two-tailed paired-samples Student’s t-test or by using two-tailed Wilcoxon Signed Ranks test in the cases where differences did not meet the assumptions of Paired t-test. Statistical details and p-values are available in Methods and in Supplementary Data file 9. d, f Heatmaps show the normalized EGFP disruption activities of SpCas9 nucleases with perfectly matching 20G-sgRNAs. The bold line indicates the dividing line defined by the cleavage rule between the classes of cleaved and not-cleaved values. d SpCas9-NG and xCas9 do not strictly obey the cleavage rule when fitted on the heatmap of Fig. 2a (only 42 EGFP target sites were tested here), even though some of the targets for which the order were not determined by the 19 IFNs were reordered (compared to Fig. 2a heatmap) to favor the accommodation of SpCas9-NG and xCas9 into the cleavage map. These results explain the failure to develop an IFN series with a looser PAM requirement and emphasize that the cleavage rule identified here is non-trivial and does not apply to all other SpCas9 variants with reduced activity or increased fidelity. e The ROC curves demonstrate that the order of the target sequences, determined by the cleavage rule, competently separates the classes of the cleaved and not-cleaved targets in case of the IFN variants, but xCas9 (AUC: 0.68) and SpCas9-NG (AUC:0.70) do not appear to strictly follow the cleavage rule, emphasizing that the rule is not self-evident. f Additional IFNs provide a finer resolution within the higher fidelity region of the IFN ranking between evo- and HeFSpCas9, and their activities on these targets also strictly follow the cleavage rule. For these experiments, we selected targets from the higher cleavability region of the target ranking in Fig. 2, as these were expected to be the point of distinction between the additional variants, and therefore facilitate the ordering of these IFNs and their fitting into the already existing ranking. This is the reason for these high fidelity IFNs showing much higher normalized disruption activities, than they would on randomly selected targets. a–f Target sequences, raw, processed, heatmap disruption data and statistical details are reported in Supplementary Data files 1–4, 9.
Fig. 6
Fig. 6. The optimal, target-matched SpCas9 nuclease, which shows efficient on-target editing and no off-target effects, is identified for each target using a two-step approach.
a Schematic representation of the two-step screening method used on a hypothetical target example. The first panel shows the on- and off-target activity of a set of IFNs with increasing fidelity on a hypothetical target example. The second panel shows the screening method, which identifies the optimal variant for the target without having to test all of the variants. In the first step, a rough on-target screen is performed, where the WT and three selected IFNs, that divide the target ranking range into four approximately proportional sections, are tested. The second step is a fine-tuning on-target screen, that involves the not yet used variants with higher fidelity than the highest ranking active (green) variant from the first screen, and it identifies the target-matched variants (active variants with the highest fidelity). If necessary, two sufficiently active (here their normalized activity is above 50%, but this may depend on the application under consideration) target-matched variants can be screened for the absence of genome-wide off-targets. b The identification of the target-matched variants that provide appropriate editing without any genome-wide off-target is demonstrated on three targets that had been tested in Tsai et al.. The numbers in the colored Cas protein illustrations indicate the percentage value of the on-target genome modifications normalized to WT (measured by NGS). Colored circles indicate whether a target was edited with (red) or without (green) off-targets in the GUIDE-seq experiment. The total number of off-target sites detected by GUIDE-seq are shown for each target in bar charts on the right side of the panel. Data related to Fig. 8, Supplementary Figs. 10, 11. Target sequences, NGS and GUIDE-seq data are reported in Supplementary Data files 1, 5, 6.
Fig. 7
Fig. 7. Even repetitive, non-typical sequences can be edited without off-targets by employing optimal target-matched IFNs.
Targets shown here are a collection of targets that had previously only been edited by IFNs with off-targets detected by GUIDE-seq,,,,,. Here, they were all successfully edited without any genome-wide off-targets when assessed by GUIDE-seq using target-matched IFNs. The numbers in the colored Cas protein illustrations indicate the percentage value of the on-target genome modifications normalized to WT (measured by NGS). GUIDE-seq was performed with one or two target-matched IFNs that reached at least 50% normalized on-target editing. Colored circles indicate whether a target was edited with (red) or without (green) off-targets in the GUIDE-seq experiment. Some targets can be edited with no detectable genome-wide off-targets by more than one target-matched IFN, or in other cases by an IFN in RNP form that can further increase specificity. Bar charts of the total number of off-target sites detected by GUIDE-seq are shown on the right side of the panel. Data related to Fig. 8, Supplementary Figs. 10, 11. Target sequences, NGS and GUIDE-seq data are reported in Supplementary Data files 1, 5, 6.
Fig. 8
Fig. 8. Target-matched nucleases show high efficiency without any genome-wide off-target for targets tested in this study regardless their ranking.
a Summary of targets edited by IFNs, examined in this study with GUIDE-seq and NGS. For 10 target sites, including those challenging targets where previous attempts with IFNs had failed, we were able to perform editing without any off-target detected by GUIDE-seq and further confirmed by NGS on the top three site. For the highest ranked target, CCR5 site 11, NGS still identified residual off-target activity even with the highest ranked B-HeF, indicating that development of an even higher fidelity IFN would be beneficial for accessing the highest cleavability rank. The colors of the squares indicate the percentage value of the on-target genome modification normalized to WT (measured by NGS). Colored circles indicate the summarized GUIDE-seq and NGS results; green circle indicates when both NGS and GUIDE-seq showed no off-targets, red circle indicates off-target editing detected either by GUIDE-seq or NGS, light green circle indicates when no off-target was found but it was only tested by NGS and gray circle indicate no data. Off-target editing data of these targets (GUIDE-seq experiments) from the literature are summarized in Supplementary Data file 6: Data from other studies. The ranking of the targets is weakly related to either b, the number of their predicted off-target sites, or c, the detected off-target sites using WT SpCas9 (for details see Supplementary Table 2). a-c Data are related to Figs. 6, 7, 9, Supplementary Figs. 9–11.
Fig. 9
Fig. 9. Correcting a clinically relevant mutation without off-target cleavage using the two-step screening method.
a The strategy to correct the mutation causing Xeroderma pigmentosum in patient-derived fibroblast cells is shown, including the sequence environment of the mutation (disease-causing mutation – red letter, WT nucleotide– green letter, silent mutation – blue letter). b By using the two-step screening method we identified B-HypaSpCas9 to be used for editing without any detectable genome-wide off-target. Values in the colored Cas protein illustrations indicate the percentage value of the on-target genome modifications normalized to WT (measured by NGS). Hypa-R being a non-Blackjack-IFN exhibited diminished (<0.2) activity with the 21G-sgRNA (data not shown here, data available in Supplementary Data file 5). Colored circles indicate whether a target was edited with (red) or without (green) off-targets in the GUIDE-seq experiment. c Bar chart showing the total number of off-target sites detected by GUIDE-seq. ‘*’ indicates that no off-target was detected in a repeated GUIDE-seq experiment, even though the read numbers were higher in the repeated experiment (see Supplementary Fig. 11). d B-HypaSpCas9 with single strand oligo nucleotide repair using HDR enhancer M3814 provides WT-like level of correction of the R683W (2047C>T) mutation. Means and SD are shown; n = 3. a–d Data related to Fig. 8, Supplementary Figs. 10, 11. Target sequences, NGS and GUIDE-seq data are reported in Supplementary Data files 1, 5, 6.

Similar articles

Cited by

  • Recent Advances in Tomato Gene Editing.
    Larriba E, Yaroshko O, Pérez-Pérez JM. Larriba E, et al. Int J Mol Sci. 2024 Feb 23;25(5):2606. doi: 10.3390/ijms25052606. Int J Mol Sci. 2024. PMID: 38473859 Free PMC article. Review.

References

    1. Porteus MH. A new class of medicines through DNA editing. N. Engl. J. Med. 2019;380:947–959. doi: 10.1056/NEJMra1800729. - DOI - PubMed
    1. Frangoul H, et al. CRISPR-Cas9 gene editing for sickle cell disease and beta-thalassemia. N. Engl. J. Med. 2021;384:252–260. doi: 10.1056/NEJMoa2031054. - DOI - PubMed
    1. Gillmore JD, et al. CRISPR-Cas9 in vivo gene editing for transthyretin amyloidosis. N. Engl. J. Med. 2021;385:493–502. doi: 10.1056/NEJMoa2107454. - DOI - PubMed
    1. Anzalone AV, Koblan LW, Liu DR. Genome editing with CRISPR-Cas nucleases, base editors, transposases and prime editors. Nat. Biotechnol. 2020;38:824–844. doi: 10.1038/s41587-020-0561-9. - DOI - PubMed
    1. Mali P, et al. RNA-guided human genome engineering via Cas9. Science. 2013;339:823–826. doi: 10.1126/science.1232033. - DOI - PMC - PubMed

Publication types

MeSH terms