Laser Capture Microdissection Transcriptome Reveals Spatiotemporal Tissue Gene Expression Patterns of Medicago truncatula Roots Responding to Rhizobia
- PMID: 37717250
- PMCID: PMC12021447
- DOI: 10.1094/MPMI-03-23-0029-R
Laser Capture Microdissection Transcriptome Reveals Spatiotemporal Tissue Gene Expression Patterns of Medicago truncatula Roots Responding to Rhizobia
Abstract
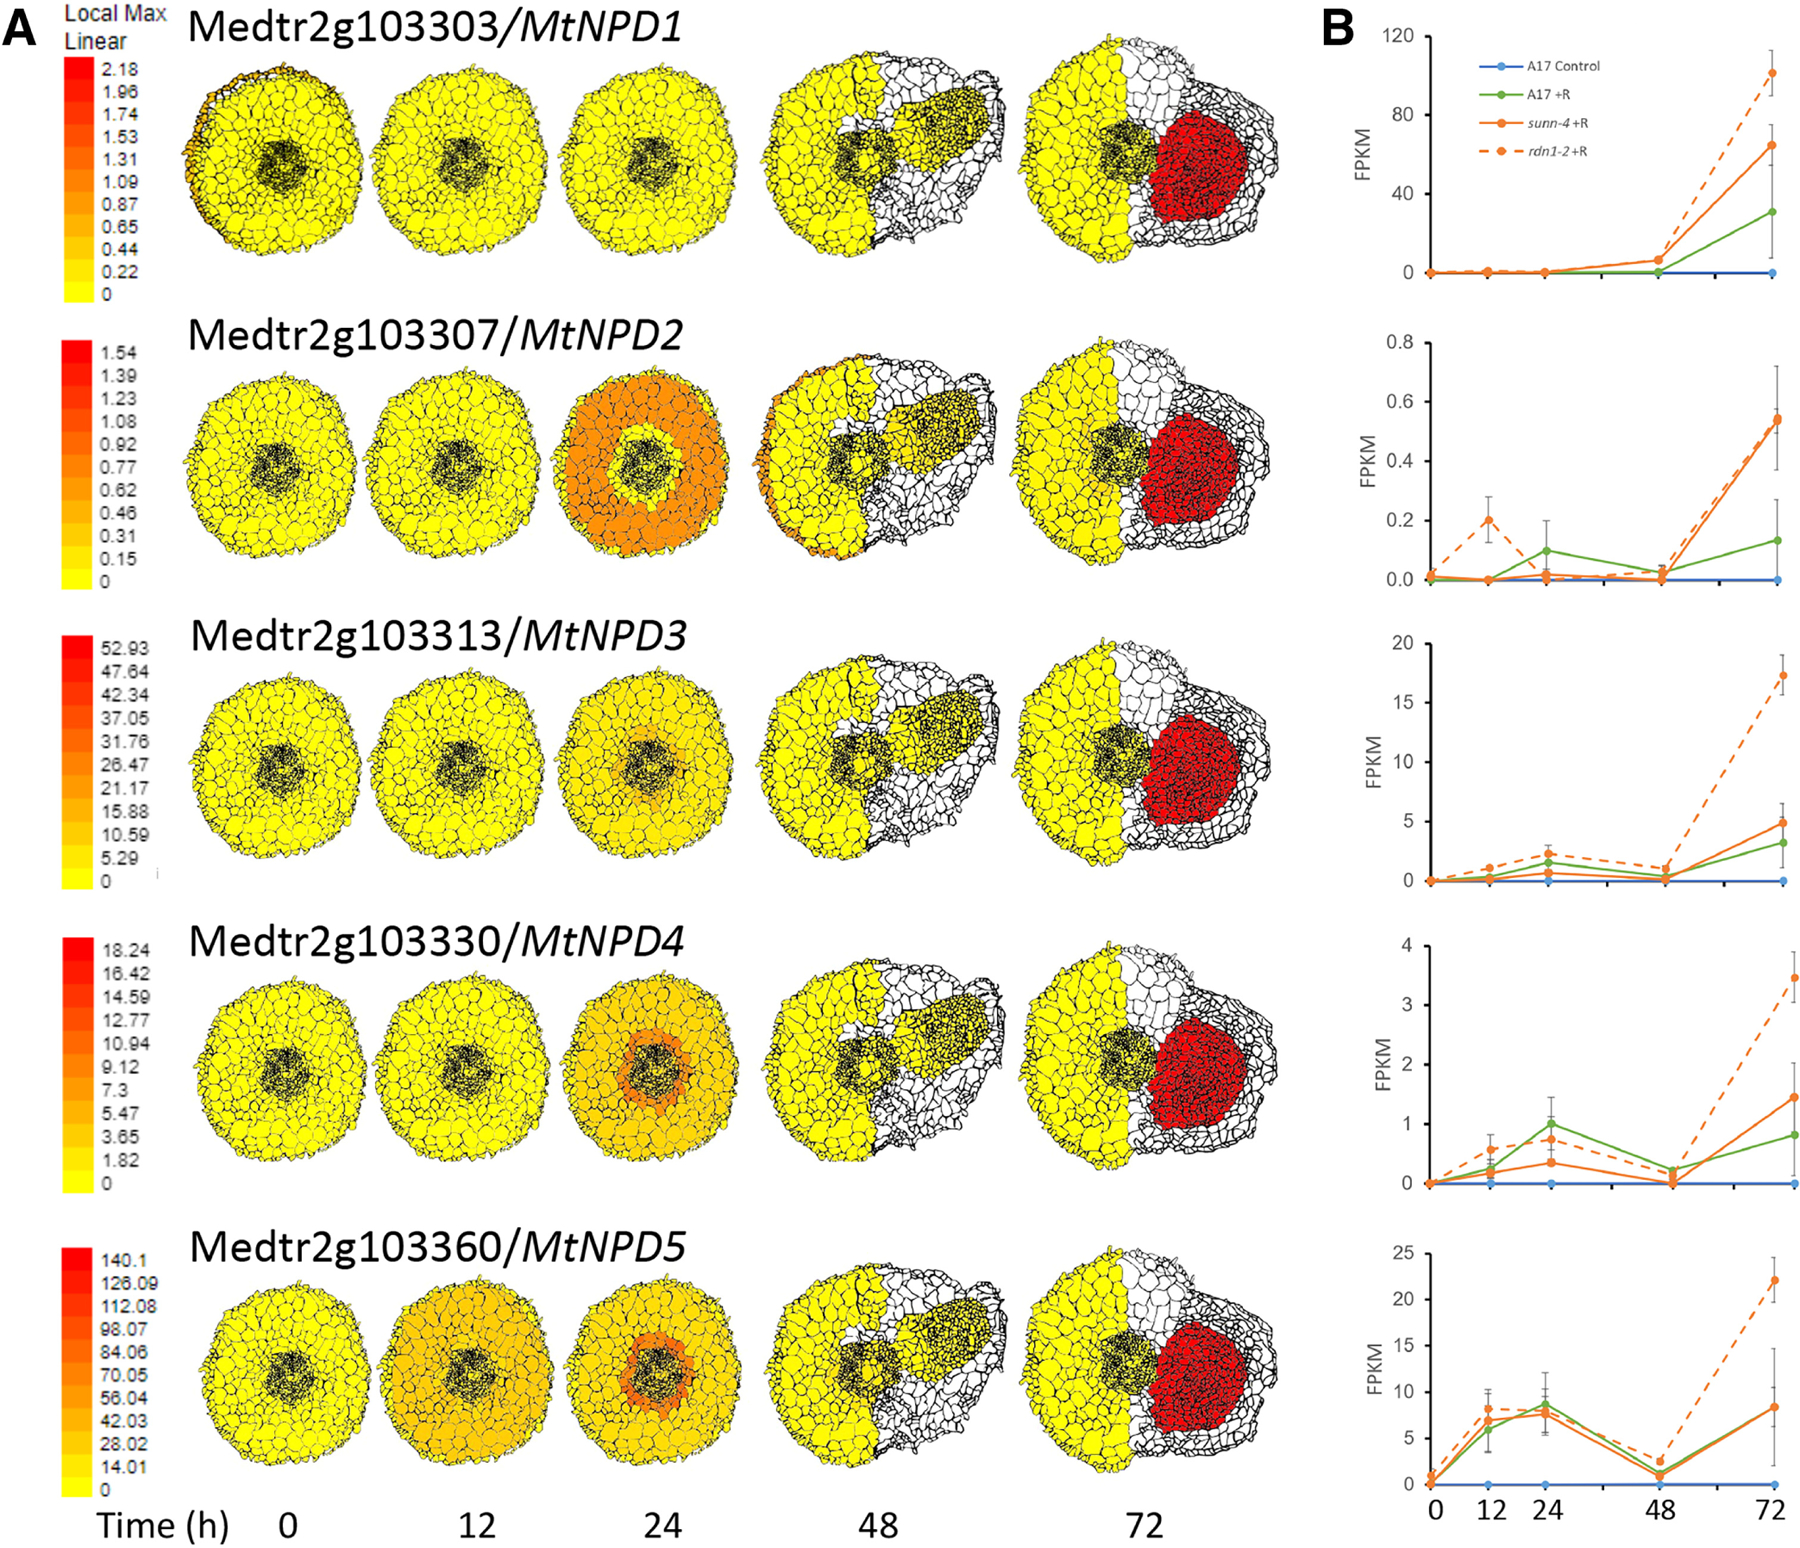
We report a public resource for examining the spatiotemporal RNA expression of 54,893 Medicago truncatula genes during the first 72 h of response to rhizobial inoculation. Using a methodology that allows synchronous inoculation and growth of more than 100 plants in a single media container, we harvested the same segment of each root responding to rhizobia in the initial inoculation over a time course, collected individual tissues from these segments with laser capture microdissection, and created and sequenced RNA libraries generated from these tissues. We demonstrate the utility of the resource by examining the expression patterns of a set of genes induced very early in nodule signaling, as well as two gene families (CLE peptides and nodule specific PLAT-domain proteins) and show that despite similar whole-root expression patterns, there are tissue differences in expression between the genes. Using a rhizobial response dataset generated from transcriptomics on intact root segments, we also examined differential temporal expression patterns and determined that, after nodule tissue, the epidermis and cortical cells contained the most temporally patterned genes. We circumscribed gene lists for each time and tissue examined and developed an expression pattern visualization tool. Finally, we explored transcriptomic differences between the inner cortical cells that become nodules and those that do not, confirming that the expression of 1-aminocyclopropane-1-carboxylate synthases distinguishes inner cortical cells that become nodules and provide and describe potential downstream genes involved in early nodule cell division. [Formula: see text] Copyright © 2023 The Author(s). This is an open access article distributed under the CC BY-NC-ND 4.0 International license.
Keywords: M. truncatula; RNA-Seq; laser capture microdissection; nodulation.
Conflict of interest statement
The author(s) declare no conflict of interest.
Figures


Similar articles
-
The Medicago truncatula IEF Gene Is Crucial for the Progression of Bacterial Infection During Symbiosis.Mol Plant Microbe Interact. 2022 May;35(5):401-415. doi: 10.1094/MPMI-11-21-0279-R. Epub 2022 Apr 21. Mol Plant Microbe Interact. 2022. PMID: 35171648
-
CRISPR/Cas9-Mediated Knock-Out of the MtCLE35 Gene Highlights Its Key Role in the Control of Symbiotic Nodule Numbers under High-Nitrate Conditions.Int J Mol Sci. 2023 Nov 27;24(23):16816. doi: 10.3390/ijms242316816. Int J Mol Sci. 2023. PMID: 38069142 Free PMC article.
-
Spatiotemporal cytokinin response imaging and ISOPENTENYLTRANSFERASE 3 function in Medicago nodule development.Plant Physiol. 2022 Jan 20;188(1):560-575. doi: 10.1093/plphys/kiab447. Plant Physiol. 2022. PMID: 34599592 Free PMC article.
-
Analysis of nodule senescence in pea (Pisum sativum L.) using laser microdissection, real-time PCR, and ACC immunolocalization.J Plant Physiol. 2017 May;212:29-44. doi: 10.1016/j.jplph.2017.01.012. Epub 2017 Feb 17. J Plant Physiol. 2017. PMID: 28242415
-
Identification of Phytocyanin Gene Family in Legume Plants and their Involvement in Nodulation of Medicago truncatula.Plant Cell Physiol. 2019 Apr 1;60(4):900-915. doi: 10.1093/pcp/pcz007. Plant Cell Physiol. 2019. PMID: 30649463
Cited by
-
CLE peptide signaling in plant-microbe interactions.Front Plant Sci. 2024 Oct 23;15:1481650. doi: 10.3389/fpls.2024.1481650. eCollection 2024. Front Plant Sci. 2024. PMID: 39507357 Free PMC article. Review.
-
The Defective in Autoregulation (DAR) gene of Medicago truncatula encodes a protein involved in regulating nodulation and arbuscular mycorrhiza.BMC Plant Biol. 2024 Aug 10;24(1):766. doi: 10.1186/s12870-024-05479-6. BMC Plant Biol. 2024. PMID: 39123119 Free PMC article.
-
Investigating biological nitrogen fixation via single-cell transcriptomics.J Exp Bot. 2025 Feb 25;76(4):931-949. doi: 10.1093/jxb/erae454. J Exp Bot. 2025. PMID: 39563004 Free PMC article. Review.
-
Mutation of BAM2 rescues the sunn hypernodulation phenotype in Medicago truncatula, suggesting that a signaling pathway like CLV1/BAM in Arabidopsis affects nodule number.Front Plant Sci. 2024 Jan 11;14:1334190. doi: 10.3389/fpls.2023.1334190. eCollection 2023. Front Plant Sci. 2024. PMID: 38273950 Free PMC article.
-
Understanding the root of the problem for tackling pea root rot disease.Front Microbiol. 2024 Oct 24;15:1441814. doi: 10.3389/fmicb.2024.1441814. eCollection 2024. Front Microbiol. 2024. PMID: 39512933 Free PMC article. Review.
References
-
- Bhattacharjee O, Raul B, Ghosh A, Bhardwaj A, Bandyopadhyay K, and Sinharoy S 2022. Nodule INception-independent epidermal events lead to bacterial entry during nodule development in peanut (Arachis hypogaea). New Phytol 236:2265–2281. - PubMed
-
- Bravo A, York T, Pumplin N, Mueller LA, and Harrison MJ 2016. Genes conserved for arbuscular mycorrhizal symbiosis identified through phylogenomics. Nat. Plants 2:15208. - PubMed
-
- Breakspear A, Liu CW, Roy S, Stacey N, Rogers C, Trick M, Morieri G, Mysore KS, Wen JQ, Oldroyd GED, Downie JA, and Murray JD 2014. The root hair “infectome” of Medicago truncatula uncovers changes in cell cycle genes and reveals a requirement for auxin signaling in rhizobial infection. Plant Cell 26:4680–4701. - PMC - PubMed
-
- Brewin NJ 1991. Development of the legume root nodule. Annu. Rev. Cell Biol 7:191–226. - PubMed
MeSH terms
Substances
Grants and funding
LinkOut - more resources
Full Text Sources
Miscellaneous