. 2023 Sep 18;12(1):231.
doi: 10.1038/s41377-023-01275-3.

Opening a window to skin biomarkers for diabetes stage with optoacoustic mesoscopy

Affiliations

Opening a window to skin biomarkers for diabetes stage with optoacoustic mesoscopy

Hailong He et al. Light Sci Appl. .

Abstract

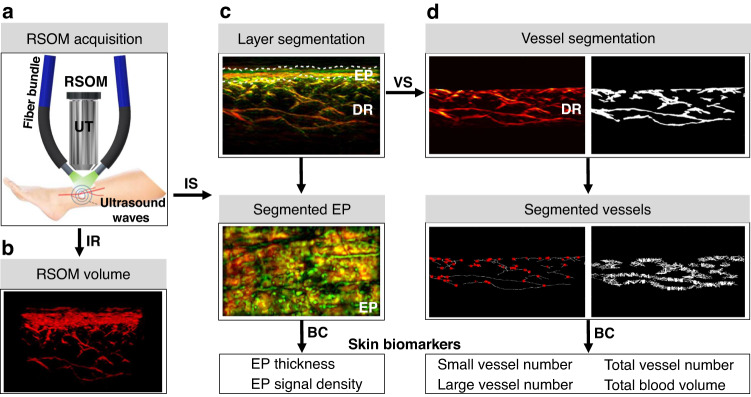
Being the largest and most accessible organ of the human body, the skin could offer a window to diabetes-related complications on the microvasculature. However, skin microvasculature is typically assessed by histological analysis, which is not suited for applications to large populations or longitudinal studies. We introduce ultra-wideband raster-scan optoacoustic mesoscopy (RSOM) for precise, non-invasive assessment of diabetes-related changes in the dermal microvasculature and skin micro-anatomy, resolved with unprecedented sensitivity and detail without the need for contrast agents. Providing unique imaging contrast, we explored a possible role for RSOM as an investigational tool in diabetes healthcare and offer the first comprehensive study investigating the relationship between different diabetes complications and microvascular features in vivo. We applied RSOM to scan the pretibial area of 95 participants with diabetes mellitus and 48 age-matched volunteers without diabetes, grouped according to disease complications, and extracted six label-free optoacoustic biomarkers of human skin, including dermal microvasculature density and epidermal parameters, based on a novel image-processing pipeline. We then correlated these biomarkers to disease severity and found statistically significant effects on microvasculature parameters as a function of diabetes complications. We discuss how label-free RSOM biomarkers can lead to a quantitative assessment of the systemic effects of diabetes and its complications, complementing the qualitative assessment allowed by current clinical metrics, possibly leading to a precise scoring system that captures the gradual evolution of the disease.


Conflict of interest statement

V.N. is an equity owner and consultant for iThera Medical GmbH, Munich, Germany.

Figures

Fig. 1
Fig. 1. Computation pipeline of skin biomarkers from RSOM images.
a Schematic of the RSOM system employed for skin measurements, comprising two fiber bundles for illumination and a high frequency ultrasound transducer (UT) that was raster scanned over the skin surface. RSOM signals are recorded on the pretibial area of the lower extremities of both healthy volunteers and participants with diabetes, after which volumetric image reconstruction (IR) is performed. b A reconstructed RSOM volume image. The volumetric RSOM image is segmented (IS) to identify the epidermis layer and dermal vasculature, which are used to subsequently compute biomarkers. c Segmentation of the cross-sectional RSOM image into the epidermis (EP) and dermis (DR) layers of the skin (white dashed lines). The EP thickness and EP signal density biomarkers were computed from the segmented EP layers in the RSOM images. d Vessel segmentation of the segmented DR layer of the skin. The numbers of vessel branches and vessel diameters were automatically calculated; the red dots indicate positions of vessel branches. The segmented vessels in the DR were used to calculate the vessel numbers and total blood volume biomarkers. IR image reconstruction, IS image segmentation, VS vessel segmentation, BC biomarker computation, scale bar = 500 µm
Fig. 2
Fig. 2. Skin imaging of the lower extremities (distal pretibial region) of healthy volunteers and participants with diabetes using clinical RSOM.
a Sectional RSOM image of healthy skin. b Sectional RSOM image of skin from a participant with diabetes but without neuropathy. MIP images of the EP and DR layers in the coronal views corresponding to (a, b) are displayed in (c, d) and (e, f), respectively. gI Comparisons of computed biomarkers between healthy volunteers and participants with diabetes. g Total number of small vessels (with diameter ≤40 µm) in DR layer. h Total number of large vessels (with diameter >40 µm) in DR layer. i Total numbers of vessels in DR layer. j Total blood volume of the DR vasculature. k Average thicknesses of the EP layers. l Signal densities of the EP layers. The healthy volunteer (control) group had a population of 48, while the group of participants with diabetes had a population of 95. *P < 0.05, **P < 0.01, and ***P < 0.001, respectively. Scale bar = 500 µm. EP epidermis, DR dermis
Fig. 3
Fig. 3. Quantification of RSOM features in participants with diabetic neuropathy.
The diabetic participants were grouped as follows: NC (n = 45), participants and no complications; LN (n = 13), participants with diabetes and low score neuropathy (1 ≤ NDS ≤ 5 or 1 ≤ NSS ≤ 5); HN (n = 12), participants with diabetes and high score neuropathy (NDS > 5 or NSS > 5). a Sectional RSOM image of healthy skin. b Sectional RSOM image of skin from a participant with diabetes but without neuropathy. c Sectional RSOM image of skin from a participant with diabetes and low score neuropathy (NDS: 3, NSS: 3). d Sectional RSOM image of skin from a participant with diabetes and high score neuropathy (NDS: 9, NSS: 9). MIP images of the EP and DR layers in the coronal views corresponding to (ad) are displayed in (eh) and (il) respectively. mr Comparisons amongst the four groups of participants with diabetes and healthy volunteers for each of the six computed biomarkers. m Total number of small vessels (with diameter ≤40 µm) in DR layer. n Total number of large vessels (diameter >40 µm) in DR layer. o Total vessel numbers in DR layer. p Total blood volume in DR layer. q Thickness of EP layer. r Signal density of EP layer as a function of group studied. *P < 0.05, **P < 0.01, and ***P < 0.001, respectively. Scale bar = 500 µm. ns not statistically significant, NDS Neuropathy Disability Score, NSS Neuropathy Symptom Score, EP epidermis, DR dermis
Fig. 4
Fig. 4. Quantification of RSOM features in participants with diabetic neuropathy and atherosclerosis.
Participants with diabetes were grouped as follows: diabetic subjects with neuropathy and no atherosclerosis (NnA, n = 25); diabetic subjects with neuropathy and atherosclerosis (NA, n = 24). a Sectional RSOM image from NnA participant. b Sectional RSOM image from NA participant. c, d MIP images of vascular maps in the coronal views of DR layers corresponding to (a, b). ej Comparisons between the two groups for the following features: e total number of small vessels (with diameter ≤40 µm) in DR layer; f total number of large vessels (with diameter >40 µm) in DR layer; g total number of vessels in DR layer; h total blood volume in DR layer; i thickness of EP layer; j signal density of EP layer. *P < 0.05, **P < 0.01, and ***P < 0.001, respectively. Scale bar = 500 µm. ns not statistically significant. EP epidermis, DR dermis

References

    1. Guariguata L, et al. Global estimates of diabetes prevalence for 2013 and projections for 2035. Diabetes Res. Clin. Pract. 2014;103:137–149. doi: 10.1016/j.diabres.2013.11.002. - DOI - PubMed
    1. NCD Risk Factor Collaboration (NCD-RisC). Worldwide trends in diabetes since 1980: a pooled analysis of 751 population-based studies with 4·4 million participants. Lancet387, 1513–1530 (2016). - PMC - PubMed
    1. Barrett EJ, et al. Diabetic microvascular disease: an endocrine society scientific statement. J. Clin. Endocrinol. Metab. 2017;102:4343–4410. doi: 10.1210/jc.2017-01922. - DOI - PMC - PubMed
    1. Cheung CY, et al. The clinical implications of recent studies on the structure and function of the retinal microvasculature in diabetes. Diabetologia. 2015;58:871–885. doi: 10.1007/s00125-015-3511-1. - DOI - PubMed
    1. Papanas N, Vinik AI, Ziegler D. Neuropathy in prediabetes: does the clock start ticking early? Nat. Rev. Endocrinol. 2011;7:682–690. doi: 10.1038/nrendo.2011.113. - DOI - PubMed