. 2023 Sep 18;8(1):355.
doi: 10.1038/s41392-023-01578-2.

Hypoxia-inducible factor upregulation by roxadustat attenuates drug reward by altering brain iron homoeostasis

Affiliations

Hypoxia-inducible factor upregulation by roxadustat attenuates drug reward by altering brain iron homoeostasis

Pengju Yan et al. Signal Transduct Target Ther. .

Abstract

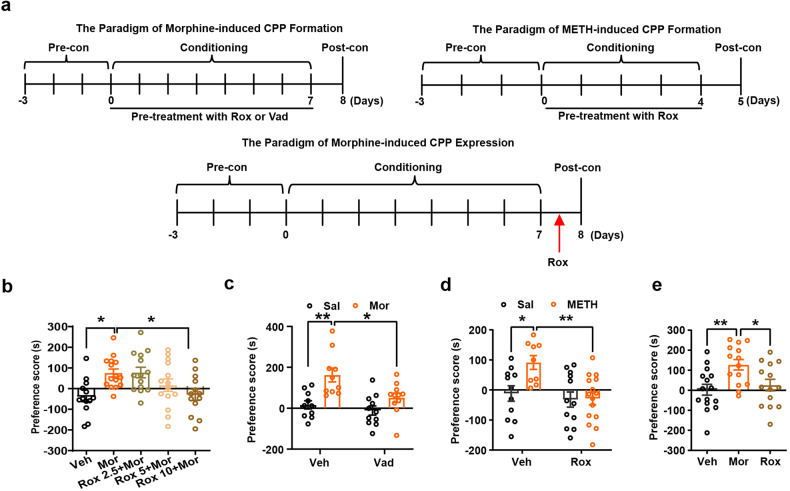
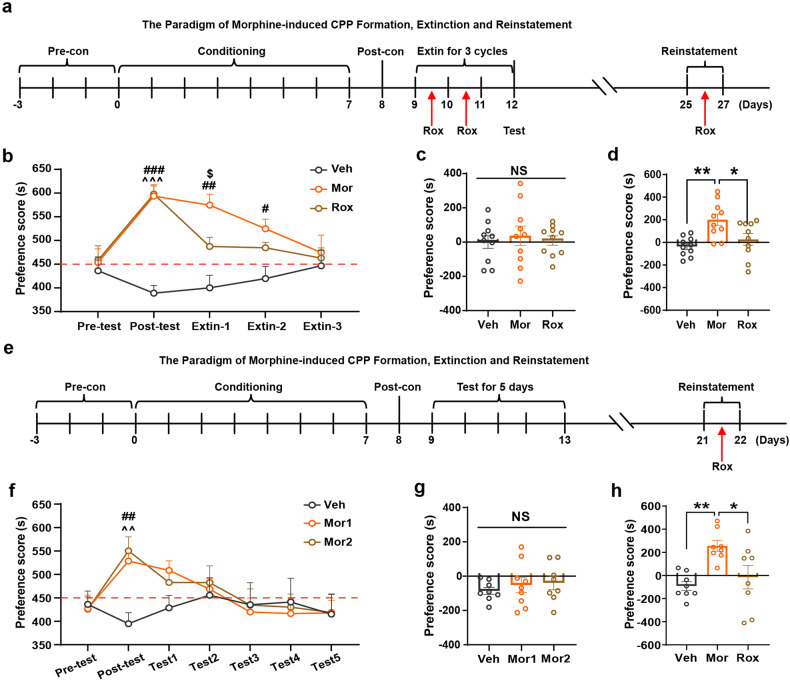
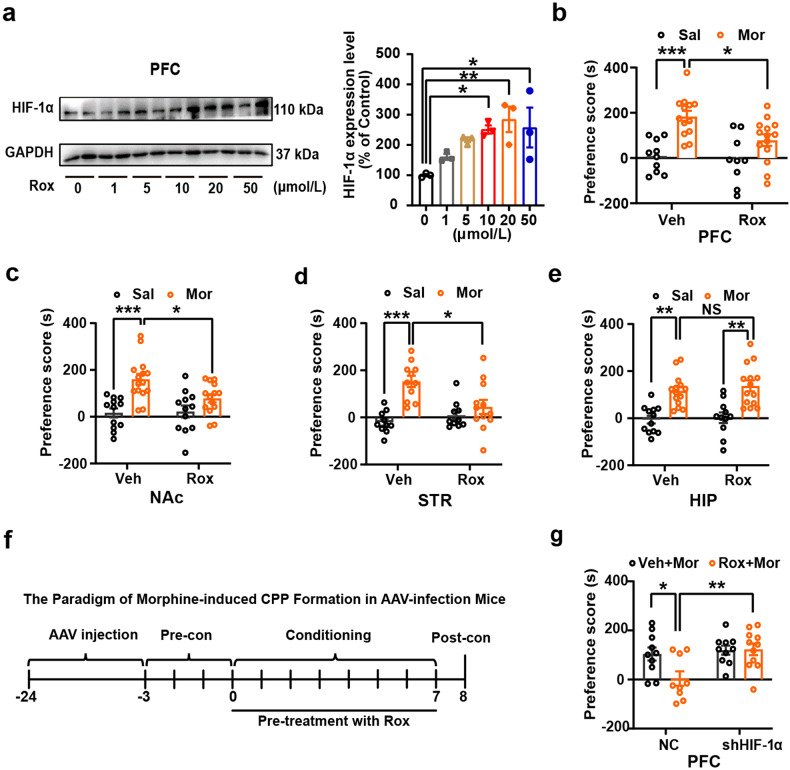
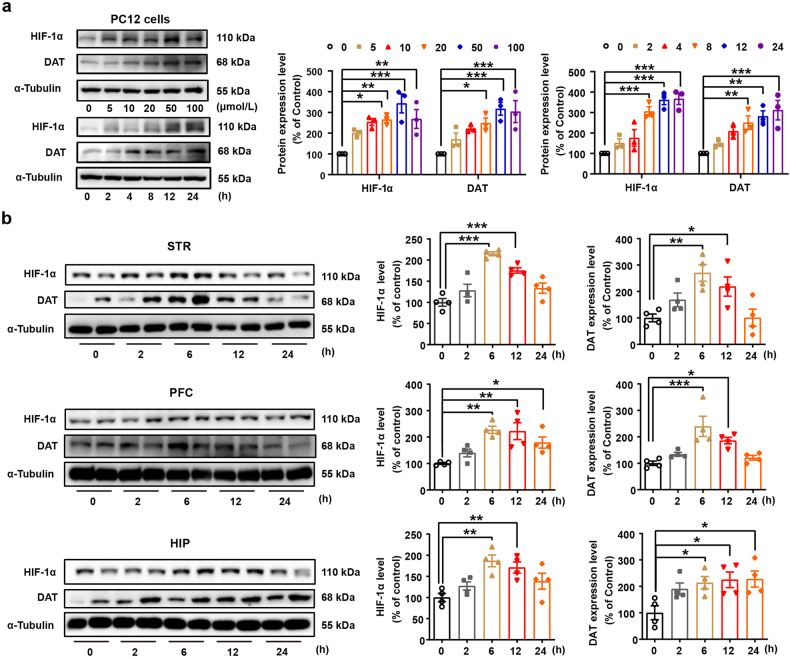
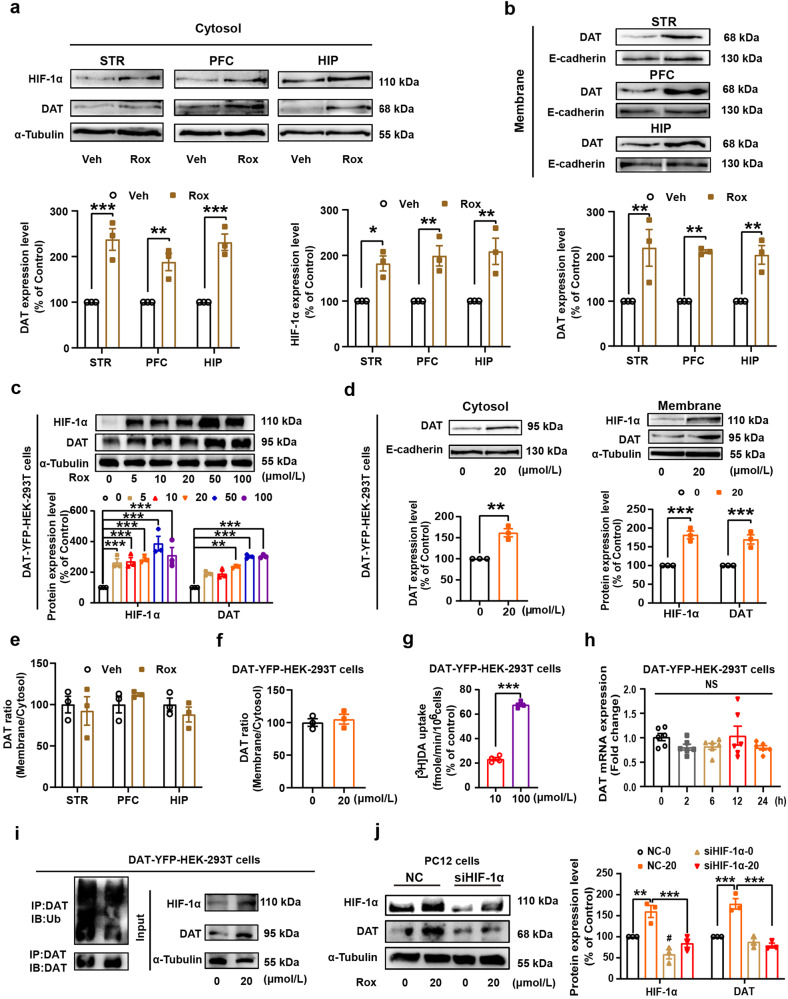
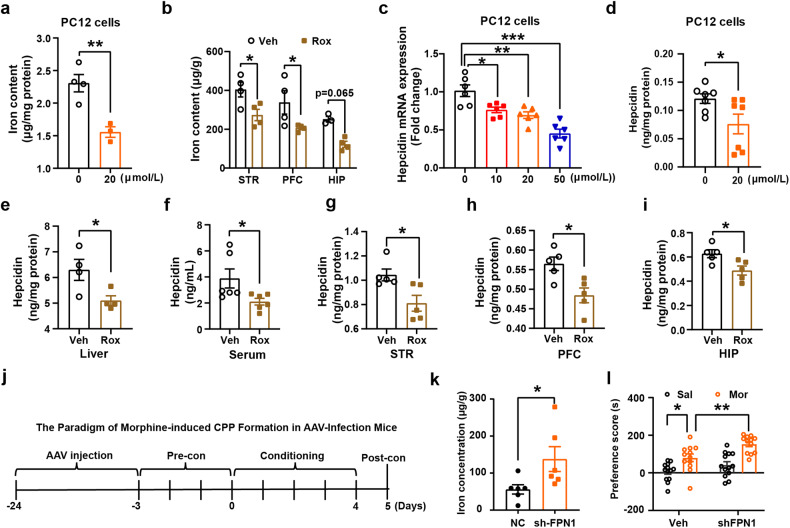
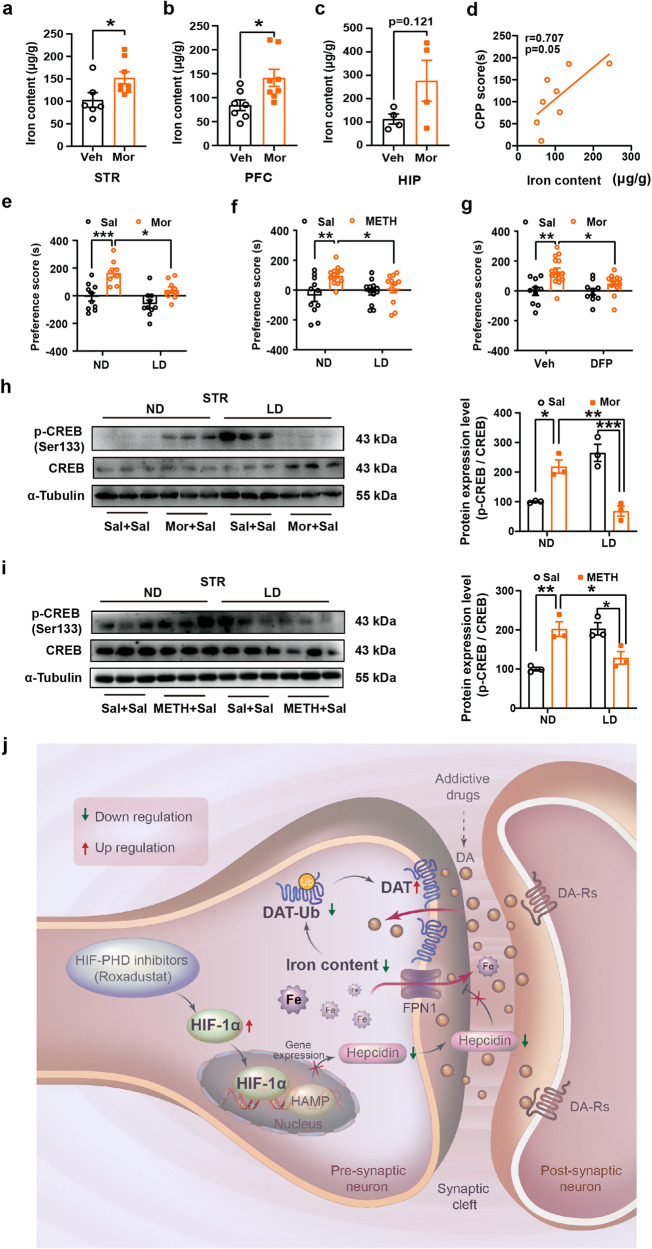
Substance use disorder remains a major challenge, with an enduring need to identify and evaluate new, translational targets for effective treatment. Here, we report the upregulation of Hypoxia-inducible factor-1α (HIF-1α) expression by roxadustat (Rox), a drug developed for renal anemia that inhibits HIF prolyl hydroxylase to prevent degradation of HIF-1α, administered either systemically or locally into selected brain regions, suppressed morphine (Mor)-induced conditioned place preference (CPP). A similar effect was observed with methamphetamine (METH). Moreover, Rox also inhibited the expression of both established and reinstated Mor-CPP and promoted the extinction of Mor-CPP. Additionally, the elevation of HIF-1α enhanced hepcidin/ferroportin 1 (FPN1)-mediated iron efflux and resulted in cellular iron deficiency, which led to the functional accumulation of the dopamine transporter (DAT) in plasma membranes due to iron deficiency-impaired ubiquitin degradation. Notably, iron-deficient mice generated via a low iron diet mimicked the effect of Rox on the prevention of Mor- or METH-CPP formation, without affecting other types of memory. These data reveal a novel mechanism for HIF-1α and iron involvement in substance use disorder, which may represent a potential novel therapeutic strategy for the treatment of drug abuse. The findings also repurpose Rox by suggesting a potential new indication for the treatment of substance use disorder.


Conflict of interest statement

: The authors declare no competing interests.

Figures

Fig. 1
Fig. 1
Roxaduatat (Rox) inhibits morphine (Mor)- and methamphetamine (METH)- induced CPP acquisition and expression. a The paradigm of morphine- and METH-induced CPP formation and expression. In the CPP acquisition test, the mouse was treated with Rox or Vad in the conditioning phase; In the CPP expression test, mouse received a single injection of Rox 6 h before postconditioning test. b 6 h pretreatment with Rox inhibited Mor-CPP acquisition as indicated by reduction in CPP scores as compared with Mor group (Veh, n = 13; Mor, n = 15; Rox 2.5+Mor, n = 14; Rox 5+Mor, n = 14; Rox 10+Mor, n = 13; group, F(4,64) = 4.790, P = 0.0019). c 6 h pretreatment with Vadadustat (Vad, 10 mg/kg) inhibited Mor-CPP acquisition as indicated by reduction in CPP scores (Veh-Sal, n = 10; Veh-Mor, n = 10; Vad+Sal, n = 11; Vad+Mor, n = 11; group, F(1,38) = 16.92, P = 0.0002; drug, F(1,38) = 7.483, P = 0.0094; group × drug, F(1,38) = 2.701, P = 0.1085). d 6 h pretreatment with Rox (10 mg/kg) inhibited METH-CPP acquisition as indicated by reduction in CPP scores (Veh-Sal, n = 11; Veh-METH, n = 9; Rox+Sal, n = 12; Rox+METH, n = 15; group, F(1,43) = 4.867, P = 0.0328; drug, F(1,43) = 8.431, P = 0.0058; group × drug, F(1,43) = 4.279, P = 0.0446). e A single injection of Rox (10 mg/kg, 6 h pretreatment) inhibited Mor-CPP expression as indicated by reduction in CPP scores (Veh, n = 16; Mor, n = 15; Rox, n = 15; group, F(2,40) = 5.808, P = 0.0061). Values are presented as means ± SEM. Statistical analyses for b, e and c, d were performed using one-way ANOVA and two-way ANOVA followed by Bonferroni-corrected tests, respectively. *P < 0.05, **P < 0.01. Veh: vehicle; Sal: saline
Fig. 2
Fig. 2
Rox promotes Mor-CPP extinction and inhibits Mor-CPP reinstatement. a The paradigm of Mor-CPP formation, extinction and reinstatement. As described in Methods section (Pattern 1), the CPP established mouse was trained to extinct, Rox was administrated instate of morphine after postconditioning phase for 3 cycles and a single Rox injection was conducted 6 h before reinstatement test. b Time spent in drug-paired box in Mor-CPP formation and extinction periods. Rox (10 mg/kg) promoted extinction of Mor-CPP as indicated by faster reduction in CPP scores (Veh, Mor and Rox, n = 10; group, F(2,135) = 24.26, P < 0.0001; period, F(4,135) = 4.217, P = 0.0030; group × period, F(8,135) = 3.894, P = 0.0004). c Saline injection did not induce reinstatement of Mor-CPP (Veh, Mor and Rox, n = 10; F(2,27) = 0.1959, P = 0.8232). d Mor (5 mg/kg) triggered Mor-CPP reinstatement, whereas it was inhibited by Rox (10 mg/kg) treatment (Veh, Mor and Rox, n = 10; F(2,27) = 7.725, P = 0.0022). e The paradigm of Mor-CPP formation, extinction and reinstatement. As described in Methods section (Pattern 2), the mouse, CPP well established, was trained to extinct by repeat preference tests for 5 consecutive days, Rox was administrated instate of morphine after postconditioning phase for 3 cycles and a single Rox injection was conducted 6 h before reinstatement test. f Mor group was divided into Mor1 and Mor2 groups. Time spent in Mor-paired box in CPP formation and extinction periods (Veh, n = 12; Mor1, n = 14; Mor2, n = 12; group, F(2,245) = 1.862, P = 0.1576; period, F(6,245) = 2.431, P = 0.0266; group × period, F(12,245) = 1.173, P = 0.3030). g Saline injection did not induce reinstatement of Mor-CPP (Veh, n = 8; Mor1, n = 9; Mor2, n = 8; group, F(2,22) = 0.4210, P = 0.6616). h Mor (5 mg/kg) successfully triggered Mor-CPP reinstatement, whereas it was inhibited by Rox (10 mg/kg) treatment (Veh, Mor and Rox, n = 8; F(2,21) = 7.110, P = 0.0044). Values are presented as means ± SEM. Statistical analyses for b, f and and for c, d, g and h were performed using two-way ANOVA and one-way ANOVA followed by Bonferroni-corrected tests, respectively. *P < 0.05, **P < 0.01; #P < 0.05, ##P < 0.01, ###P < 0.001 Mor or Mor1 vs Veh; ^^P < 0.01, ^^^P < 0.001 Rox or Mor2 vs. Veh; $P < 0.05 Mor vs Rox; NS: not significant. Veh: vehicle; Sal: saline
Fig. 3
Fig. 3
Local infusion of Rox selectively attenuates Mor-CPP acquisition and knockdown of HIF-1α abolishes Rox efficiency on Mor-CPP. Bilateral cannulae was implanted into PFC, NAc (shell), STR and HIP 7 days prior to CPP performance, respectively. a Local infusion of Rox (20 μmol/L, 2 μL per site) for 2 h dose-dependently upregulated HIF-1α expression in PFC (n = 3, F(5,12) = 4.451, P = 0.0159). be Local infusion of Rox 2 h before Mor injection every day in conditioning phase inhibited Mor-CPP acquisition in following brain regions: PFC (Veh-Sal, n = 10; Veh-Mor, n = 13; Rox-Sal, n = 9; Rox-Mor, n = 14; group, F(1,42) = 21.97, P < 0.0001; drug, F(1,42) = 4.694, P = 0.0360; group × drug, F(1,42) = 2.631, P = 0.1122); NAc (shell) (Veh-Sal, n = 12; Veh-Mor, n = 15; Rox-Sal, n = 12; Rox-Mor, n = 14; group, F(1,49) = 21.05, P < 0.0001; drug, F(1,49) = 2.981, P = 0.0905; group × drug, F(1,49) = 4.043, P = 0.0499); and STR (Veh-Sal, n = 10; Veh-Mor, n = 11; Rox-Sal, n = 10; Rox-Mor, n = 12; group, F(1,39) = 19.69, P < 0.0001; drug, F(1,39) = 2.719, P = 0.1072; group × drug, F(1,39) = 8.609, P = 0.0056) as indicated by reduction in CPP scores; no effect of Rox in HIP (Veh-Sal, n = 12; Veh-Mor, n = 14; Rox-Sal, n = 11; Rox-Mor, n = 14; group, F(1,47) = 39.28, P < 0.0001; drug, F(1,47) = 0.5163, P = 0.4760; group × drug, F(1,47) = 0.0995, P = 0.7538). f The paradigm of Mor-CPP in AAV-infection mice. AAV9-hSyn-EGFP- NC and neuronal specific AAV9-hSyn-EGFP-shHIF-1α were injected into PFC 21 days before CPP performance, Rox (20 μmol/L, 2 μL per site) was injected 2 h before morphine injection every day in conditioning phase. g Knockdown of HIF-1α abolished Rox efficiency in inhibiting Mor-CPP acquisition (NC-Veh-Mor, n = 10; sh-HIF-1α-Veh-Mor, n = 10; NC-Rox+Mor, n = 9; sh-HIF-1α-Rox+Mor, n = 11; group, F(1,36) = 3.829, P = 0.0581; drug, F(1,36) = 7.412, P = 0.0099; group × drug, F(1,36) = 4.404, P = 0.0429). Values are presented as means ± SEM. Statistical analysis for a, and for b-e and g were performed using one-way ANOVA and two-way ANOVA followed by Bonferroni-corrected tests, respectively. *P < 0.05, **P < 0.01, ***P < 0.001; NS: not significant
Fig. 4
Fig. 4
Rox treatment increases dopamine transporter (DAT) expression. a PC12 cells were treated with roxadustat 24 h at indicated concentration (0–100 μmol/L) or treated with 20 μmol/L roxadustat at indicated time point (0-24 h) for immunoblot assays of HIF-1α and DAT, Rox treatment increased HIF-1α and DAT expression in a dose- and time-dependent manner (Concentration gradient: n = 3, drug, F(5,24) = 15.65, P < 0.0001; protein, F(1,24) = 0.4849, P = 0.4929; drug × protein, F(5,24) = 0.3974, P = 0.8457. Time course: n = 3, drug, F(5,24) = 26.66, P < 0.0001; protein, F(1,24) = 3.079, P = 0.0921; drug × protein, F(5,24) = 1.301, P = 0.2965). b Rox treatment increased HIF-1α and DAT expression in WT mice. WT mice brain tissues (STR, PFC, HIP) were collected after 10 mg/kg roxadustat administration at indicated time point and prepared for immunoblot assays (STR: n = 4, HIF-1α, F(4,15) = 19.95, P < 0.0001; DAT, F(4,15) = 6.427, P = 0.003. PFC: n = 4, HIF-1α, F(4,15) = 7.852, P = 0.0013; DAT, F(4,15) = 8.747, P = 0.0008. HIP: n = 4, HIF-1α, F(4,15) = 6.544, P = 0.0029; DAT, F(4,15) = 3.987, P = 0.0213). Representative images shown in the left panels and quantitative data are shown in the right panels. Values are presented as means ± SEM. Statistical analyses for a, and for b were performed using two-way ANOVA and one-way ANOVA followed by Bonferroni-corrected tests, respectively. *P < 0.05, **P < 0.01, ***P < 0.001
Fig. 5
Fig. 5
Rox treatment increases plasma DAT expression and uptake activity. a, b WT mice were sacrificed after 6 h roxadustat (10 mg/kg) administration. Then, mice brain tissues (STR, PFC and HIP) were collected and the plasma membrane and cytosol protein were extracted as described in Methods for immunoblot assays. Rox treatment increased DAT expression in plasma and cytosol (a: DAT, n = 3, drug, F(1,12) = 101.7, P < 0.0001; area, F(2,12) = 1.732, P = 0.2184; drug × area, F(2,12) = 1.732, P = 0.2184; HIF-1α, n = 3, drug, F(1,12) = 53.13, P < 0.0001; area, F(2,12) = 0.3386, P = 0.7149; drug × area, F(2,12) = 0.3386, P = 0.7149. b: n = 3, drug, F(1,12) = 52.32, P < 0.0001; area, F(2,12) = 0.08727, P = 0.9170; drug × area, F(2,12) = 0.08727, P = 0.9170). c YFP-tagged DAT stablely expressed HEK-293T (DAT-YFP-HEK-293T) cells were treated with Rox at indicated concentration (0–100 μmol/L) for 24 h and prepared for immunoblot assays. Rox treatment increased HIF-1α and DAT expression in DAT-YFP-HEK-293T cells (n = 3, drug, F(5,24) = 25.23, P < 0.0001; protein, F(1,24) = 12.81, P = 0.0015; drug × protein, F(5,24) = 1.249, P = 0.3177). d DAT-YFP-HEK-293T cells were treated with 20 μmol/L roxadustat for 24 h. Then, the plasma membrane and cytosol protein were extracted as described in Methods and prepared for immunoblot assays. Rox treatment increased expression of DAT in both plasma and cytosol and HIF-1α in cytosol in DAT-YFP-HEK-293T cells (membrane, n = 3, t = 6.521, df = 4, P = 0.0029. cytosol, n = 3, drug, F(1,8) = 90.17, P < 0.0001; protein, F(1,8) = 0.5780, P = 0.4689; drug × protein, F(1,8) = 0.5780, P = 0.4689). e-f Rox treatment did not change the ratio of plasma membrane and cytosol DAT in mice brain tissues as well as in DAT-YFP-HEK-293T cells (e n = 3, drug, F(1,12) = 0.092, P = 0.7667; area, F(2,12) = 0.7726, P = 0.4835; drug × area, F(1,12) = 0.7726, P = 0.4835. f n = 3, t = 0.5311, df = 4, P = 0.6235). g [3H] DA uptake assays in DAT-YFP-HEK-293T cells treated with 10 μmol/L or 100 μmol/L of Rox for 24 h. Rox treatment increased DAT uptake activity as indicated by increased [3H] DA uptake (n = 4, t = 24.21, df = 6, P < 0.0001). h 20 μmol/L Rox treatment for 0–24 h did not alter DAT mRNA expression in DAT-YFP-HEK-293T cells (n = 6, F(4,25) = 1.391, P = 0.2658). i Rox treatment (20 μmol/L, 24 h for cells and 10 mg/kg, 6 h for mouse) inhibited DAT ubiquitination. DAT-YFP-HEK-293T cell lysates were precipitated with DAT antibody-conjugating agarose beads to purify DAT proteins. Followed by immunoblotting with anti-ubiquitin and anti-DAT antibody to detect the ubiquitination levels of DAT and DAT expression in the purified samples, respectively. Total cell lysate was used to detect the total expression of HIF-1α, DAT and α-Tubulin by immunoblotting with specific anti-HIF-1α, anti-DAT and anti-α-Tubulin antibodies. j HIF-1α siRNA (50 pmol/L) was transfected into PC12 cells for 48 h to knockdown HIF-1α as described in Methods. Then, PC12 cells were treated with roxadustat (20 μmol/L) for another 24 h before collection for immunoblot assays. Knockdown of HIF-1α by siRNA transfection abolished Rox efficacy in upregulation of HIF-1α and DAT (n = 3, group, F(3,16) = 45.42, P < 0.0001; protein, F(1,16) = 2.698, P = 0.1200; group × protein, F(3,24) = 1.566, P = 0.2366). Representative images for a-d are shown in the upper panels and quantitative data are shown in the lower panels. Representative images for j are shown in the left panels and quantitative data are shown in the right panels. Values are presented as means ± SEM. Statistical analyses for a-c, d (cytosol), e and j, and for d (membrane) and f-g, and for h were performed using two-way ANOVA followed by Bonferroni-corrected tests and Student’s t-test and one-way ANOVA followed by Bonferroni-corrected tests, respectively. *P < 0.05, **P < 0.01, ***P < 0.00; NS: not significant
Fig. 6
Fig. 6
Rox treatment inhibits iron accumulation by reducing hepcidin expression and knockdown of FPN1 induces susceptibility of Mor-CPP. a PC12 cells were treated with 20 μmol/L roxadustat for 24 h. Then, the cells were prepared for ICP-MS detection of total iron content. Rox treatment lowered iron content in PC12 cells (0 μmol/L, n = 4, 20 μmol/L, n = 3, t = 4.382, df = 5, P = 0.0071). b WT mice were sacrificed after 6 h roxadustat (10 mg/kg) injection, the brain tissues, liver and serum were collected for ICP-MS detection of total iron content. Rox injection lowered iron content in STR (n = 4), PFC (n = 4) and HIP (Veh, n = 3, Rox, n = 4, drug, F(1,17) = 21.65, P = 0.0002; area, F(2,17) = 9.455, P = 0.0017; drug × area, F(2,17) = 0.0007598, P = 0.9992). c, d PC12 cells were treated with 20 μmol/L Rox for 24 h. Then, the cells were prepared for q-PCR and Elisa assays, Rox treatment lowered the expression of hepcidin in PC12 cells (c, n = 6, F(3,20) = 17.53, P < 0.0001. d, n = 7, t = 2.310, df = 12, P = 0.0395). e-i ELISA of hepcidin protein in Rox (10 mg/kg, 6 h) treated WT mice. Rox treatment lowered the expression of hepcidin in mouse liver (n = 4, t = 2.648, df = 6, P = 0.0381), serum (n = 6, t = 2.312, df = 10, P = 0.0433), STR (n = 5, t = 2.868, df = 8, P = 0.0209), PFC (n = 5, t = 3.169, df = 8, P = 0.0132), and HIP (n = 5, t = 2.807, df = 8, P = 0.0229). j The paradigm of Mor-CPP in AAV-infection mice. pAKD-CMV-bGlobin-mCherry-3*FLAG-WPRE-H1-shRNA and pAAV-CBG-mCherry-3*FLAG-WPRE-H1-shFPN1 virus were injected into NAc for 21 days before CPP performance. k, l After 21 days virus infection, mice brain tissues were collected and prepared for iron content detection with ICP-MS, FPN1 knockdown induced iron accumulation in NAc (n = 6, t = 2.294, df = 10, P = 0.0447). FPN1 knockdown mice were more sensitive to Mor-CPP as evidenced by higher CPP scores in shFPN1+Mor group as compared with Veh+Mor group. (NC-Sal, n = 13; NC-Mor, n = 12; sh-FPN1+Sal, n = 13; sh-FPN1+Mor, n = 12; group; F(1,46) = 10.96, P = 0.0018, drug, F(1,46) = 32.08, P < 0.0001; group × drug, F(1,46) = 1.313, P = 0.2578). Values are presented as means ± SEM. Statistical analyses for a and di and k, and for b and l, and for c were performed using Student’s t-test and two-way ANOVA and one-way ANOVA followed by Bonferroni-corrected tests, respectively. *P < 0.05, **P < 0.01, ***P < 0.001
Fig. 7
Fig. 7
Iron deficiency inhibits Mor- and METH-induced CPP formation and phosphorylation of CREB. a-c Mouse brain tissues were collected within 24 h after Mor-CPP tests and prepares for ICP-MS detection of total iron content. Iron content was increased after Mor-CPP formation (a, Veh, n = 6, Mor, n = 8, t = 2.346, df = 12, P = 0.0370. b Sal, n = 7, Mor, n = 8, t = 2.628, df = 13, P = 0.0209. c Sal, n = 4, Mor, n = 4, t = 1.806, df = 6, P = 0.1209). d The correlation of iron content and CPP score was analyzed by correlation analysis. Iron content was correlated positively with Mor-CPP scores (n = 8, r = 0.707, P = 0.05). e, f WT mice were fed with low iron diet for 4 weeks as described in Methods. Low iron diet suppressed Mor- and METH-CPP acquisition as indicated by reduction in CPP scores (e, ND-Sal, n = 10, ND-Mor, n = 8, LD-Sal, n = 10, LD-Mor, n = 9; group, F(1,33) = 23.61, P < 0.0001; diet, F(1,33) = 9.514, P = 0.0041; group × diet, F(1,33) = 1.616, P = 0.2125. f ND-Sal, n = 11, ND-METH, n = 13, LD-Sal, n = 13, LD-METH, n = 12; group, F(1,45) = 9.155, P = 0.0041; diet, F(1,45) = 1.302, P = 0.2598; group × diet, F(1,45) = 4.769, P = 0.0342). g The bilateral cannula was implanted into PFC of mice brain 7 days prior to CPP performance, deferiprone (DFP) (13 mg/mL, 2 μL per site) was injected 6 h before morphine injection every day in conditioning phase. DFP pretreatment suppressed Mor-CPP acquisition as indicated by reduction in CPP scores (Veh-Sal, n = 10, Veh-Mor, n = 16, DFP-Sal, n = 10, DFP-Mor, n = 14; group, F(1,46) = 18.14, P = 0.0001; drug, F(1,46) = 3.751, P = 0.0589; group × diet, F(1,46) = 3.167, P = 0.0817). h, i Mice whole striatum tissues were collected 24 h after Mor- and METH-CPP tests for immunoblot assays, respectively. Low iron diet suppressed Mor- and METH-induced expression of (Ser133) phosphorylated-CREB in STR (h, n = 3, group, F(1,8) = 3.749, P = 0.0889; drug, F(1,8) = 0.1284, P = 0.7293; group × drug, F(1,8) = 61.05, P < 0.0001. i n = 3, group, F(1,8) = 0.8998, P = 0.3706; drug, F(1,8) = 0.9758, P = 0.3522; group × drug, F(1,8) = 35.83, P = 0.0003). j Schematic diagram of possible mechanisms underlying Rox-induced amelioration of drug dependence. Rox induces HIF-1α accumulation and nuclear translocation, thereby inhibiting hepcidin transcription. Iron efflux is enhanced by reduction of hepcidin mediated-FPN1 degradation. Finally, iron deficiency suppresses DAT ubiquitin degradation, thus decreasing DA concentration in the synaptic cleft and ultimately ameliorating drug dependence. The Schematic diagram was drawn by Adobe Illustrator software (Version 2022). Representative images for immunoblots are shown in the left panels and quantitative data are shown in the right panels. Values are presented as means ± SEM. Statistical analyses for a-c, and for d, and for e-i were performed using Student’s t-test and correlation analysis and two-way ANOVA followed by Bonferroni-corrected tests, respectively. *P < 0.05, **P < 0.01, ***P < 0.001

References

    1. Nestler EJ. Molecular basis of long-term plasticity underlying addiction. Nat. Rev. Neurosci. 2001;2:119–128. - PubMed
    1. Soyka M. Treatment of benzodiazepine dependence. N. Engl. J. Med. 2017;376:1147–1157. - PubMed
    1. Ali SF, et al. Understanding the global problem of drug addiction is a challenge for idars scientists. Curr. Neuropharmacol. 2011;9:2–7. - PMC - PubMed
    1. Hong WC, Amara SG. Differential targeting of the dopamine transporter to recycling or degradative pathways during amphetamine- or pkc-regulated endocytosis in dopamine neurons. FASEB J. 2013;27:2995–3007. - PMC - PubMed
    1. Sambo DO, et al. The sigma-1 receptor modulates methamphetamine dysregulation of dopamine neurotransmission. Nat. Commun. 2017;8:2228. - PMC - PubMed

Publication types