Infection and inflammation stimulate expansion of a CD74+ Paneth cell subset to regulate disease progression
- PMID: 37718683
- PMCID: PMC10620768
- DOI: 10.15252/embj.2023113975
Infection and inflammation stimulate expansion of a CD74+ Paneth cell subset to regulate disease progression
Abstract
Paneth cells (PCs), a specialized secretory cell type in the small intestine, are increasingly recognized as having an essential role in host responses to microbiome and environmental stresses. Whether and how commensal and pathogenic microbes modify PC composition to modulate inflammation remain unclear. Using newly developed PC-reporter mice under conventional and gnotobiotic conditions, we determined PC transcriptomic heterogeneity in response to commensal and invasive microbes at single cell level. Infection expands the pool of CD74+ PCs, whose number correlates with auto or allogeneic inflammatory disease progressions in mice. Similar correlation was found in human inflammatory disease tissues. Infection-stimulated cytokines increase production of reactive oxygen species (ROS) and expression of a PC-specific mucosal pentraxin (Mptx2) in activated PCs. A PC-specific ablation of MyD88 reduced CD74+ PC population, thus ameliorating pathogen-induced systemic disease. A similar phenotype was also observed in mice lacking Mptx2. Thus, infection stimulates expansion of a PC subset that influences disease progression.
Keywords: CD74; Lyz1; Paneth cell; heterogeneity; lysozyme.
© 2023 The Authors. Published under the terms of the CC BY NC ND 4.0 license.
Conflict of interest statement
The authors declare that they have no conflict of interest.
Figures
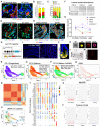
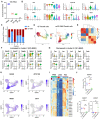
- A
Representative immunofluorescent analysis for human α‐defensin 5 (HD5) and REG3G in human IBDs. Yellow arrows point to cells with co‐staining of both proteins. Scale bars, 20 μm.
- B
Percentage of Paneth cells expressing only HD5, only REG3, or both proteins in 16 CD and 6 UC tissues.
- C
Percentage of Paneth cells expressing only HD5, only MMP7, or both proteins in CD (n = 21), UC (n = 15), celiac disease (n = 13), and GvHD (n = 10) tissues.
- D
Representative immunofluorescent analysis for HD5 and MMP7 in CD ileums and UC colons. Yellow arrows point to double positive cells; red and green arrows point to cells positive only for HD5 or MMP7, respectively. Scale bars, 20 μm.
- E
Representative immunofluorescent analysis for HD5, MMP7 and E‐Cadherin in human celiac disease and GvHD intestinal tissues. Yellow arrows point to double positive cells; red and green arrows point to cells positive only for HD5 or MMP7, respectively. Scale bars, 20 μm.
- F
Mouse fecal pellets were collected from wild type mice of pre‐weaning age (P10‐15), 1‐month old post‐weaning young adults, and aged adults over 1‐year old. 40‐μg protein extract per sample was used for dot blotting analysis by lysozyme or Mptx2 antibodies. Columns represent different biological samples loaded in technical triplicates.
- G
Densitometry quantifications of dot blots for lysozyme, Mptx2, Mmp7, or α‐defensin 1 from pre‐weaning age (n = 5), 1‐month old adults (n = 9), and aged mice (n = 11). Blots of Mmp7 and α‐defensin 1 are shown in Fig EV1D and E. Error bars represent standard error of the mean (SEM).
- H
Schematic diagram of the newly developed Lyz13′UTR‐IRES‐CreER inducible PC transgenic mice. After crossing to Rosa26R‐tdTamato mice, the resulting mice are referred to as PC reporter.
- I
Lyz13′UTR‐IRES‐CreER; Rosa26R‐tdTomato (PC reporter) mice were injected with a single dose of tamoxifen. 8, 24, and 48 h later, mice were sacrificed, and intestinal tissue sections were stained for tdTomato (red) and DAPI (blue). Scale bars, 200 μm.
- J
Representative PC reporter mouse small intestines were stained for tdT and endogenous lysozyme. Scale bars, 10 μm.
- K
Representative ImageStream analysis of FACS‐sorted live single tdT+ Paneth cells stained for EpCAM and CD24. Scale bars, 5 μm.
- L
Forty‐eight hours after tamoxifen injection, live crypts were isolated from PC reporter mice, and visualized for the direct tdT fluorescence under epi‐fluorescent microscope. Scale bars, 200 μm.
- M
Isolated crypts were digested to single cell suspension, which were visualized for direct tdT fluorescence under epi‐fluorescent microscope. Scale bars, 200 μm.
- N–P
10× Genomics scRNA‐Seq and Seurat‐based UMAP analysis of 13,519 duodenal and ileal Paneth cells. Marker genes identified three major populations corresponding to the PC progenitors (panel N), mature PCs (panel O), and a subset of mature PCs (panel P) with several enriched lncRNA. Gene sets were shown in individual graphs.
- Q
UMAP analysis of Atoh1‐expressing Paneth cells.
- R
Cell–cell correlation matrix analysis shows 12 clusters.
- S
Seurat UMAP shows 12 unsupervised clusters.
- T
Top 5 differentially enriched genes of each cluster were shown in dot plots. Clusters 5 and 9 are PC progenitors. The smallest cluster (cluster 11) is a non‐PC cluster.
- U, V
Comparison of the reads of MyD88, TLR4, and TLR5 in PCs of this current PC‐specific scRNA dataset, with scRNA sequencing dataset of mouse small intestinal epithelial cells (Haber), and human small intestine (Wang).
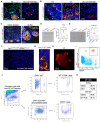
- A, B
Immunofluorescent co‐staining for HD5 (red) and REG3G (green) in involved and uninvolved CD and UC patient tissues Arrows point to double positive cells.
- C
Immunofluorescent co‐staining for HD5 (red) and MMP7 (green) in celiac disease and GvHD patient tissues.
- D, E
Immuno‐dot blot analysis for Mmp7 and α‐defensin 1 using fecal protein extracts from five pre‐weaning (P10‐15), nine post‐weaning (1‐month), and 11 aged (> 1‐year old) mice. Data represent mean ± SEM from biological replicates. *P < 0.05; **P < 0.01.
- F
Lyz13′UTR‐IRES‐CreER; Rosa26R‐tdTomato (PC reporter) mice were injected with tamoxifen and sacrificed 24 h after. Representative image of tissue stained for tdT (red) and DAPI (blue).
- G
PC report mouse small intestines were stained for tdT (red) and Mmp7 (green).
- H
Enteroids were grown from PC reporter mice. Tamoxifen was added to the culture medium. After overnight culture, the images were acquired under epi‐fluorescent microscope.
- I
Live intestinal crypt epithelial cell suspension prepared from PC reporter mice were analyzed by FACS for CD24 and tdT. tdT+/CD24+ cells are boxed.
- J
Total crypt epithelial cells were isolated from PC reporter mice and gated with two different strategies: top, tdT+; bottom, EpCAM+/Cd24+/large. tdT+ cell population contains all EpCAM+/Cd24+/large cells.
- K
Flow‐based analysis shows high viability and purity of flow sorted tdT+ single cells that were used for single cell RNA sequencing analysis.
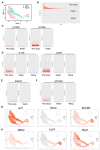
- A
UMAP analysis of duodenum and ileum Paneth cells in scRNA sequencing data.
- B
Graphs illustrating the number of Paneth cells (Y‐axis) to the number of genes (X‐axis) uncovered in this current Paneth cell scRNA‐Seq dataset, in mouse total mouse IEC dataset (Haber), and in human ileum dataset (Wang).
- C–F
Normalized reads for IL1RAP and IL10B (panel I), IL17R and IL22R (panel J), IFNLR1 (panel K), and ATG16L1 (panel J) in the Paneth cells from this current Paneth cell scRNA‐Seq dataset, in mouse Paneth cells of Haber's dataset and in human Paneth cells of Wang's dataset. Note, some genes were not found in Wang's Paneth cell dataset.
- G, H
UMAP analysis of Lyz1, Gzma, EpCAM, Mptx2, CD74, and Muc2. Circled is the smallest cluster of 80 Lyz1+/Gzma+/EpCAM−/Mptx2−/Muc2− non‐Paneth cells (0.59% of total population).
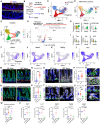
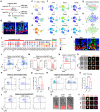
- A
A colony of PC reporter mice was re‐derived into germ free. GF reporter mice were injected with sterile tamoxifen to activate the reporter and sacrificed at day 3. Representative GF and SPF reporter mouse ilea were imaged by confocal immunofluorescent analysis for tdT expression. Scale bars, 100 μm.
- B
GF PC reporter littermates were divided into two groups: one group was orally gavaged with freshly prepared C57BL/6 cecum microbiota (exGF+B6M) and the other group received water (kept as GF controls). After 3 weeks of colonization, mice were injected with sterile tamoxifen, and PCs were isolated from both groups for scRNA‐seq analysis.
- C
UMAP shows ileal 5,224 and 5,646 PCs of GF (blue) and GF+B6M (red) conditions, respectively.
- D
Slingshot trajectory analysis revealed two lineages (denoted as dashed and solid lines), both of which started from PC progenitors (cluster 0 and 3). The first trajectory (dashed line) terminated at cluster 1 (primarily GF mature PCs) while the second (solid line) terminated at cluster 2 (primarily exGF+B6M mature PCs). The shown pseudotime variables represent the second lineage (solid line, exGF+B6M PCs). Note the cluster 1 contains a small number of exGF+B6M PCs (please see Fig EV3C).
- E
UMAP shows five unsupervised clusters.
- F
UMAP analysis of Olfm4 + PC progenitors.
- G
Differential gene expression analysis comparing cluster 1 (primarily GF PCs) and cluster 2 (primarily exGF+B6M PCs) shown as a volcano plot. Top increased transcripts in cluster 2, include Reg3g, Mptx2, Defa27, Defa35, and AY761185.
- H, I
Violin plots show the top increased and decreased transcripts in cluster 1 versus cluster 2 PCs.
- J–L
UMAP analysis of PCs expressing Mptx2, Reg3g, and Lyz1.
- M–P
Immunofluorescent analysis for Mptx2 (M) or Lysozyme (O) in age matched GF and SPF mouse ileums. Numbers of cells positive for each marker protein were counted per crypt from approximately 100 crypts imaged from 20 to 25 independent microscopic fields from five mice per condition. Average values of individual field and unpaired t‐test were reported in panel (N) for Mptx2 (****P < 0.0001) and panel (P) for lysozyme (*P < 0.05). Scale bars, 20 μm.
- Q
Representative high magnification images of lysozyme staining in GF and SPF ileal PCs. Scale bars, 10 μm.
- R–U
Immunofluorescent analysis for Mptx2 (R) or lysozyme (T) on ileum sections of GF mice mono‐colonized with R. gnavus or L. rhamnosus for 21 days. Two experiments were performed for each mono‐colonization. Cells positive for each protein marker per crypt were counted from different microscopic fields from five mice per condition. Average values of individual fields and one‐way ANOVA test were reported in (S) and (U). GF mice gavaged with PBS were used as control. **P < 0.01; ***P < 0.001. Scale bars, 20 μm.
- V
Representative high magnification images of lysozyme staining in R. gnavus or L. rhamnosus monocolonized mouse ileal PCs. Scale bars, 10 μm.
- W
The number of lysozyme‐containing granules per crypt were counted and averaged from each image of 2–3 high magnification images per condition. n = 5 mice for each condition. One‐way ANOVA test was performed. *P < 0.05; **P < 0.01; ***P < 0.001.
- X
GF mice gavaged with PBS, monocolonized by R. gnavus or by L. rhamnosus (n = 5 mice for each condition) were sacrificed 21 days after colonization. Bulk RNA‐Seq analysis were performed on total ileum RNA. Transcripts of Atoh1, Lyz1, Mptx2, Reg3g, and Mmp7 per million reads were plotted with adjusted P‐values from differential gene expression analysis for RNA‐Seq tool in CLC genomics based on GLM model. *P < 0.05; **P < 0.01; ***P < 0.001.
- A
Colonic fecal DNAs were extracted from GF and GF+B6 mice, and used for qPCR amplification of 16S rRNA gene. Cycle threshold (Ct) values were shown. Water and SPF mouse fecal DNA were used as negative and positive controls, respectively. No Ct was detected from amplifying GF mouse fecal DNA (n.d.).
- B
Violin plots of Lgr5, Lyz1, AY61185, Reg3g, Olfm4, Mptx2, Defa35, and Malat1 in the six untargeted clusters revealed by UMAP in Fig 2E. Cluster 0 and 3 were identified as progenitors by Olfm4 and Lgr5.
- C
Proportion bar graphs for GF versus exGF+B6M Paneth cells in individual clusters.
- D
Slingshot trajectory analysis identified two lineages (solid and dashed lines) for GF Paneth cells and exGF+B6M Paneth cells.
- E
Cluster correlation analysis shows close correlation between cluster 1 (primarily GF PCs) and cluster 2 (primarily exGF+B6M PCs).
- F, G
Violin plots showing the most increased (F) and decreased (G) transcripts in exGF+B6M ileal Paneth cells comparing to GF ileal Paneth cells.
- H
UMAP assembled from GF and exGF+B6M Paneth cells show the populational expression of Defa35, AY761185, Malat1, and CD74.
- I
Ileal bulk RNA‐seq of C57BL6 GF mice given PBS (PBS), mono‐associated 21 days with L. rhamnosus (LGG) or R. gnavus (RG). Paneth cell related genes are shown in the heat map.
- J
RNA transcript abundance of Defa35, Defa27, and Defa31 in GF mice, and exGF mice mono‐associated 21 days with L. rhamnosus (LGG) or R. gnavus (RG). Data represent mean ± SEM from biological replicates. Adjusted P‐values from differential gene expression analysis for RNA‐Seq tool in CLC genomics based on GLM model. ***P < 0.001.
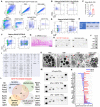
- A
PC reporter mice were injected with tamoxifen to label PCs, and orally gavaged with 15 mg streptomycin dissolved in PBS. One day later, mice were divided into two groups: one group was gavaged with 108 CFU Salmonella (+SAL) and the other group was gavaged with sterile PBS (−SAL). All mice were sacrificed 4 days after inoculation. Ileal tdT+ Paneth cells from −SAL and +SAL mice were FACS‐sorted for scRNA‐Seq analysis.
- B
Representative immunofluorescent analysis for tdT and PCNA in ilea of uninfected (−SAL) and S. typhimurium‐infected (+SAL) reporter mice. Scale bars, 20 μm.
- C
UMAP analysis of −SAL (blue) and +SAL (yellow) ileal Paneth cells (total 16,530 cells).
- D
UMAP analysis of Olfm4‐expressing progenitor PCs circled by dotted line.
- E
UMAP analysis of Lyz1‐expressing PCs.
- F
UMAP analysis of 9 most highly elevated transcripts in +SAL PCs comparing to −SAL PCs.
- G–I
t‐SNE analysis by Cd74‐based clustering of SPF (blue), −SAL (red, with streptomycin treatment), and +SAL (green, with streptomycin and Salmonella) conditions. A cluster of Cd74high PCs is circled by red dotted line in panel (H). This Cd74high cluster also expresses high Mptx2, circled in panel (I).
- J
Dot plots comparing SPF versus −SAL versus +SAL PCs show the abundance of infection‐induced signature genes, in addition to several known PC‐enriched genes including Lyz1 and defensins.
- K
Representative immunofluorescent analysis of Cd74 (green) and tdT (red) in ilea of uninfected and Salmonella‐infected PC reporter mice. Scale bars, 10 μm. Empty arrowheads point to Cd74+ stem cells. Solid arrowheads point to Cd74+ tdT+ Paneth cells.
- L
FACS analysis of live crypt epithelial cells isolated from −SAL and +SAL PC reporter mice. Cells were gated on live EpCAM+, then analyzed for tdT+ and surface Cd74+. Data represent five independent experiments performed on paired −SAL and +SAL mice analyzed on the same day.
- M
Histograms of PCs (red) and non‐PC crypt epithelial cells (gray) show the change of normalized abundance of Cd74‐expressing cells in −SAL and +SAL mice. X‐axis represents Cd74 expression.
- N
PCs were labeled either before (blue) or after (red) Salmonella infection in paired littermates. Mice were sacrificed on the same day for FACS analysis. Cells were gated on live EpCAM+/tdT+ PCs and analyzed for Cd74 expression. Results represent two independent experiments.
- O
ImageStream of live tdT+ PCs stained by Cd74 and tdT in −SAL and +SAL mice where PCs were labeled before (pre‐) or after (post‐) infection. Images represent > 200 cells of each condition. Scale bars, 5 μm.
- P, Q
FACS analysis of crypt epithelial cells from wild type C57BL/6 mice of −SAL and +SAL conditions. Cells were gated on live, EpCAM+, Cd24+ large cells (PCs), and analyzed for percentages of Cd74+ PCs in −SAL and +SAL littermates (n = 5–6 mice each group). Data were analyzed by unpaired t‐test from three independent experiments. Error bars represent SEM.
- R, S
FACS analysis of crypt epithelial cells from wild type C57BL/6 mice pretreated with cefoperazone, and infected (+C. diff) or not infected (−C. diff) with C. difficile. On 2 d.p.i, ileal epithelial cells were gated on gated on live, EpCAM+, CD24 large (Paneth cells) cells and analyzed for percentage of Cd74+ PCs of each condition (n = 3 mice each). Results were analyzed by paired t‐test from two independent experiments. Error bars represent SEM.
- T
FACS analysis of tdT+ PCs from reporter mice that were uninfected (PBS), infected with C. difficile 2 d.p.i, or infected with Citrobacter 4 d.p.i. Cells were gated on live, EpCAM+, tdT+ cells and analyzed for Cd74, which represent two independent experiments.
- U
Representative crypts isolated from uninfected (PBS), Citrobacter‐ or C. difficile‐infected PC reporter mice that were imaged for direct tdT fluorescence under an epi‐fluorescent microscope. Scale bars, 20 μm.
- V
ImageStream analysis for single Paneth cells stained with Cd74, Cd24, and tdT from uninfected (PBS), Citrobacter‐ or C. difficile‐infected PC reporter mice. Results represent > 200 images for each condition. Scale bars, 5 μm.

- A
A list of the 49 genes significantly elevated in PCs upon Salmonella infection.
- B
Seurat‐ based UMAP analysis of SPF (blue), −SAL (red, treated with antibiotics), and +SAL (green) ileal Paneth cells (total of 23,423 cells).
- C
UMAP analysis the top 12 most SAL‐elevated genes, circled by dotted line for +SAL cells.
- D
UMAP analysis of Cd74, Retnlb, and Reg3b.
- E
t‐SNE shows Cd74‐based clustering of PCs of SPF, −SAL, and +SAL conditions. Note the Cd74‐expressing cluster is also enriched with Gpx2.
- F, G
Validation of two Cd74 antibodies used for immunostaining and for flow cytometry, respectively, on Cd74−/− mice. For FACS analysis, ileal Paneth cells from Salmonella‐infected wild‐type C57BL6 and Cd74−/− mice were gated on live, EpCAM+, Cd24+ large, and analyzed for Cd74.
- A
Gating strategy for FACS analysis was used to obtain percentage of Cd74+ Paneth cells in all Paneth cells, as shown in Fig 3P. Collected events were gated using forward scatter and side scatter to isolate single cells. Viable cells were gated by DAPI−, epithelial cells were gated by EpCAM+, and Paneth cells were gated by Cd24 (large).
- B, C
Representative FACS analysis of ileal Paneth cells analyzed by Cd24 and Cd74 in ABX (left) and ABX+SAL mice on a C57BL6 × 129 mixed background (right). Increase of percentage of cells in Q2 illustrates an increase in Cd74 expression. Cd74+ Paneth cells were quantified as a percentage of the live/EpCAM+/Cd24 large population and compared by t‐test. Data represent mean ± SEM from five uninfected and four infected mice in two independent experiments.
- D
FACS analysis of C57BL6 ileal total live EpCAM+ cells in −SAL and +SAL mice were gated on live/EpCAM+/Cd24+/large and analyzed for Cd74+ percentage. These are extended view of all IECs as opposed to only Paneth cells shown in Fig 3P. These plots represent at least 3 independent experiments.
- E
C57BL6 mice were orally infected by 107 CFU Salmonella (a lower dose) without streptomycin pretreatment to preserve mouse survivability. The average Cd74+ Paneth cell percentages were analyzed from uninfected, 3 and 9 d.p.i mice, and reported in the table.
- F
FACS analysis of C57BL6 ileal total live EpCAM+ cells in −C. diff and +C. diff mice were gated on live/EpCAM+/Cd24+/large and analyzed for Cd74+ percentage.
- G
H & E stained mouse ileum 2 days post C. difficile infection. Image represents at least five independent mice.
- H, I
The secretome of Cd74+ Paneth cells were determined by a proteome‐based 111‐cytokine profiler. The blank medium was used as baseline. Dot intensity for each protein target was determined after background subtraction. Based on the absolute abundance, the table in Panel (I) listed these proteins in order from the highest to the lowest abundances.
- J
Sorted tdT+ Paneth cells from infected reporter mice were treated ex vivo by PBS, MIF, MIF plus 4‐IPP, or MIF plus α‐Cd74 (30,000 cells per condition). Mptx2 dot blots were performed using supernatants collected 30 min after treatment.
- K
Representative TEM images of untreated, MIF‐treated ileal Paneth cells, and MIF/4‐IPP‐treated Paneth cells demonstrating ruffled halos (red arrows) surrounding electron‐dense granules when treated with MIF.
- L
Reactome analysis shows Cd74+ Paneth cells are enriched by secretory granule structural and degranulation gene programs.
- M
Cytokine arrays incubated with supernatant collected from lamina propria cells co‐cultured with Cd74+ or Cd74− Paneth cells isolated from infected mice.
- N
Cytokine productions from Cd74+ versus Cd74− tdT+ Paneth cell‐LP co‐cultures after each normalized by the values of LP cells alone.
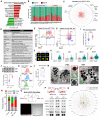
fGSEA analysis comparing Cd74+ and Cd74− PC transcriptomes shows that the top enriched gene sets are OXPHOS, infection, IFN response, degranulation, autophagy, and ROS pathway (P < 0.001).
Proportion of total transcripts of a list of cytokine receptors, cytokines, and growth factors in Cd74+ (red) and Cd74− (green) PCs in +SAL mice.
Live tdT+/Cd74+ PCs were FACS sorted from Salmonella‐infected PC reporter mice, pooled, and seeded in base culture medium. After 16 h, supernatants from the PC culture were collected for a proteome‐based secretome analysis on a 111‐cytokine array (duplicate dots per cytokine). Blank medium was used for baseline for each cytokine. The average densitometry values “Cd74+ PCs minus blank medium” for individual cytokines were transformed by natural Log and plotted in an alphabetical order. Targets with high peak are labeled in red.
The top 20 secreted proteins, based on absolute abundances, are listed in order.
FACS analysis for intracellular cell ROX on PCs sorted from SPF, −SAL (ABX), and +SAL mice, which represent three independent experiments.
ImageStream of cell ROX‐stained single PCs isolated from SPF, −SAL (ABX), and +SAL mice. Scale bars, 5 μm.
FACS analysis for Cd74 and Gpx2 in cells gated on live tdT+ PCs of +SAL mice and −SAL (ABX) mice.
Violin plots made from scRNA results show the transcript abundances of Mif, Ifitm3, and Gpx2 in Cd74 + and Cd74 − PCs.
6,000 FACS‐sorted tdT+ PCs from +SAL mouse ilea were treated ex vivo with either PBS or recombinant MIF for 30 min. Peroxidase activity was measured from 10 μl of supernatants. Results were analyzed by unpaired t‐test from five mice in two independent experiments. Error bars represent SEM.
6,000 FACS‐sorted tdT+ PCs from +SAL mouse ilea were treated ex vivo with either PBS or recombinant MIF for 30 min. Mptx2 proteins were measured from supernatants by dot blotting assay. Densitometry values were analyzed by unpaired t‐test from five mice in two independent experiments. Error bars represent SEM.
Intracellular ROX were measured by FACS from sorted single tdT+ PCs treated ex vivo by PBS (n = 903 cells), MIF (n = 1,077 cells), and by MIF plus 4‐IPP (n = 522 cells). Data represent two independent experiments.
Sorted EpCAM+/Cd24+ Paneth cells from paired WT and Cd74−/− mice (n = 5 for each genotype) were treated ex vivo by MIF. Mptx2 was quantified from supernatants by dot blots analysis. Paired t‐test was used for statistical comparison.
TEM micrographs of sorted tdT+ PCs that were treated by PBS or by MIF ex vivo. Arrows point to degranulated dense core particle. Scale bars, 1 μm.
Based on the granule morphologies characterized as “normal,” “de‐coated,” “empty,” and “free” (outside of the cells), percentages of each morphology were determined from a total of 126, 216, and 125 granules from PCs treated by PBS, MIF‐, or MIF/4‐IPP, respectively.
Diagram shows that live Cd74− and Cd74+ PCs were flow‐sorted from infected reporter mice and pooled. Same number of Cd74− or Cd74+ PCs (4,377) were seeded for co‐culture with wild type ileal lamina propria cells. After 16‐h co‐culture, representative images of the co‐culture were taken under epi‐fluorescent and brightfield microscope. Scale bars, 200 μm.
Supernatants were taken from PC/LP co‐culture and determined for cytokine production using an antibody‐based cytokine array. Supernatants from lamina propria cells alone (without PCs) were blotted on paired arrays to serve as baseline. Representative cytokines that were changed in Cd74+ PC/LP co‐culture were shown.
For each cytokine, average densitometry values of technical duplicates from Cd74− PC/LP or Cd74+ PC/LP co‐cultures were normalized against LP monoculture. The ratios were log‐transformed and presented on radar plots (green: Cd74+ PC/LP co‐culture; red: Cd74− PC/LP co‐culture). Results represent two independent experiments.
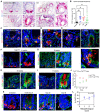
- A
Using probes specific for human CD74 (in blue) and LYZ (in red), dual RNA base‐scope analyses were performed on CD, UC, GvHD, and non‐IBD patient tissues. Representative images were shown, with arrows pointing to CD74 +/LYZ + glandular cells. Scale bars, 50 μm; and 20 μm in high magnifications.
- B
Three to six independent fields, where Paneth cells were found, were imaged for each patient sample of UC (n = 6), CD (n = 4), GvHD (n = 6), and non‐IBD (n = 12). CD74 transcript numbers per Paneth cells were counted, and the averages were plotted for each individual patient. Data represent mean ± SEM. *P < 0.05; **P < 0.01.
- C
CD patient ilea (n = 21) were immunostained for CD74 and lysozyme. Arrows point to double‐positive cells.
- D
CD patient ilea (n = 21) were immunostained for HD5 and CD74. Arrows point to double‐positive cells.
- E
UC patient (n = 15) descending colon (left) and rectum (right) were stained for HD5 and CD74. Arrows point to double‐positive cells.
- F–I
Immunofluorescent staining for Cd74 and lysozyme in TNFdARE mouse ilea of 4 weeks (F), 8 weeks (G), 10 weeks (H), and 17 weeks (I) of age. Scale bars, 50 μm; and 20 μm in high magnifications. Arrows point to Cd74+ Paneth cells.
- J
Numbers of lysozyme+ Paneth cells (red) and lysozyme+/Cd74+ cells (green) per crypt were counted from 22 to 41 crypts from five independent mice of each time point. Data are plotted as mean and SEM for each time point.
- K
To induce GvHD, irradiated BALB/c mice were transplanted with donor B6 T‐cell‐depleted BM cells mixed with CD4+ T cells. Whole small intestines were dissected after 8, 22, and 38 days of disease induction. Representative immunostaining images of Cd74 and lysozyme were shown for untreated and diseased tissues at different time points. N = 5–6 mice for each time point. Scale bars, 20 μm.
- L
From a cohort of 10 mice at 22 and 38 days after T‐cell transplantation, percentage of Cd74+ Paneth cells were determined by immunostaining from different tissue fields characterized as no inflammation (0), low (1), moderate (2) and severe (3) inflammation. The correlation coefficient (r) analysis was performed between Cd74+ PC percentage and inflammatory severity and was determined as 0.74. Data represent mean ± SEM.
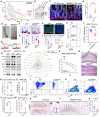
- A
Seurat UMAP analysis shows MyD88‐expressing PCs in SPF mouse duodenum and ileum.
- B
Genomic PCR was done on DNA extracted from tdT+ PCs flow sorted from WT (lane 1), heterozygous (lane 2), and MyD88 Fl/Fl ;Lyz1 3′UTR‐CreER ;R26R‐tdT (MyD88 ΔPC) mice (lane 3). Primes specifically for amplifying floxed MyD88 (pointed by red arrowhead) showed effective recombination (deletion). Toe DNA from MyD88 ΔPC mice serve as negative control (lane 4).
- C
Representative immunostaining analysis for tdT (red) and E‐Cad (white) in WT and MyD88 ΔPC mouse ileum at 4 d.p.i. of Salmonella infection. Images represent 15–20 independent experiments. Arrows point to abnormal Paneth cells that migrated to villus. Scale bars, 50 μm.
- D
Number of tdT+ cells above +4 position per crypt was counted and compared by unpaired t‐test from 22 to 25 crypts of WT and MyD88ΔPC mice (n = 3 for each genotype) infected with Salmonella.
- E
Representative images were taken under brightfield and epi‐fluorescent microscope for crypts freshly isolated 4 d.p.i from WT and MyD88ΔPC mice infected with Salmonella. Results represent at least five independent experiments. Arrows point to abnormal Paneth cells that migrated to villus. Scale bars, 50 μm.
- F, G
Dual RNA base‐scope analysis was performed for Ang4 (blue) and Lyz1 (red) on WT and MyD88ΔPC mouse ileal Paneth cells 4 d.p.i of Salmonella infection. Number of transcripts per crypts for Ang4 (left) and Lyz1 (right) were quantified by Image J from 20 to 25 crypts of WT or MyD88ΔPC mice (n = 3 for each genotype), and compared in panel (G) with an unpaired t‐test. Scale bars, 50 μm.
- H, I
Representative immunofluorescent staining for Mptx2 (red) and E‐Cad (green) in WT and MyD88ΔPC mice 4 d.p.i of Salmonella infection (n = 3 for each genotype). Average crypt Mptx2 protein abundances from 12 independent fields were compared by unpaired t‐test in panel (I). Scale bars, 50 μm.
- J
Fecal Mptx2 protein abundances were determined by dot blots. Densitometry values for individual WT and MyD88ΔPC biological replicates (n = 5) were compared by unpaired t‐test.
- K, L
FACS analysis of tdT+/Cd74+ PCs in WT and MyD88ΔPC mouse ilea 4 d.p.i of Salmonella infection. Percentages of Cd74+ PCs of total PCs were compared by unpaired t‐test from WT and MyD88ΔPC biological replicates in three independent experiments.
- M, N
Paneth cells were sorted from WT versus MyD88ΔPC mice (n = 3 each genotype) at 4 d.p.i. by Salmonella and pooled. 5,000 PCs of each genotype were seeded for co‐culture with wild type lamina propria cells. After 16‐h, antibody‐based cytokine arrays were used to determine cytokine production from the co‐cultures and from lamina propria cell alone (w/o PC). Representative cytokines changed in MyD88ΔPC PC/LP co‐culture are shown.
- O
For each cytokine, averaged densitometry values of technical duplicates from WT‐PC/LP co‐culture or MyD88ΔPC PC/LP co‐cultures were normalized against LP monoculture. The resulting ratios were log‐transformed and presented on radar plots (green: WT‐PC/LP co‐culture; red: MyD88ΔPC PC/LP co‐culture). Results represent two independent experiments.
- P
Body weight changes of WT and MyD88 ΔPC mice (n = 5 biological replicates for each genotype) after Salmonella infection.
- Q, R
Representative histology of infected WT and MyD88ΔPC mouse ilea. Ileocolic inflammation was scored from ileum and colon of each mouse based on epithelial damage and immune cell infiltration detailed in Method (n = 5 mice for each genotype). Scale bars, 200 μm.
- S
Spleen Salmonella CFU was determined for each WT and MyD88ΔPC mouse 4 d.p.i. Data were plotted as per mg of spleen tissue from five mice of each genotype.
- T
FACS analysis of Ly6G and CD45 cells in Salmonella‐infected WT and MyD88ΔPC mouse ileal lamina propria. LPLs were stained and viable cells were analyzed.
- U
FACS analysis of CD4 and F4/80 cells in Salmonella‐infected WT and MyD88ΔPC mouse ileal lamina propria. LPLs were stained and viable cells were gated on CD45+ and analyzed for F4/80 (macrophage marker) and CD4 (murine macrophages are CD4−).
- V, W
Unpaired t‐test comparison of the percentages of viable CD45+/Ly6G+ neutrophils, and CD45+/F4/80+/CD4− macrophages. N = 4 mice for each genotype from two independent experiments.
- X, Y
Immunohistochemical staining of Ly6B.2 in WT and MyD88ΔPC mouse ilea 4 d.p.i. Scale bars, 200 μm; 50 μm in high magnification images.
- Z
Numbers of Ly6B.2+ cells per crypt‐villus axis were counted and averaged from 10 different microscopic fields of three mice for each genotype. Data were analyzed by unpaired t‐test.
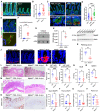
- A
Immunofluorescent staining of Mptx2 (red) and E‐Cadherin (green) in SPF mouse duodenum and ileum. Scale bars, 50 μm.
- B
Average Mptx2 fluorescent abundance per crypt was determined from 20 to 25 crypts imaged in six to eight independent fields for duodenum or ileum (n = 5 each) and compared by unpaired t‐test.
- C
Immunofluorescent staining of Mptx2 (red) and E‐Cadherin (green) in streptomycin‐treated uninfected (ABX w/o SAL) and Salmonella‐infected mouse ilea (ABX+SAL). Bottom panels are high magnification of crypts showing Mptx2 granules in ABX+SAL condition. Scale bars, 50 μm; 20 μm in high magnification images.
- D
Average Mptx2 fluorescent intensity per crypt was determined from 20 to 25 crypts imaged in six to eight independent fields for SPF, ABX or ABX+SAL mouse ileum (n = 3 mice per condition). One‐way ANOVA was used to compare the differences.
- E
Immunostaining of Mptx2 (green) in Salmonella (red)‐infected mouse ileum. White‐boxed areas are shown in high magnifications to reveal luminal Mptx2 and Salmonella association. Scale bars, 20 μm; 10 μm in high magnification image.
- F
Numbers of luminal Mptx2 granules were counted and compared by unpaired t‐test from five to eight independent fields of −SAL and +SAL mouse ilea (n = 3 mice per condition).
- G, H
Cecum luminal Mptx2 protein abundances were determined by dot blots in −SAL and +SAL mice (n = 3 mice per condition) and compared by t‐test in panel (H).
- I
Western blots for Mptx2 were performed using ileal tissue lysates from WT (Mptx2 +/+), heterozygous (Mptx2 +/−), and homozygous (Mptx2 −/−) mice, all of which were littermates.
- J
Immunofluorescent staining of Mptx2 (green) in WT or Mptx2 −/− mouse ileum. Scale bars, 50 μm; 10 μm in high magnification images.
- K
Hematoxylin & eosin (H & E) stained ileum, proximal and distal colons of WT or Mptx2 −/− mice were scored 0–3 for degrees of epithelial damage, leukocyte infiltration into the mucosa, submucosa, and muscularis. Each score was multiplied by 1 (focal), 2 (patchy), or 3 (diffuse), and summed to obtain a final score per mouse. t‐test was used for n = 5 mice of each genotype.
- L, M
Representative H & E stained proximal (panel L) and distal (panel M) colons of WT and Mptx2−/− mice 4 d.p.i. Scale bars, 200 μm.
- N–P
Representative immunohistochemistry for Ly6B.2 in WT and Mptx2−/− mouse distal colons 4 d.p.i. Average numbers of Ly6B.2+ cells per colonic gland were compared by t‐test from 10 fields of distal (panel O) and proximal (panel P) colons (n = 4–5 mice per genotype). Scale bars, 200 μm.
- Q, R
Mesenteric lymph node (MLN) and spleen Salmonella CFUs were counted, presented as per mg of tissue, and compared by t‐test for WT (n = 5) and Mptx2−/− (n = 4) mice 4 d.p.i.
- S–V
ELISAs were performed for MASP1 proteins in ileum (panel S) and plasma (panel T), complement C3 protein (panel U) and C5 protein (panel V) in plasma from eight to 10 WT and Mptx2−/− biological replicates. Data were analyzed by t‐test and represent mean ± SEM in two independent experiments.
References
-
- Adachi O, Kawai T, Takeda K, Matsumoto M, Tsutsui H, Sakagami M, Nakanishi K, Akira S (1998) Targeted disruption of the MyD88 gene results in loss of IL‐1‐ and IL‐18‐mediated function. Immunity 9: 143–150 - PubMed
-
- Alzoghaibi MA, Al‐Mofleh IA, Al‐Jebreen AM (2008) Neutrophil chemokines GCP‐2 and GRO‐alpha in patients with inflammatory bowel disease. J Dig Dis 9: 144–148 - PubMed
Publication types
MeSH terms
Substances
Associated data
- Actions
- Actions
Grants and funding
- R01 DK124274/DK/NIDDK NIH HHS/United States
- F31 DK121428/DK/NIDDK NIH HHS/United States
- R35 GM142702/GM/NIGMS NIH HHS/United States
- R01 DK132885/DK/NIDDK NIH HHS/United States
- R01 DK125296/DK/NIDDK NIH HHS/United States
- R01 DK102934/DK/NIDDK NIH HHS/United States
- R01 DK119198/DK/NIDDK NIH HHS/United States
- R37 CA277812/CA/NCI NIH HHS/United States
- R01 AT010243/AT/NCCIH NIH HHS/United States
- R56 AI143256/AI/NIAID NIH HHS/United States
- R21 AI167079/AI/NIAID NIH HHS/United States
- R01 DK131313/DK/NIDDK NIH HHS/United States
- R01 HL154757/HL/NHLBI NIH HHS/United States
- R01 AI143256/AI/NIAID NIH HHS/United States
- P40 OD010995/OD/NIH HHS/United States

