

Unraveling dynamically encoded latent transcriptomic patterns in pancreatic cancer cells by topic modeling
- PMID: 37719139
- PMCID: PMC10504675
- DOI: 10.1016/j.xgen.2023.100388
Unraveling dynamically encoded latent transcriptomic patterns in pancreatic cancer cells by topic modeling
Abstract
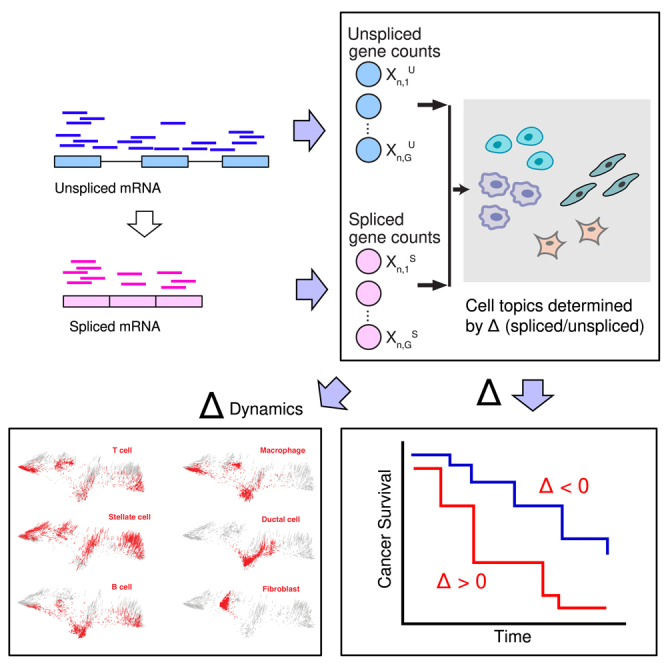
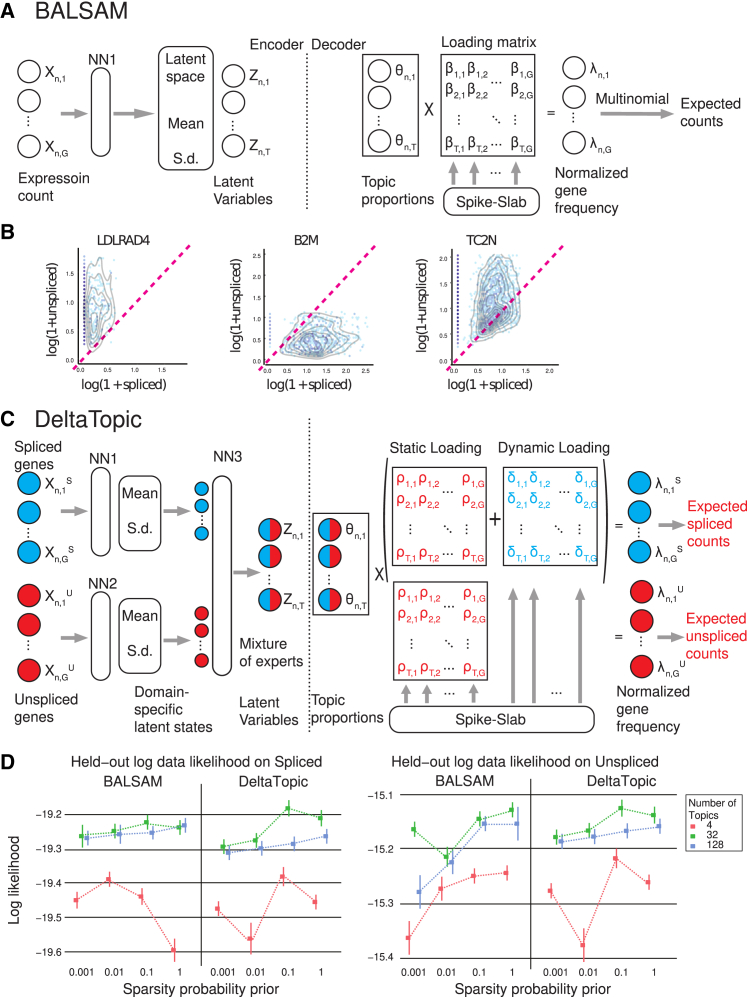
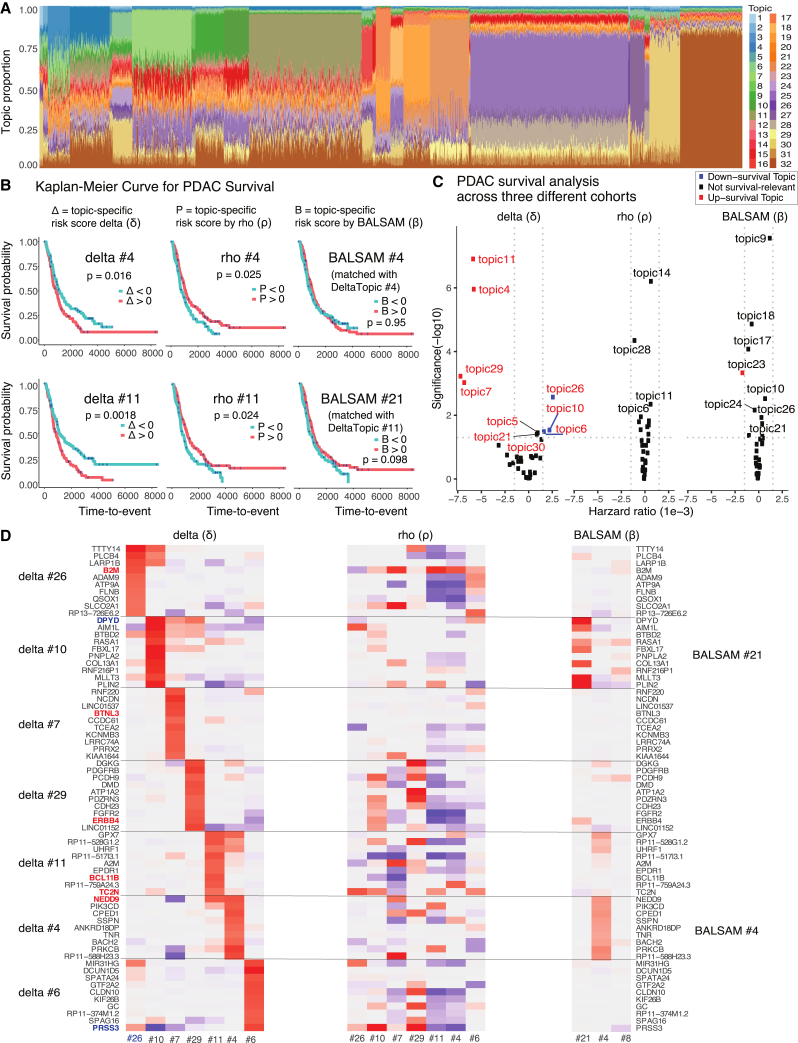
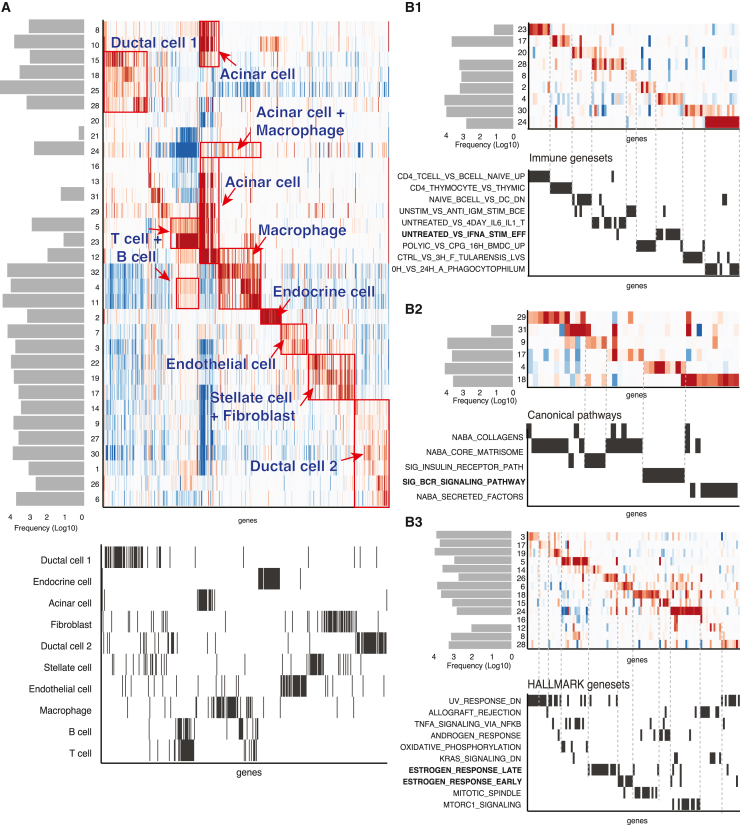
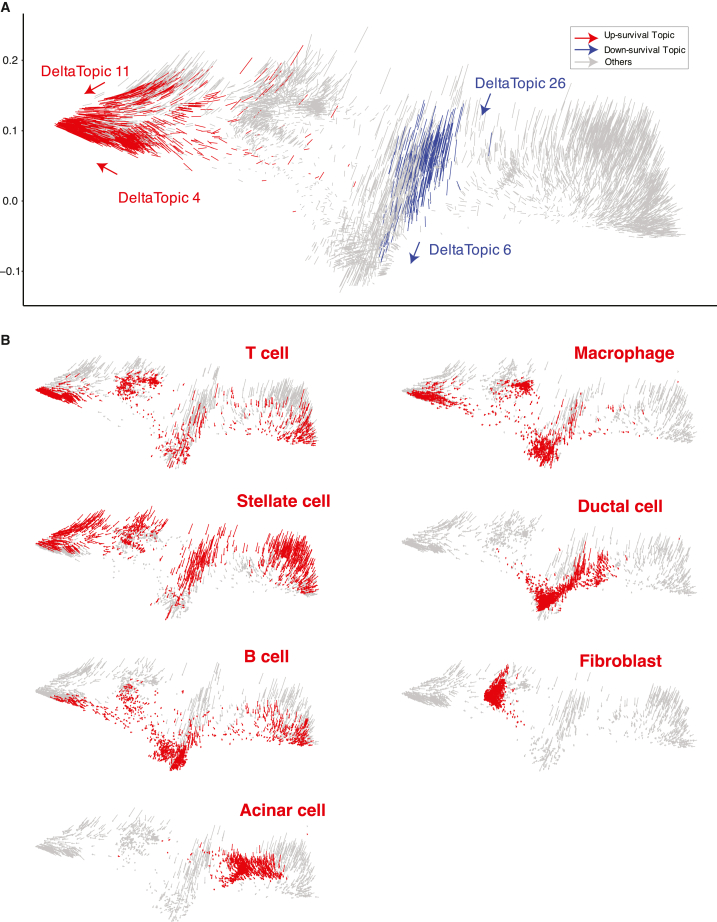
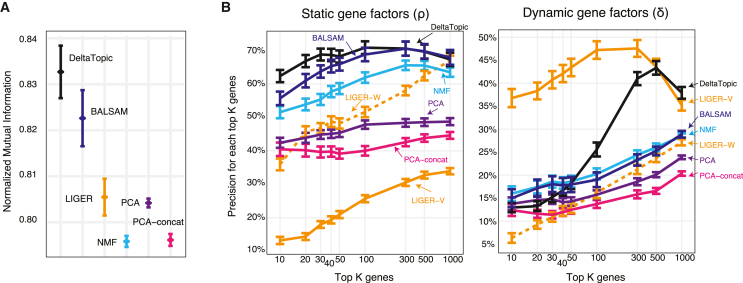
Building a comprehensive topic model has become an important research tool in single-cell genomics. With a topic model, we can decompose and ascertain distinctive cell topics shared across multiple cells, and the gene programs implicated by each topic can later serve as a predictive model in translational studies. Here, we present a Bayesian topic model that can uncover short-term RNA velocity patterns from a plethora of spliced and unspliced single-cell RNA-sequencing (RNA-seq) counts. We showed that modeling both types of RNA counts can improve robustness in statistical estimation and can reveal new aspects of dynamic changes that can be missed in static analysis. We showcase that our modeling framework can be used to identify statistically significant dynamic gene programs in pancreatic cancer data. Our results discovered that seven dynamic gene programs (topics) are highly correlated with cancer prognosis and generally enrich immune cell types and pathways.
Keywords: RNA velocity; machine learning; pancreatic cancer; pancreatic ductal adenocarcinoma; single-cell RNA-seq; topic model; variational autoencoder.
© 2023 The Author(s).
Conflict of interest statement
The authors declare no competing interests.
Figures
Similar articles
-
Single-cell RNA sequencing identifies a novel proliferation cell type affecting clinical outcome of pancreatic ductal adenocarcinoma.Front Oncol. 2023 Aug 2;13:1236435. doi: 10.3389/fonc.2023.1236435. eCollection 2023. Front Oncol. 2023. PMID: 37601684 Free PMC article.
-
Statistical inference with a manifold-constrained RNA velocity model uncovers cell cycle speed modulations.bioRxiv [Preprint]. 2024 Jan 22:2024.01.18.576093. doi: 10.1101/2024.01.18.576093. bioRxiv. 2024. Update in: Nat Methods. 2024 Dec;21(12):2271-2286. doi: 10.1038/s41592-024-02471-8. PMID: 38328127 Free PMC article. Updated. Preprint.
-
Single-cell RNA-seq highlights intra-tumoral heterogeneity and malignant progression in pancreatic ductal adenocarcinoma.Cell Res. 2019 Sep;29(9):725-738. doi: 10.1038/s41422-019-0195-y. Epub 2019 Jul 4. Cell Res. 2019. PMID: 31273297 Free PMC article.
-
Translational genomics in pancreatic ductal adenocarcinoma: A review with re-analysis of TCGA dataset.Semin Cancer Biol. 2019 Apr;55:70-77. doi: 10.1016/j.semcancer.2018.04.004. Epub 2018 Apr 26. Semin Cancer Biol. 2019. PMID: 29705685 Review.
-
Cancer biology deciphered by single-cell transcriptomic sequencing.Protein Cell. 2022 Mar;13(3):167-179. doi: 10.1007/s13238-021-00868-1. Epub 2021 Aug 17. Protein Cell. 2022. PMID: 34405376 Free PMC article. Review.
Cited by
-
Assessing the evolution of research topics in a biological field using plant science as an example.PLoS Biol. 2024 May 23;22(5):e3002612. doi: 10.1371/journal.pbio.3002612. eCollection 2024 May. PLoS Biol. 2024. PMID: 38781246 Free PMC article.
-
A scalable approach to topic modelling in single-cell data by approximate pseudobulk projection.Life Sci Alliance. 2024 Aug 6;7(10):e202402713. doi: 10.26508/lsa.202402713. Print 2024 Oct. Life Sci Alliance. 2024. PMID: 39107066 Free PMC article.
-
Exploring the latent space of transcriptomic data with topic modeling.NAR Genom Bioinform. 2025 Apr 22;7(2):lqaf049. doi: 10.1093/nargab/lqaf049. eCollection 2025 Jun. NAR Genom Bioinform. 2025. PMID: 40264683 Free PMC article.
References
-
- Bergen V., Lange M., Peidli S., Wolf F.A., Theis F.J. Generalizing RNA velocity to transient cell states through dynamical modeling. Nat. Biotechnol. 2020;38:1408–1414. - PubMed
-
- Gu Y., Blaauw D.T., Welch J. In: Proceedings of the 39th international conference on machine learning Proceedings of machine learning research. Chaudhuri K., Jegelka S., Song L., Szepesvari C., Niu G., Sabato S., editors. PMLR; 2022. Variational mixtures of ODEs for inferring cellular gene expression dynamics; pp. 7887–7901.
LinkOut - more resources
Full Text Sources
