

Promise of spatially resolved omics for tumor research
- PMID: 37719191
- PMCID: PMC10499658
- DOI: 10.1016/j.jpha.2023.07.003
Promise of spatially resolved omics for tumor research
Abstract
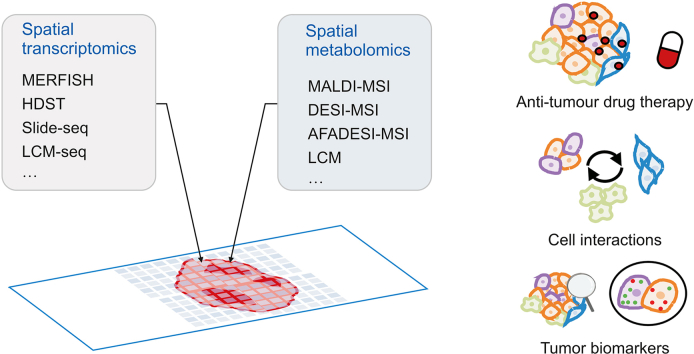
Tumors are spatially heterogeneous tissues that comprise numerous cell types with intricate structures. By interacting with the microenvironment, tumor cells undergo dynamic changes in gene expression and metabolism, resulting in spatiotemporal variations in their capacity for proliferation and metastasis. In recent years, the rapid development of histological techniques has enabled efficient and high-throughput biomolecule analysis. By preserving location information while obtaining a large number of gene and molecular data, spatially resolved metabolomics (SRM) and spatially resolved transcriptomics (SRT) approaches can offer new ideas and reliable tools for the in-depth study of tumors. This review provides a comprehensive introduction and summary of the fundamental principles and research methods used for SRM and SRT techniques, as well as a review of their applications in cancer-related fields.
Keywords: Spatially resolved metabolomics; Spatially resolved transcriptomics; Tumor.
© 2023 The Author(s).
Conflict of interest statement
The authors declare that there are no conflicts of interest.
Figures
Similar articles
-
Spatially resolved transcriptomics provide a new method for cancer research.J Exp Clin Cancer Res. 2022 May 19;41(1):179. doi: 10.1186/s13046-022-02385-3. J Exp Clin Cancer Res. 2022. PMID: 35590346 Free PMC article. Review.
-
Spatially resolved transcriptomics: advances and applications.Blood Sci. 2022 Nov 4;5(1):1-14. doi: 10.1097/BS9.0000000000000141. eCollection 2023 Jan. Blood Sci. 2022. PMID: 36742187 Free PMC article. Review.
-
Statistical and machine learning methods for spatially resolved transcriptomics with histology.Comput Struct Biotechnol J. 2021 Jul 1;19:3829-3841. doi: 10.1016/j.csbj.2021.06.052. eCollection 2021. Comput Struct Biotechnol J. 2021. PMID: 34285782 Free PMC article. Review.
-
Computational elucidation of spatial gene expression variation from spatially resolved transcriptomics data.Mol Ther Nucleic Acids. 2021 Dec 11;27:404-411. doi: 10.1016/j.omtn.2021.12.009. eCollection 2022 Mar 8. Mol Ther Nucleic Acids. 2021. PMID: 35036053 Free PMC article. Review.
-
Spatially resolved transcriptomics and its applications in cancer.Curr Opin Genet Dev. 2021 Feb;66:70-77. doi: 10.1016/j.gde.2020.12.002. Epub 2021 Jan 9. Curr Opin Genet Dev. 2021. PMID: 33434721 Free PMC article. Review.
Cited by
-
Spatial metabolomics reveal metabolic alternations in the injured mice kidneys induced by triclocarban treatment.J Pharm Anal. 2024 Nov;14(11):101024. doi: 10.1016/j.jpha.2024.101024. Epub 2024 Jun 26. J Pharm Anal. 2024. PMID: 39717194 Free PMC article.
-
A pan-cancer analysis of the oncogenic role of N-acetyltransferase 8 like in human cancer.Discov Oncol. 2024 Dec 18;15(1):792. doi: 10.1007/s12672-024-01605-w. Discov Oncol. 2024. PMID: 39692770 Free PMC article.
-
Spatial metabolomics highlights metabolic reprogramming in acute myeloid leukemia mice through creatine pathway.Acta Pharm Sin B. 2024 Oct;14(10):4461-4477. doi: 10.1016/j.apsb.2024.07.004. Epub 2024 Jul 6. Acta Pharm Sin B. 2024. PMID: 39525575 Free PMC article.
-
Spatially resolved metabolomics visualizes heterogeneous distribution of metabolites in lung tissue and the anti-pulmonary fibrosis effect of Prismatomeris connate extract.J Pharm Anal. 2024 Sep;14(9):100971. doi: 10.1016/j.jpha.2024.100971. Epub 2024 Mar 27. J Pharm Anal. 2024. PMID: 39381647 Free PMC article.
-
[Research progress of deep learning applications in mass spectrometry imaging data analysis].Se Pu. 2024 Jul;42(7):669-680. doi: 10.3724/SP.J.1123.2023.10035. Se Pu. 2024. PMID: 38966975 Free PMC article. Review. Chinese.
References
Publication types
LinkOut - more resources
Full Text Sources
