

Ultrasensitive proteomics depicted an in-depth landscape for the very early stage of mouse maternal-to-zygotic transition
- PMID: 37719194
- PMCID: PMC10499587
- DOI: 10.1016/j.jpha.2023.05.003
Ultrasensitive proteomics depicted an in-depth landscape for the very early stage of mouse maternal-to-zygotic transition
Abstract
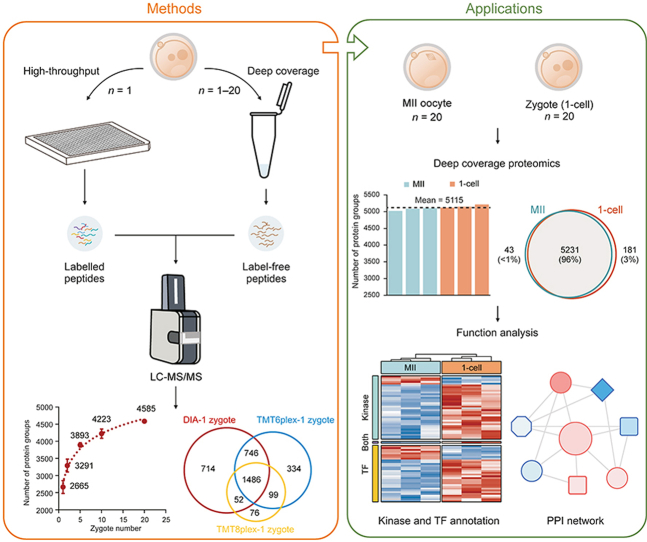
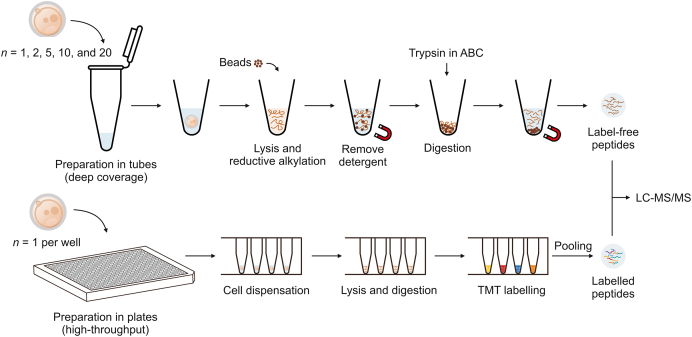
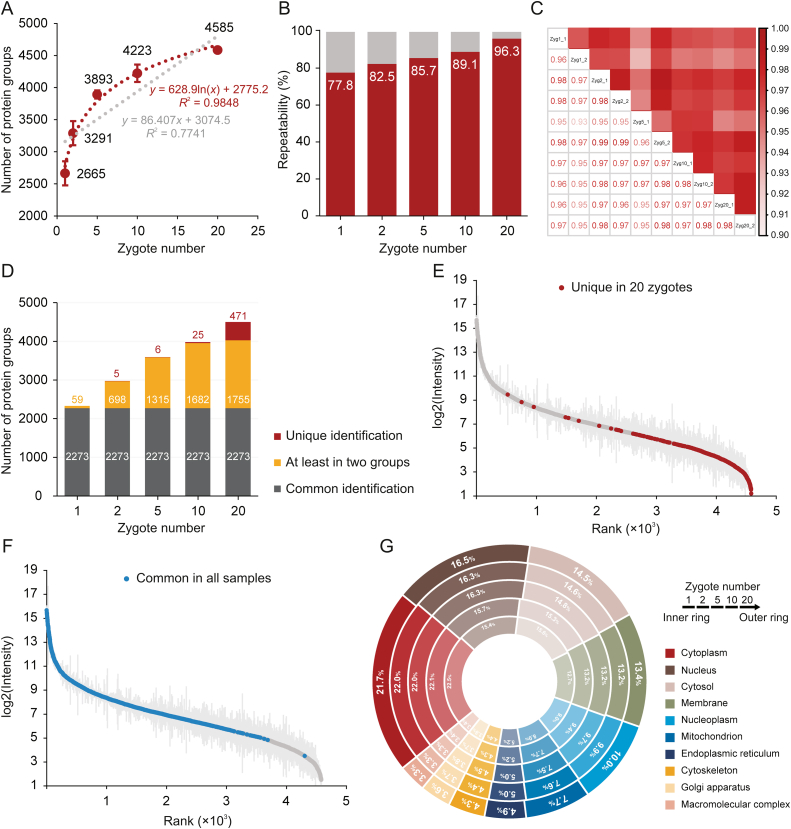
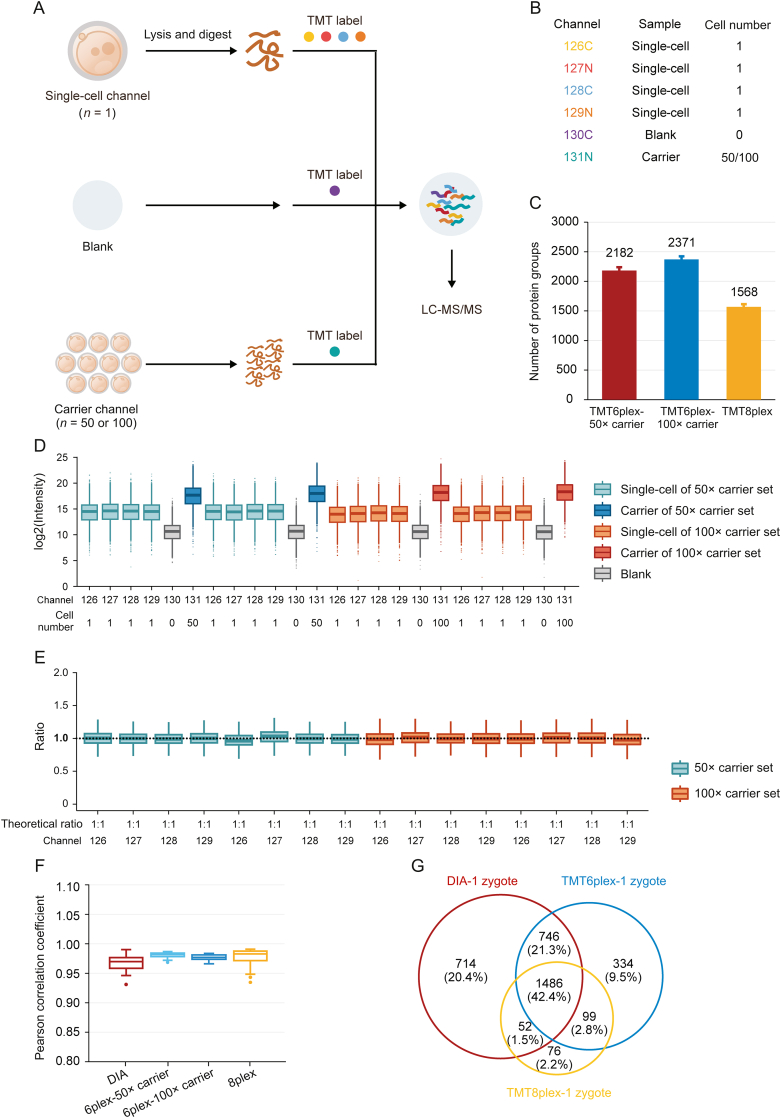
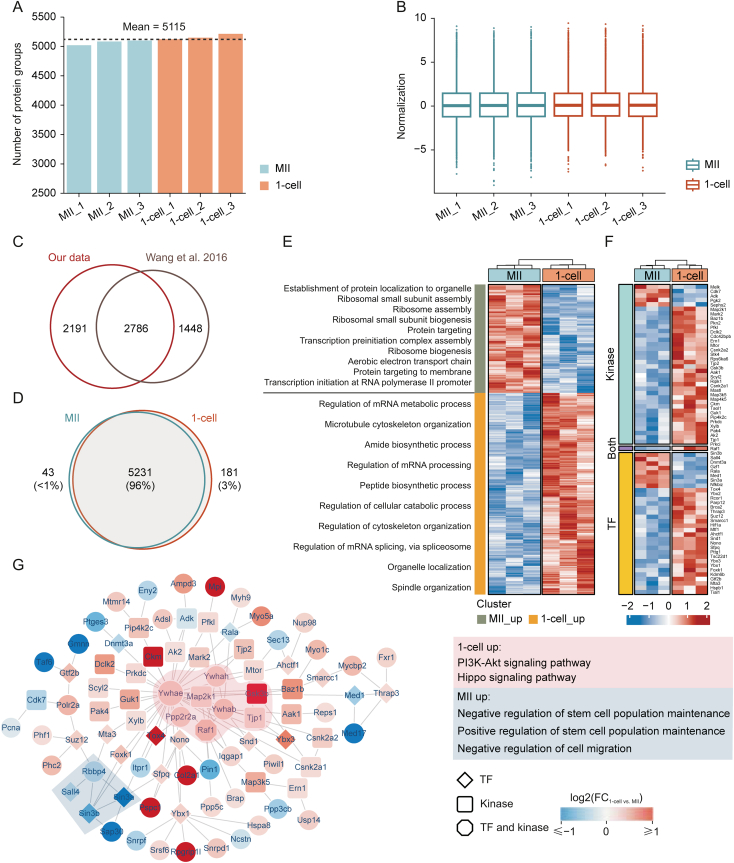
Single-cell or low-input multi-omics techniques have revolutionized the study of pre-implantation embryo development. However, the single-cell or low-input proteomic research in this field is relatively underdeveloped because of the higher threshold of the starting material for mammalian embryo samples and the lack of hypersensitive proteome technology. In this study, a comprehensive solution of ultrasensitive proteome technology (CS-UPT) was developed for single-cell or low-input mouse oocyte/embryo samples. The deep coverage and high-throughput routes significantly reduced the starting material and were selected by investigators based on their demands. Using the deep coverage route, we provided the first large-scale snapshot of the very early stage of mouse maternal-to-zygotic transition, including almost 5,500 protein groups from 20 mouse oocytes or zygotes for each sample. Moreover, significant protein regulatory networks centered on transcription factors and kinases between the MII oocyte and 1-cell embryo provided rich insights into minor zygotic genome activation.
Keywords: Embryo; Low-input proteomics; Maternal-to-zygotic transition; Oocyte; Single-cell proteomics.
© 2023 The Authors.
Conflict of interest statement
Yi Shen, Junfeng Zhang, Huiping Zhang, and Ziyi Li are employees of Shanghai Applied Protein Technology Co., Ltd. (Shanghai, China). The authors declare that there are no conflicts of interest.
Figures
Similar articles
-
Postovulatory aging affects dynamics of mRNA, expression and localization of maternal effect proteins, spindle integrity and pericentromeric proteins in mouse oocytes.Hum Reprod. 2016 Jan;31(1):133-49. doi: 10.1093/humrep/dev279. Epub 2015 Nov 17. Hum Reprod. 2016. PMID: 26577303 Free PMC article.
-
Germ cell-specific eIF4E1b regulates maternal mRNA translation to ensure zygotic genome activation.Genes Dev. 2023 May 1;37(9-10):418-431. doi: 10.1101/gad.350400.123. Epub 2023 May 31. Genes Dev. 2023. PMID: 37257918 Free PMC article.
-
Stable maternal proteins underlie distinct transcriptome, translatome, and proteome reprogramming during mouse oocyte-to-embryo transition.Genome Biol. 2023 Jul 13;24(1):166. doi: 10.1186/s13059-023-02997-8. Genome Biol. 2023. PMID: 37443062 Free PMC article.
-
Epigenetic reprogramming during the maternal-to-zygotic transition.MedComm (2020). 2023 Aug 2;4(4):e331. doi: 10.1002/mco2.331. eCollection 2023 Aug. MedComm (2020). 2023. PMID: 37547174 Free PMC article. Review.
-
A Maternal Functional Module in the Mammalian Oocyte-To-Embryo Transition.Trends Mol Med. 2017 Nov;23(11):1014-1023. doi: 10.1016/j.molmed.2017.09.004. Epub 2017 Oct 6. Trends Mol Med. 2017. PMID: 28993030 Review.
Cited by
-
Trends in Mass Spectrometry-Based Single-Cell Proteomics.Anal Chem. 2025 Mar 25;97(11):5893-5907. doi: 10.1021/acs.analchem.5c00661. Epub 2025 Mar 16. Anal Chem. 2025. PMID: 40091206 Review. No abstract available.
-
Application of genome tagging technology in elucidating the function of sperm-specific protein 411 (Ssp411).Asian J Androl. 2025 Jan 1;27(1):120-128. doi: 10.4103/aja202442. Epub 2024 Aug 2. Asian J Androl. 2025. PMID: 39091129 Free PMC article.
-
An accessible workflow for high-sensitivity proteomics using parallel accumulation-serial fragmentation (PASEF).Nat Protoc. 2025 Jun;20(6):1700-1729. doi: 10.1038/s41596-024-01104-w. Epub 2025 Jan 17. Nat Protoc. 2025. PMID: 39825144 Review.
-
Reading and writing of mRNA m6A modification orchestrate maternal-to-zygotic transition in mice.Genome Biol. 2023 Apr 6;24(1):67. doi: 10.1186/s13059-023-02918-9. Genome Biol. 2023. PMID: 37024923 Free PMC article.
-
Integrated 4D label-free proteome and SUMOylated proteome in glioma uncover novel pathological mechanisms and pave the way for precision therapy.Cell Insight. 2025 May 19;4(4):100253. doi: 10.1016/j.cellin.2025.100253. eCollection 2025 Aug. Cell Insight. 2025. PMID: 40606841 Free PMC article.
References
-
- Cha K.Y., Chian R.C. Maturation in vitro of immature human oocytes for clinical use. Hum. Reprod. Update. 1998;4:103–120. - PubMed
-
- WormBook Control of oocyte meiotic maturation and fertilization. http://www.wormbook.org/chapters/www_controloocytematuration/controloocy... - PMC - PubMed
-
- Eckersley-Maslin M.A., Alda-Catalinas C., Reik W. Dynamics of the epigenetic landscape during the maternal-to-zygotic transition. Nat. Rev. Mol. Cell Biol. 2018;19:436–450. - PubMed
LinkOut - more resources
Full Text Sources
