. 2023 Sep;13(9):3876-3891.
doi: 10.1016/j.apsb.2023.02.012. Epub 2023 Feb 24.

Disease-specific protein corona formed in pathological intestine enhances the oral absorption of nanoparticles

Affiliations

Disease-specific protein corona formed in pathological intestine enhances the oral absorption of nanoparticles

Jiawei Wu et al. Acta Pharm Sin B. 2023 Sep.

Abstract

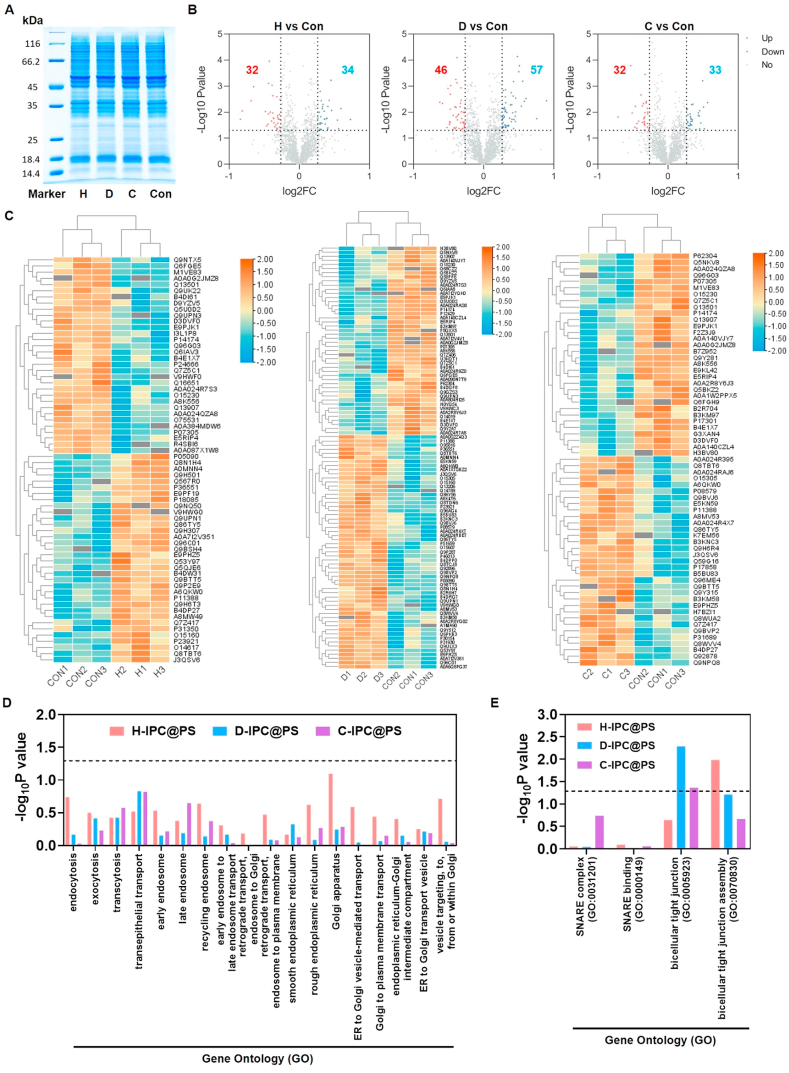
Protein corona (PC) has been identified to impede the transportation of intravenously injected nanoparticles (NPs) from blood circulation to their targeted sites. However, how intestinal PC (IPC) affects the delivery of orally administered NPs are still needed to be elucidated. Here, we found that IPC exerted "positive effect" or "negative effect" depending on different pathological conditions in the gastrointestinal tract. We prepared polystyrene nanoparticles (PS) adsorbed with different IPC derived from the intestinal tract of healthy, diabetic, and colitis rats (H-IPC@PS, D-IPC@PS, C-IPC@PS). Proteomics analysis revealed that, compared with healthy IPC, the two disease-specific IPC consisted of a higher proportion of proteins that were closely correlated with transepithelial transport across the intestine. Consequently, both D-IPC@PS and C-IPC@PS mainly exploited the recycling endosome and ER-Golgi mediated secretory routes for intracellular trafficking, which increased the transcytosis from the epithelium. Together, disease-specific IPC endowed NPs with higher intestinal absorption. D-IPC@PS posed "positive effect" on intestinal absorption into blood circulation for diabetic therapy. Conversely, C-IPC@PS had "negative effect" on colitis treatment because of unfavorable absorption in the intestine before arriving colon. These results imply that different or even opposite strategies to modulate the disease-specific IPC need to be adopted for oral nanomedicine in the treatment of variable diseases.

Keywords: Disease-specific; Intestinal absorption; Intestinal protein corona; Intracellular trafficking; Oral nanoparticles; Pathological intestine; Proteomics analysis; Transepithelial transport.


Conflict of interest statement

The authors declare no conflicts of interest.

Figures

Image 1
Graphical abstract
Figure 1
Figure 1
The intestinal protein corona adsorbed nanoparticles (IPC@PS). (A) Schematic diagram of experimental procedure in this study. (B) Measurement of protein content for three extracted intestinal fluids. (n = 3). ∗∗∗P < 0.001 vs. Health. (C) Particle size and (D) PDI change of PS in simulated gastric fluid (SGF) and simulated intestinal fluid (SIF) (n = 3). (E) Size and zeta potential of PS and three IPC@PS (n = 3). ∗P < 0.05, ∗∗P < 0.01 vs. PS. (F) Quantitative measurement of protein corona on three IPC@PS (n = 3). ∗P < 0.05 vs. H-IPC@PS. (G) Representative TEM images of PS and three IPC@PS. Scale bar = 50 nm. All data are presented as mean ± SD.
Figure 2
Figure 2
Proteomic analysis of healthy, diabetic and colitis IPC by label-free quantification (LFQ) method via LC‒MS/MS (n = 3). (A) Silver staining of SDS-PAGE gel image for three kinds of IPC. (B) Pie chart of the distribution of protein molecular weight (MW) for identified proteins in three IPC. (C) The total protein number of three IPC identified by LC‒MS/MS. (D) Venn diagram of protein number identified for H-IPC with D-IPC and C-IPC, respectively. (E) Heatmap data visualization of the top 20 identified proteins with high abundance in D-IPC or C-IPC compared with H-IPC, separately. (F) Volcano plot of up-regulation or down-regulation of differentiated proteins for D-IPC or C-IPC compared with H-IPC. (G) Venn diagrams of identified protein number for D-IPC or C-IPC compared with H-IPC respectively. All data are presented as mean ± SD.
Figure 3
Figure 3
The intestinal absorption in vitro and in vivo. (A) Schematic diagram of transcytosis study. (B) The Papp value of transepithelial transport study on Caco-2 cell monolayers (n = 3). ∗P < 0.05, ∗∗P < 0.01 vs. PS. ns, not significant. ##P < 0.01,###P < 0.001 vs. H-IPC@PS. (C) Relative transcytosis ratio after the treatment of PS and three IPC@PS for 6 h on Caco-2 monolayers (n = 3). ∗∗P < 0.01 vs. PS. ns, not significant. (D) The change of TEER value for Caco-2 cell monolayers after treatment with PS and three IPC@PS (n = 5). (E) The influence of PS and IPC@PS on the tight junction of Caco-2 cells. Claudin-1 stained for green. Cell nucleus stained for blue. Scale bar = 10 μm. Intracellular ROS level (F) and calcium (Ca2+) level (G) of Caco-2 cells after treatment with PS and three IPC@PS (n = 3). ∗P < 0.05, ∗∗∗P < 0.001 vs. control. ns, not significant. ###P < 0.001 vs. PS. (H) In situ intestinal absorption study. Representative CLSM images of intestinal villi (duodenum, jejunum and ileum) after administration of PS (red) in SD rats. Cell nucleus stained with DAPI (blue). Scale bar = 20 μm. (I) Pharmacokinetic study of PS after oral administration on healthy, diabetic and colitis SD rats (n = 6). ∗P < 0.05, Health vs. Diabetes. #P < 0.05,##P < 0.01, Health vs. Colitis. AUC (area under the curve of plasma PS concentration) calculated based on the oral pharmacokinetic curve (n = 6). ∗P < 0.01, ∗∗P < 0.05 vs. Health. (J) Schematic diagram of intestinal permeability investigation ex vivo. (K) Cumulative transported curve of PS across duodenum, jejunum and ileum from healthy, diabetic or colitis rats (n = 5). (L) Calculated Papp values of PS across duodenum, jejunum and ileum from healthy, diabetic or colitis rats (n = 5). ns, not significant vs. Health. All data are presented as mean ± SD.
Figure 4
Figure 4
The endocytosis, exocytosis and intracellular transport of IPC@PS. (A) Cell viability of PS and three IPC@PS on Caco-2 cells (n = 3). (B) Cell uptake of PS and three IPC@PS on Caco-2 cells measured by flow cytometry (n = 3). ∗P < 0.05, ∗∗P < 0.01 vs. PS. (C) Fluorescence recovery after photobleaching (FRAP) assay of PS and three IPC@PS on Caco-2 cells measured by CLSM. (D) Representing images of fluorescence recovery recorded from 0 to 65.2 s. (E) Schematic diagram of exocytosis study including bidirectional transport. (F) The apical and basolateral exocytosis rate of PS and three IPC@PS on Caco-2 cell monolayers (n = 3). ∗P < 0.05, ∗∗P < 0.01, ∗∗∗P < 0.001 vs. PS. ns, not significant. #P < 0.05,##P < 0.01 vs. H-IPC@PS. (G) The relative basolateral exocytosis rate (n = 3). ∗∗P < 0.01 vs. PS. ns, not significant. #P < 0.05,##P < 0.01 vs. H-IPC@PS. (H) 3D-CLSM images of PS and three IPC@PS on Caco-2 cell monolayers during exocytosis study. Red for NPs, blue for cell nucleus. Representative CLSM images and corresponding colocalization efficiency of PS and three IPC@PS with transported vesicles and subcellular organelles including early endosomes (I and J), recycling endosomes (K and L), endoplasmic reticulum (M and N) and Golgi apparatus (O and P) analyzed by CLSM. Red for NPs, green for subcellular organelles, blue for cell nucleus. Scale bar = 5 μm ∗P < 0.05, ∗∗P < 0.01, ∗∗∗P < 0.001 vs. PS. ###P < 0.001 vs. H-IPC@PS. ns, not significant. All data are presented as mean ± SD.
Figure 5
Figure 5
The correlation between the biological functions of IPC with the intestinal absorption process (endocytosis, intracellular trafficking, exocytosis and transcytosis). (A) The ratio of D-IPC@PS to H-IPC@PS and C-IPC@PS to H-IPC@PS based on the quantitative data of Endo (endocytosis), A-Exo (apical exocytosis), B-Exo (basolateral exocytosis), Trans (transcytosis), and colocalization efficiency (Col) with EE (early endosomes), LE (late endosomes), RE (recycling endosomes), Lyso (lysosomes), ER, Golgi on Caco-2 cells. ∗P < 0.05, ∗∗P < 0.01, ∗∗∗P < 0.001 vs. H-IPC@PS. (B–F) The variation of protein content with different biological functions based on the classifications of biological process (BP) and cellular component (CC) in gene ontology (GO) (n = 3). ∗P < 0.05, ∗∗P < 0.01, ∗∗∗P < 0.001 vs. H-IPC. (G) Heat map analysis on the representative proteins in transport-related classifications for H-IPC, D-IPC and C-IPC. Three repetition detections in parallel for each group. (H–J) The variation of protein content with biological functions involved with ROS and calcium ion in GO analysis (n = 3). (K) The influence of VAMP8 in IPC on the endocytosis and exocytosis of NPs (n = 3). PS and IPC@PS were pre-blocked with (+) or without (−) anti-VAMP8 antibody. Representative CLSM images and corresponding colocalization efficiency of Golgi (L) and Recycling endosome (M) with D-IPC@PS and C-IPC@PS pre-blocked with anti-VAMP8 antibody (+). Data of colocalization efficiency for D-IPC@PS (−) and C-IPC@PS (−) groups derived from Fig. 4K and O. ∗P < 0.05, ∗∗P < 0.01, ∗∗∗P < 0.001 vs. without (−) anti-VAMP8 antibody group. All data are presented as mean ± SD.
Figure 6
Figure 6
Cellular response induced by the IPC@PS measured via LFQ method based on LC‒MS/MS. (A) SDS-page image of Caco-2 cell proteins after different IPC@PS treatment. H, D and C for the H-IPC@PS, D-IPC@PS and C-IPC@PS groups respectively, and Con for the control group. (B) Volcano plot for up-regulation (blue) or down-regulation (red) of cellular proteins after different IPC@PS treatment. (C) Heatmap and clustering analysis of cellular proteins after different IPC@PS treatment (n = 3). (D) Cellular response related to the transepithelial transport terms and pathways in the gene ontology (GO) after treatment of different IPC@PS. (E) Cellular response related to other terms and signaling pathways in the gene ontology (GO).
Figure 7
Figure 7
Schematic illustration for the enhanced effect and mechanism of disease-specific IPC on the oral absorption of NPs. The transepithelial transport related proteins up-regulated within two disease-specific IPC compared with H-IPC, which improved the basolateral exocytosis of D-IPC@PS and C-IPC@PS by exploiting the secretory pathways (EE-RE, ER-Golgi). Consequently, the disease-specific IPC endowed NPs with enhanced oral absorption than healthy IPC.

Similar articles

Cited by

References

    1. Zhu Q., Chen Z., Paul P.K., Lu Y., Wu W., Qi J.P. Oral delivery of proteins and peptides: challenges, status quo and future perspectives. Acta Pharm Sin B. 2021;11:2416–2448. - PMC - PubMed
    1. Okeyo P.O., Rajendran S.T., Zór K., Boisen A. Sensing technologies and experimental platforms for the characterization of advanced oral drug delivery systems. Adv Drug Deliv Rev. 2021;176 - PubMed
    1. Parodi A., Buzaeva P., Nigovora D., Baldin A., Kostyushev D., Chulanov V., et al. Nanomedicine for increasing the oral bioavailability of cancer treatments. J Nanobiotechnol. 2021;19:1–19. - PMC - PubMed
    1. Moss D.M., Curley P., Kinvig H., Hoskins C., Owen A. The biological challenges and pharmacological opportunities of orally administered nanomedicine delivery. Expet Rev Gastroenterol Hepatol. 2018;12:223–236. - PubMed
    1. Tang Y., Gao J., Wang T., Zhang Q., Wang A.T., Huang M., et al. The effect of drug loading and multiple administration on the protein corona formation and brain delivery property of PEG-PLA nanoparticles. Acta Pharm Sin B. 2022;12:2043–2056. - PMC - PubMed

LinkOut - more resources