

Hepatic retinaldehyde deficiency is involved in diabetes deterioration by enhancing PCK1- and G6PC-mediated gluconeogenesis
- PMID: 37719384
- PMCID: PMC10501888
- DOI: 10.1016/j.apsb.2023.06.014
Hepatic retinaldehyde deficiency is involved in diabetes deterioration by enhancing PCK1- and G6PC-mediated gluconeogenesis
Abstract
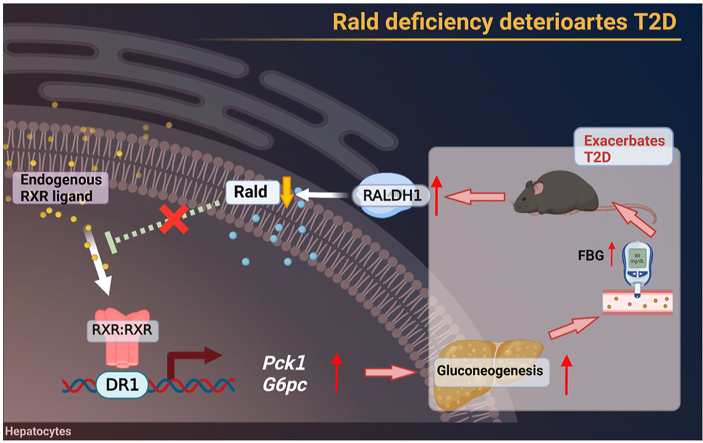
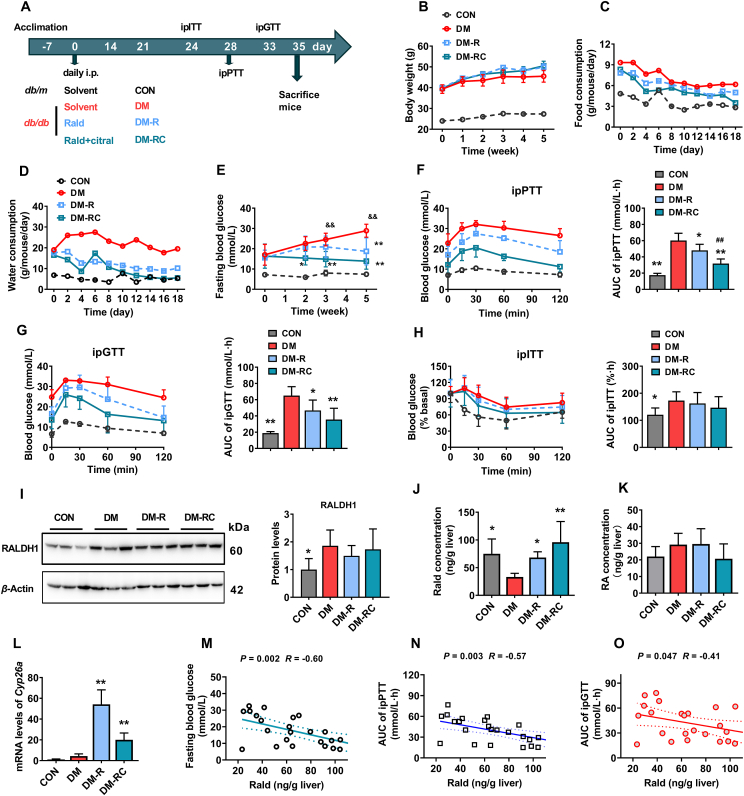
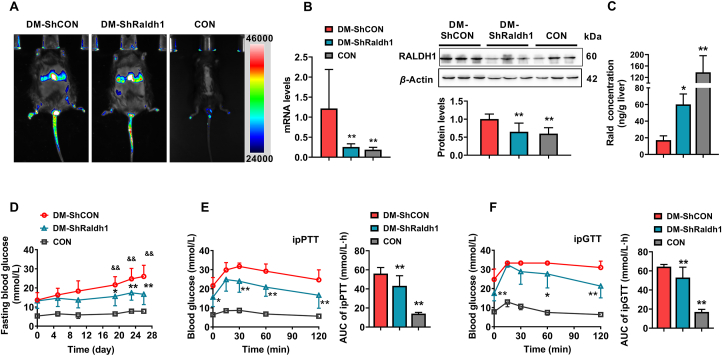
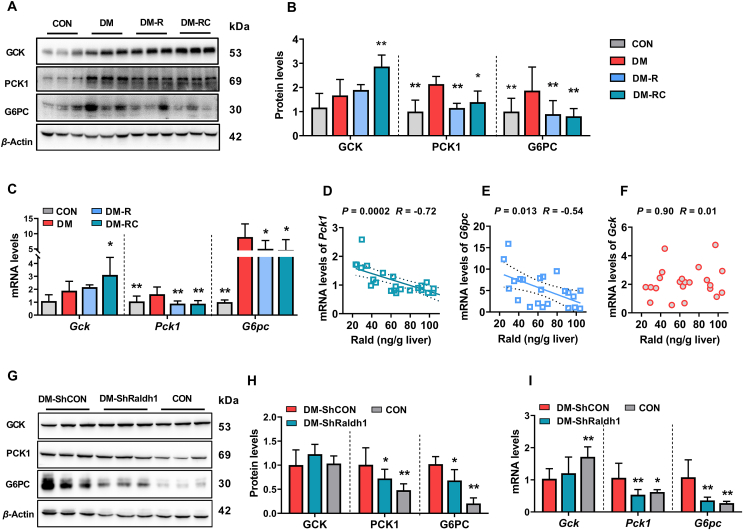
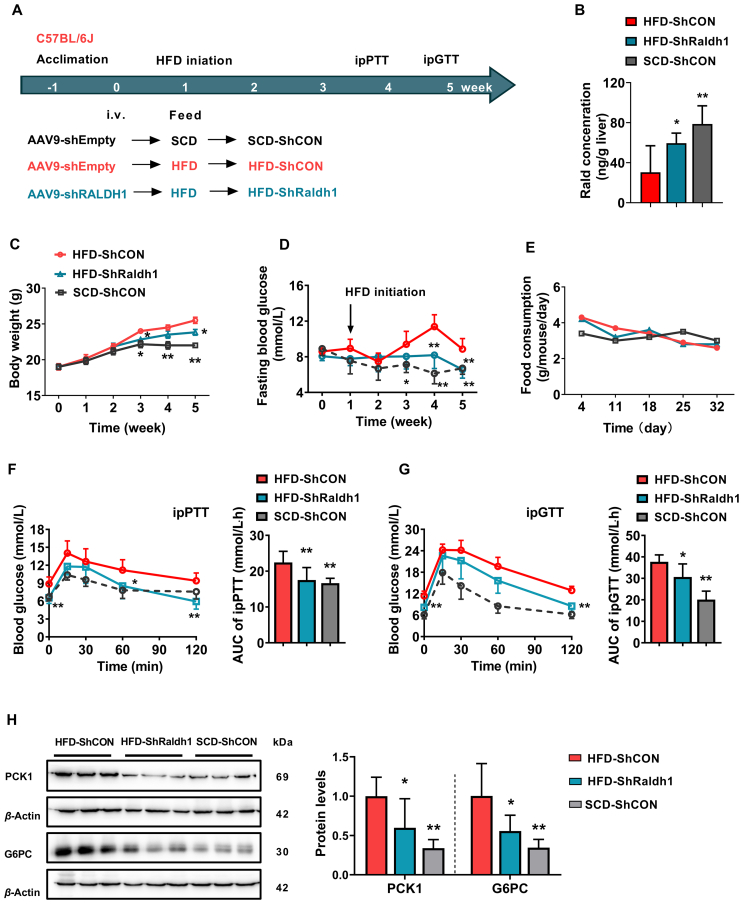
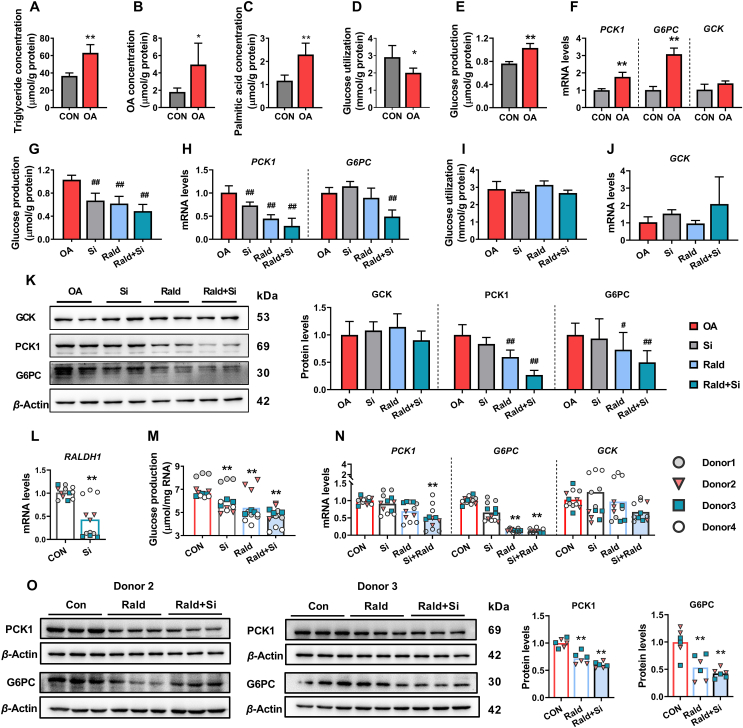
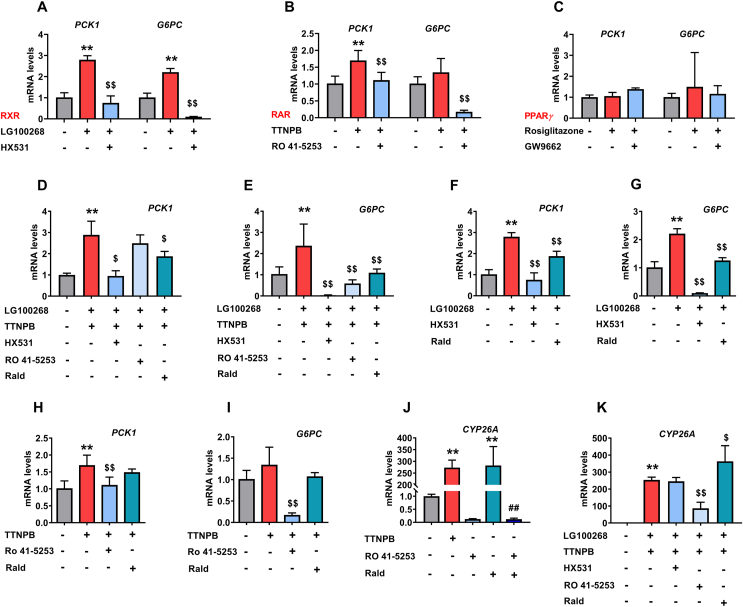
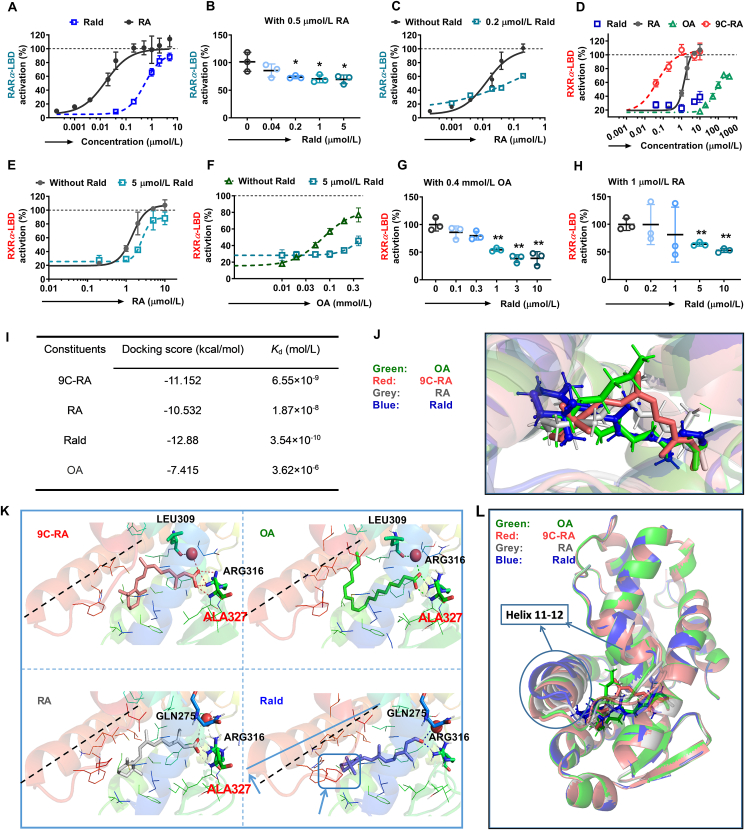
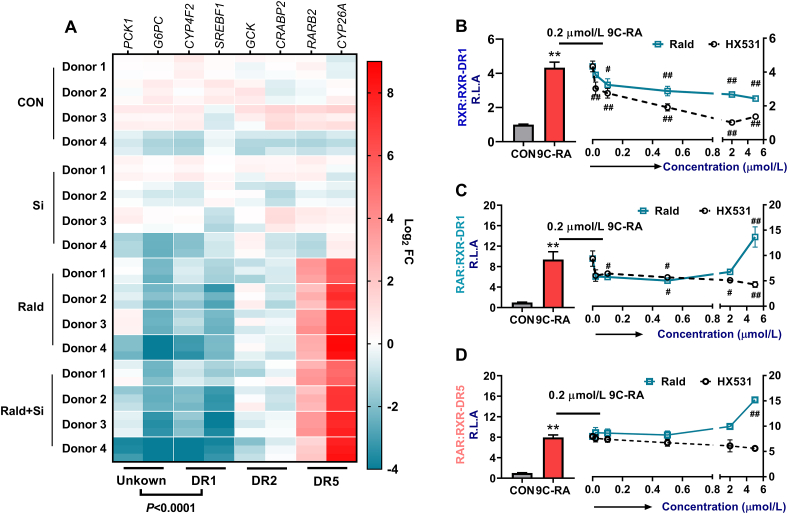
Type 2 diabetes (T2D) is often accompanied with an induction of retinaldehyde dehydrogenase 1 (RALDH1 or ALDH1A1) expression and a consequent decrease in hepatic retinaldehyde (Rald) levels. However, the role of hepatic Rald deficiency in T2D progression remains unclear. In this study, we demonstrated that reversing T2D-mediated hepatic Rald deficiency by Rald or citral treatments, or liver-specific Raldh1 silencing substantially lowered fasting glycemia levels, inhibited hepatic glucogenesis, and downregulated phosphoenolpyruvate carboxykinase 1 (PCK1) and glucose-6-phosphatase (G6PC) expression in diabetic db/db mice. Fasting glycemia and Pck1/G6pc mRNA expression levels were strongly negatively correlated with hepatic Rald levels, indicating the involvement of hepatic Rald depletion in T2D deterioration. A similar result that liver-specific Raldh1 silencing improved glucose metabolism was also observed in high-fat diet-fed mice. In primary human hepatocytes and oleic acid-treated HepG2 cells, Rald or Rald + RALDH1 silencing resulted in decreased glucose production and downregulated PCK1/G6PC mRNA and protein expression. Mechanistically, Rald downregulated direct repeat 1-mediated PCK1 and G6PC expression by antagonizing retinoid X receptor α, as confirmed by luciferase reporter assays and molecular docking. These results highlight the link between hepatic Rald deficiency, glucose dyshomeostasis, and the progression of T2D, whilst also suggesting RALDH1 as a potential therapeutic target for T2D.
Keywords: Gluconeogenesis; Glucose-6-phosphatase; Oleic acid; Phosphoenolpyruvate carboxykinase 1; Retinaldehyde; Retinaldehyde dehydrogenase 1; Retinoid X receptor; Type 2 diabetes.
© 2023 Chinese Pharmaceutical Association and Institute of Materia Medica, Chinese Academy of Medical Sciences. Production and hosting by Elsevier B.V.
Conflict of interest statement
The authors declare no conflicts of interest.
Figures
Similar articles
-
Contribution of Hepatic Retinaldehyde Dehydrogenase Induction to Impairment of Glucose Metabolism by High-Fat-Diet Feeding in C57BL/6J Mice.Basic Clin Pharmacol Toxicol. 2018 Nov;123(5):539-548. doi: 10.1111/bcpt.13039. Epub 2018 Jun 27. Basic Clin Pharmacol Toxicol. 2018. PMID: 29753302
-
Regulation of hepatic gluconeogenesis by nuclear factor Y transcription factor in mice.J Biol Chem. 2018 May 18;293(20):7894-7904. doi: 10.1074/jbc.RA117.000508. Epub 2018 Mar 12. J Biol Chem. 2018. PMID: 29530977 Free PMC article.
-
Toll-like receptor 4 signaling is required for induction of gluconeogenic gene expression by palmitate in human hepatic carcinoma cells.J Nutr Biochem. 2013 Aug;24(8):1499-507. doi: 10.1016/j.jnutbio.2012.12.009. Epub 2013 Mar 1. J Nutr Biochem. 2013. PMID: 23465595 Free PMC article.
-
The neglected PCK1/glucagon (inter)action in nutrient homeostasis beyond gluconeogenesis: Disease pathogenesis and treatment.Mol Metab. 2025 Apr;94:102112. doi: 10.1016/j.molmet.2025.102112. Epub 2025 Feb 13. Mol Metab. 2025. PMID: 39954782 Free PMC article. Review.
-
Retinoid metabolism and nuclear receptor responses: New insights into coordinated regulation of the PPAR-RXR complex.FEBS Lett. 2008 Jan 9;582(1):32-8. doi: 10.1016/j.febslet.2007.11.081. Epub 2007 Dec 7. FEBS Lett. 2008. PMID: 18068127 Review.
Cited by
-
Thioacetamide-Induced Acute Liver Injury Increases Metformin Plasma Exposure by Downregulating Renal OCT2 and MATE1 Expression and Function.Biomedicines. 2023 Dec 15;11(12):3314. doi: 10.3390/biomedicines11123314. Biomedicines. 2023. PMID: 38137535 Free PMC article.
-
Clozapine impaired glucose-stimulated insulin secretion partly by increasing plasma 5-HT levels due to the inhibition of OCT1-mediated hepatic 5-HT uptake in mice.Acta Pharmacol Sin. 2025 Mar;46(3):687-701. doi: 10.1038/s41401-024-01401-w. Epub 2024 Oct 29. Acta Pharmacol Sin. 2025. PMID: 39472495
-
Plantaginis Semen Ameliorates Hyperuricemia Induced by Potassium Oxonate.Int J Mol Sci. 2024 Aug 5;25(15):8548. doi: 10.3390/ijms25158548. Int J Mol Sci. 2024. PMID: 39126116 Free PMC article.
-
Bile duct ligation elevates 5-HT levels in cerebral cortex of rats partly due to impairment of brain UGT1A6 expression and activity via ammonia accumulation.Redox Biol. 2024 Feb;69:103019. doi: 10.1016/j.redox.2023.103019. Epub 2023 Dec 28. Redox Biol. 2024. PMID: 38163420 Free PMC article.
-
Camel milk exosomes regulate glucose metabolism by inhibiting mitochondrial complex I in hepatocytes.BMC Vet Res. 2025 Feb 22;21(1):85. doi: 10.1186/s12917-025-04555-9. BMC Vet Res. 2025. PMID: 39987092 Free PMC article.
References
-
- Iqbal S., Naseem I. Role of vitamin A in type 2 diabetes mellitus biology: effects of intervention therapy in a deficient state. Nutrition. 2015;31:901–907. - PubMed
LinkOut - more resources
Full Text Sources
Miscellaneous
