. 2023 Aug 30:14:1246910.
doi: 10.3389/fphys.2023.1246910. eCollection 2023.

Mechanical stimuli such as shear stress and piezo1 stimulation generate red blood cell extracellular vesicles

Affiliations

Mechanical stimuli such as shear stress and piezo1 stimulation generate red blood cell extracellular vesicles

Gurneet S Sangha et al. Front Physiol. .

Abstract

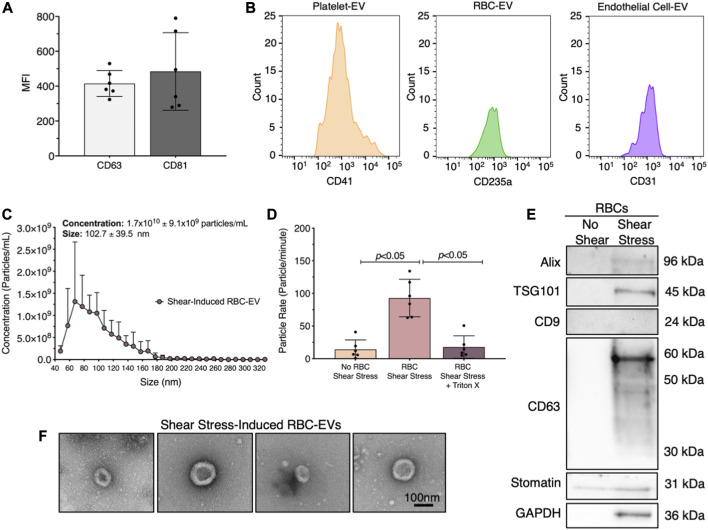
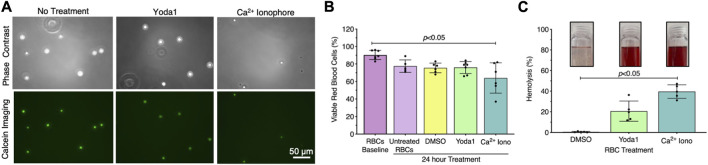
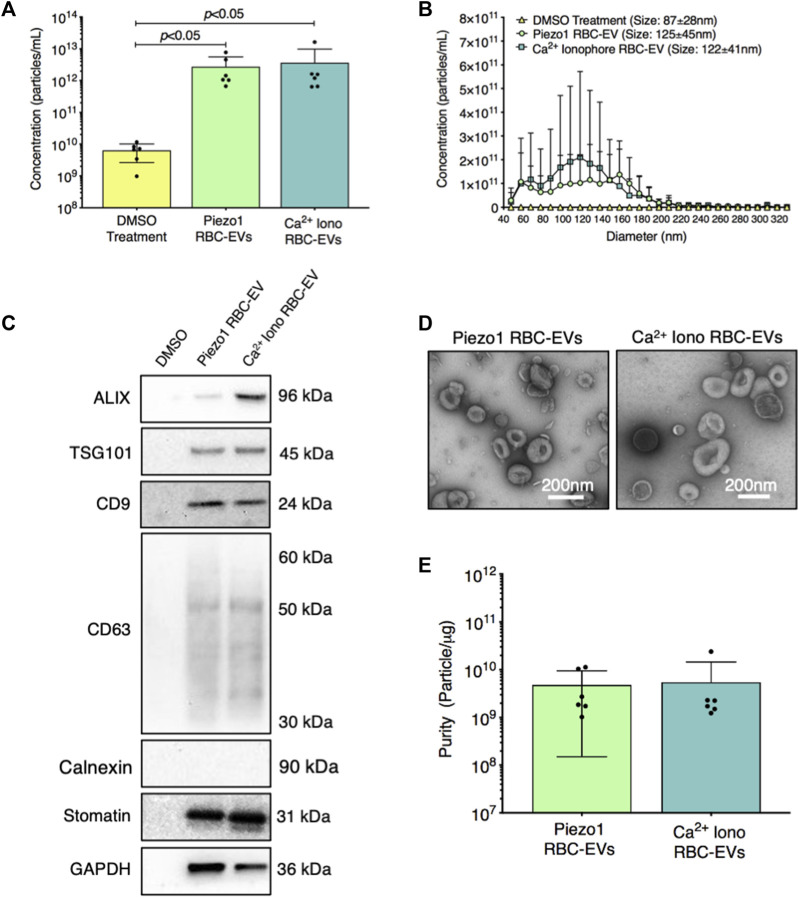
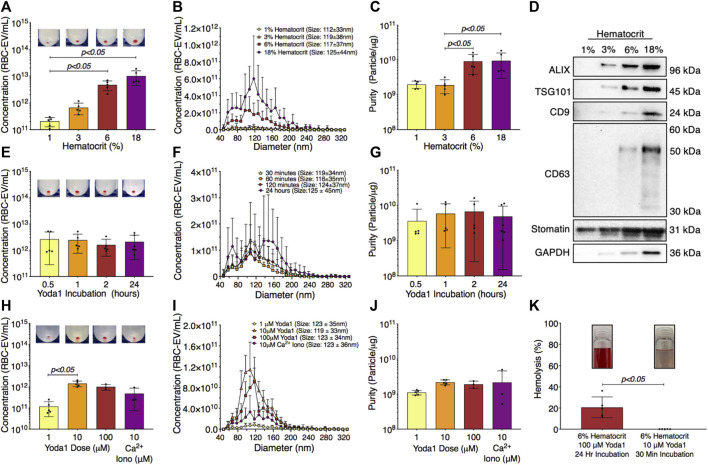
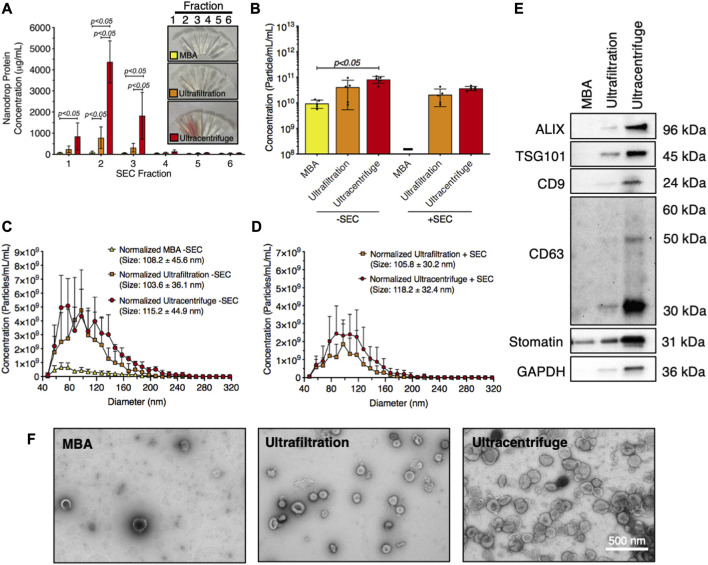
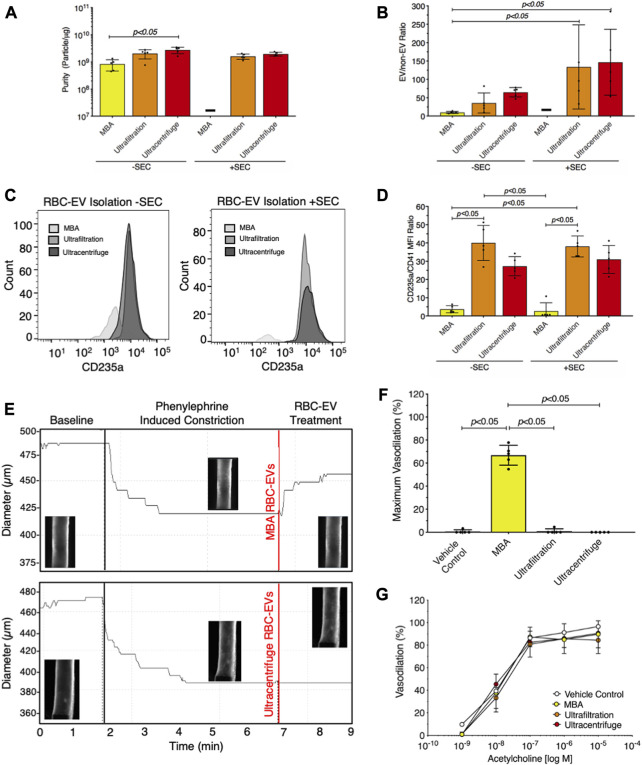
Introduction: Generating physiologically relevant red blood cell extracellular vesicles (RBC-EVs) for mechanistic studies is challenging. Herein, we investigated how to generate and isolate high concentrations of RBC-EVs in vitro via shear stress and mechanosensitive piezo1 ion channel stimulation. Methods: RBC-EVs were generated by applying shear stress or the piezo1-agonist yoda1 to RBCs. We then investigated how piezo1 RBC-EV generation parameters (hematocrit, treatment time, treatment dose), isolation methods (membrane-based affinity, ultrafiltration, ultracentrifugation with and without size exclusion chromatography), and storage conditions impacted RBC-EV yield and purity. Lastly, we used pressure myography to determine how RBC-EVs isolated using different methods affected mouse carotid artery vasodilation. Results: Our results showed that treating RBCs at 6% hematocrit with 10 µM yoda1 for 30 min and isolating RBC-EVs via ultracentrifugation minimized hemolysis, maximized yield and purity, and produced the most consistent RBC-EV preparations. Co-isolated contaminants in impure samples, but not piezo1 RBC-EVs, induced mouse carotid artery vasodilation. Conclusion: This work shows that RBC-EVs can be generated through piezo1 stimulation and may be generated in vivo under physiologic flow conditions. Our studies further emphasize the importance of characterizing EV generation and isolation parameters before using EVs for mechanistic analysis since RBC-EV purity can impact functional outcomes.

Keywords: exosomes; extracellular vesicles; piezo1; red blood cells; shear stress.


Conflict of interest statement

The authors declare that the research was conducted in the absence of any commercial or financial relationships that could be construed as a potential conflict of interest.

Figures

FIGURE 1
FIGURE 1
RBC-EVs circulate in healthy humans, and particles released by RBCs exposed to shear stress contain EVs. (A) Flow cytometry mean fluorescence intensity (MFI) of EV markers (CD63+ and CD81+) on particles isolated from plasma by ultracentrifugation. (B) Flow cytometry histogram of plasma EVs for platelets (CD41+), RBCs (CD235a+), and endothelial cells (CD31+). (C) Size histogram of particles isolated from sheared RBCs using ultrafiltration. (D) Particle rate of samples isolated from RBCs in static conditions, RBC exposed to shear stress, and RBC exposed to shear stress with isolated particles treated with 1% Triton X-100. Particle rate was quantified by measuring the number of particles that passed through the TRPS nanopore over 1 min. (E) Representative Western blot of particles isolated from RBC exposed to shear stress for cytoplasmic EV markers ALIX and TSG101, surface EV markers CD9 and CD63, RBC-specific marker stomatin, and housekeeper GAPDH. (F) Representative TEM images of particles generated by exposing RBC to shear stress. For flow cytometry, each data point represents plasma from one person, with the experiment repeated six times (n = 6). For all other studies, each data point represents a sample in which RBCs were pooled from four people. Shear stress studies were performed in singlicate and repeated six times (n = 6). Western blots were run in triplicate and repeated two times (n = 6 per condition). TEM images were acquired from two samples (n = 2 per condition). Data are represented as mean ± standard deviation. Statistical significance for panel d was determined using Kruskal–Wallis with Dunn’s multiple comparison test.
FIGURE 2
FIGURE 2
RBCs treated with piezo1-agonist yoda1 were viable with minimal hemolysis. (A) Representative calcein-labeled (green) RBC fluorescent microscopy images, with (B) quantification to assess RBC viability. (C) RBC hemolysis, as measured by hemoglobin absorbance at 541 nm in the RBC supernatant. Insets show representative images of RBC supernatant after treatment. RBCs were treated with 0.28% DMSO (vehicle control), 100 µM yoda1, or 100 µM Ca2+ ionophore (iono) for 24 h. Each data point represents a sample in which RBCs were pooled from four people. Cell viability studies were performed in singlicate and repeated five to seven times (n = 5–7 per condition). Hemolysis studies were performed in singlicate and repeated five times (n = 5 per condition). Data are represented as mean ± standard deviation. Statistical significance for panels b and c was determined using Kruskal–Wallis with Dunn’s multiple comparison test.
FIGURE 3
FIGURE 3
RBC particles generated through piezo1 stimulation were confirmed as RBC-EVs by size, protein markers, and morphology. (A) Particle concentration in RBC supernatant after 0.28% DMSO (vehicle control), 100 µM yoda1, and 100 µM Ca2+ ionophore (iono) treatment for 24 h, as measured by TRPS (B) Size histogram of particles isolated from RBC supernatant after DMSO, yoda1, and Ca2+ ionophore treatment, as measured by TRPS (C) Representative Western blots of cytoplasmic EV markers ALIX and TSG101, surface EV markers CD9 and CD63, apoptotic body marker calnexin, RBC-specific marker stomatin, and housekeeper GAPDH. (D) Representative TEM images of piezo1 and Ca2+ ionophore RBC-EVs. (E) Piezo1 and Ca2+ ionophore RBC-EV purity, as measured by particles/µg total protein. Each data point represents a sample in which RBCs were pooled from four people. TRPS and purity studies were performed in singlicate and repeated six times (n = 6 per condition). Western blots were performed in triplicate and repeated two times (n = 6 per condition). TEM images were acquired from two samples (n = 2 per condition). Data are represented as mean ± standard deviation. Statistical significance for panel a was determined using Kruskal–Wallis with Dunn’s multiple comparison test.
FIGURE 4
FIGURE 4
RBC-EVs generated using 6% hematocrit treated with 10 µM yoda1 for 30 min yielded the greatest RBC-EV concentration and purity while minimizing RBC hemolysis. (A) RBC-EV concentration (TRPS), (B) size histogram (TRPS), and (C) protein contamination (particle/µg protein) for 1, 3, 6, and 18% hematocrit treated with 100 µM yoda1 for 2 h (D) Representative Western blot of cytoplasmic EV markers ALIX and TSG101, surface EV markers CD9 and CD63, RBC-specific marker stomatin, and housekeeper GAPDH. (E) RBC-EV concentration (TRPS), (F) size histogram (TRPS), and (G) purity (particle/µg protein) for 6% hematocrit treated with 100 µM yoda1 for 0.5, 1, 2, and 24 h (H) RBC-EV concentration (TRPS) (I) size histogram (TRPS), and (J) purity (particle/µg protein) for 6% hematocrit treated with 1, 10, 100 µM yoda1 or 10 µM Ca2+ ionophore (iono) for 30 min. Inset in panels a, e, and h shows RBC-EV pellet after second ultracentrifugation at 100,000xg. (K) Hemolysis using original treatment (6% hematocrit, 100 µM yoda1, 24 h) and optimized treatment (6% hematocrit, 10 µM yoda1, 30 min) for RBC-EV production. Inset in panel k shows representative RBC supernatant to show hemolysis. Each data point represents a sample in which RBCs were pooled from four people. TRPS and purity studies were performed in singlicate and repeated five times (n = 5 per condition). Western blots were performed in triplicate and repeated two times (n = 6 per condition). Data are represented as mean ± standard deviation. Statistical significance was determined using Kruskal–Wallis with Dunn’s multiple comparison test for panels a, c, e, g, h, j and Mann-Whitney test for panel k.
FIGURE 5
FIGURE 5
Piezo1 RBC-EVs were successfully isolated using ultracentrifugation and ultrafiltration. (A) Nanodrop protein measurements of SEC fractions from RBC-EVs isolated using membrane-based affinity (MBA), ultrafiltration, and ultracentrifugation. (B) Concentration (TRPS) of RBC-EVs isolated using membrane-based affinity, ultrafiltration, and ultracentrifugation with and without SEC purification. Concentration was normalized to the starting RBC supernatant volume. (C) RBC-EV size histogram (TRPS) isolated using membrane-based affinity, ultrafiltration, and ultracentrifugation without SEC purification. (D) RBC-EV size histogram (TRPS) isolated using ultrafiltration and ultracentrifugation with SEC purification. No RBC-EVs were detected in samples isolated using membrane-based affinity with SEC. (E) Representative Western blot of cytoplasmic EV markers ALIX and TSG101, surface EV markers CD9, and CD63, RBC-specific marker stomatin, apoptotic body marker calnexin, and housekeeper GAPDH. (F) TEM of RBC-EVs isolated using membrane-based affinity, ultrafiltration, and ultracentrifugation. For all experiments, RBCs (6% hematocrit) were treated with 10 µM yoda1 for 30 min “-” indicates that sufficient particles were not detected for TRPS concentration measurements. Each data point represents a sample in which RBCs were pooled from four people. Nanodrop and TRPS studies were performed in singlicate and repeated five times (n = 5 per condition). Western blots were performed in triplicate and repeated twice (n = 6 per condition). TEM images were acquired from two samples (n = 2 per condition). Data are represented as mean ± standard deviation. Statistical significance was determined using ordinary two-way ANOVA with Tukey’s multiple comparison test for panel a, and Kruskal–Wallis with Dunn’s multiple comparison test for panel b.
FIGURE 6
FIGURE 6
Ultracentrifugation produced the greatest RBC-EV yield and the lowest protein contamination. (A) Purity of RBC-EVs isolated using membrane-based affinity (MBA), ultrafiltration, and ultracentrifugation, measured by particle/µg protein. (B) Protein aggregates in RBC-EVs isolated using membrane-based affinity, ultrafiltration, and ultracentrifugation. EV/non-EV ratio was calculated by quantifying sample TRPS particle rate before and after lysing RBC-EVs using Triton-X 100. (C) Representative flow cytometry for RBC marker CD235a on RBC-EVs purified with and without SEC. (D) Platelet RBC-EV contamination for RBC-EVs isolated using membrane-based affinity, ultrafiltration, and ultracentrifugation with and without SEC, as quantified by the CD235a(RBC):CD41(platelet) ratio from flow cytometry. (E) Representative pressure myography data of phenylephrine constricted mouse carotid arteries treated with RBC-EVs. (F) Maximum mouse carotid artery vasodilation induced by RBC-EV treatment. (G) Endothelial-dependent mouse carotid artery vasodilation after 5 min RBC-EV treatment, measured using acetylcholine dose response. Controls included buffer XE (used to resuspend membrane-based affinity isolated RBC-EVs) and 2xPBS (used to resuspend ultrafiltration and ultracentrifuge isolated RBC-EVs). “-” indicates that sufficient particles were not detected for TRPS concentration measurements. Each data point represents a sample in which RBCs were pooled from four people. All studies were performed in singlicate and repeated five times (n = 5 per condition). Data are represented as mean ± standard deviation. Statistical significance for panels a, b, d, and f was determined using Kruskal–Wallis with Dunn’s multiple comparison test.

Similar articles

Cited by

References

    1. Allan D., Thomas P., Limbrick A. R. (1980). The isolation and characterization of 60 nm vesicles (‘nanovesicles’) produced during ionophore A23187-induced budding of human erythrocytes. Biochem. J. 188, 881–887. 10.1042/bj1880881 - DOI - PMC - PubMed
    1. Almizraq R. J., Holovati J. L., Acker J. P. (2018). Characteristics of extracellular vesicles in red blood concentrates change with storage time and blood manufacturing method. Transfus. Med. Hemotherapy 45, 185–193. 10.1159/000486137 - DOI - PMC - PubMed
    1. Bigdelou P., Farnoud A. M. (2020). Induction of eryptosis in red blood cells using a calcium ionophore. JoVE J. Vis. Exp., e60659. 10.3791/60659 - DOI - PMC - PubMed
    1. Bosman G. (2013). Survival of red blood cells after transfusion: processes and consequences. Front. Physiol. 4, 376. 10.3389/fphys.2013.00376 - DOI - PMC - PubMed
    1. Brennan K., Martin K., FitzGerald S. P., O’sullivan J., Wu Y., Blanco A., et al. (2020). A comparison of methods for the isolation and separation of extracellular vesicles from protein and lipid particles in human serum. Sci. Rep. 10, 1039–1052. 10.1038/s41598-020-57497-7 - DOI - PMC - PubMed

LinkOut - more resources