

Exploring novel genetic and hematological predictors of response to neoadjuvant chemoradiotherapy in locally advanced rectal cancer
- PMID: 37719698
- PMCID: PMC10501402
- DOI: 10.3389/fgene.2023.1245594
Exploring novel genetic and hematological predictors of response to neoadjuvant chemoradiotherapy in locally advanced rectal cancer
Abstract
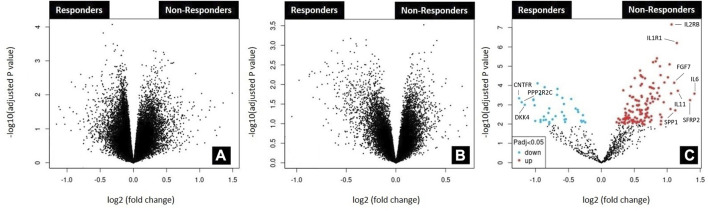
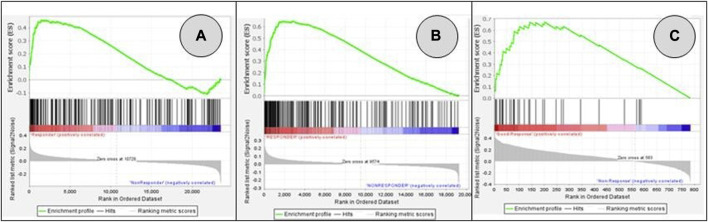
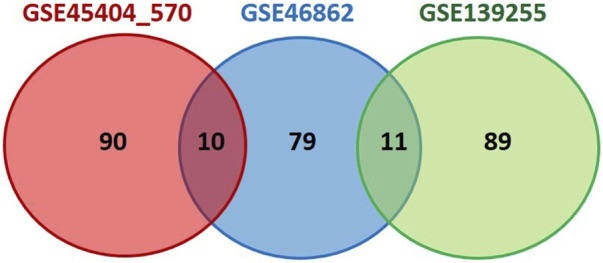
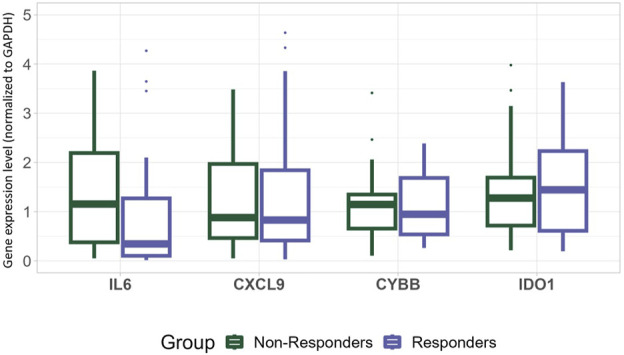
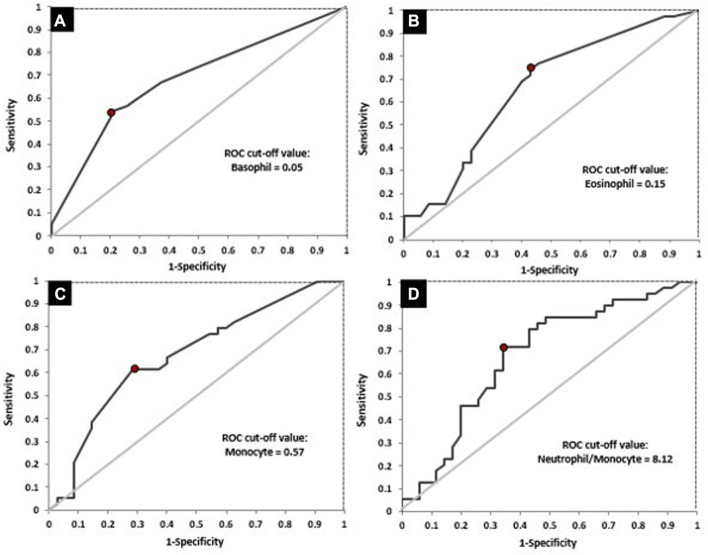
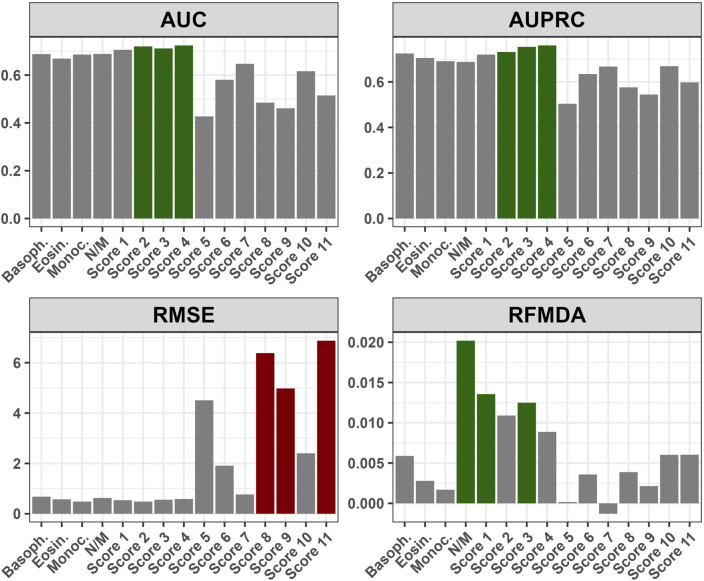
Introduction: The standard treatment for locally advanced rectal cancer (LARC) is neoadjuvant chemoradiotherapy (nCRT). To select patients who would benefit the most from nCRT, there is a need for predictive biomarkers. The aim of this study was to evaluate the role of clinical, pathological, radiological, inflammation-related genetic, and hematological parameters in the prediction of post-nCRT response. Materials and methods: In silico analysis of published transcriptomics datasets was conducted to identify candidate genes, whose expression will be measured using quantitative Real Time PCR (qRT-PCR) in pretreatment formaline-fixed paraffin-embedded (FFPE) samples. In this study, 75 patients with LARC were prospectively included between June 2020-January 2022. Patients were assessed for tumor response in week 8 post-nCRT with pelvic MRI scan and rigid proctoscopy. For patients with a clinical complete response (cCR) and initially distant located tumor no immediate surgery was suggested ("watch and wait" approach). The response after surgery was assessed using histopathological tumor regression grading (TRG) categories from postoperative specimens by Mandard. Responders (R) were defined as patients with cCR without operative treatment, and those with TRG 1 and TRG 2 postoperative categories. Non-responders (NR) were patients classified as TRG 3-5. Results: Responders group comprised 35 patients (46.6%) and NR group 53.4% of patients. Analysis of published transcriptomics data identified genes that could predict response to treatment and their significance was assessed in our cohort by qRT-PCR. When comparison was made in the subgroup of patients who were operated (TRG1 vs. TRG4), the expression of IDO1 was significantly deregulated (p < 0.05). Among hematological parameters between R and NR a significant difference in the response was detected for neutrophil-to-monocyte ratio (NMR), initial basophil, eosinophil and monocyte counts (p < 0.01). According to MRI findings, non-responders more often presented with extramural vascular invasion (p < 0.05). Conclusion: Based on logistic regression model, factors associated with favorable response to nCRT were tumor morphology and hematological parameters which can be easily and routinely derived from initial laboratory results (NMR, eosinophil, basophil and monocyte counts) in a minimally invasive manner. Using various metrics, an aggregated score of the initial eosinophil, basophil, and monocyte counts demonstrated the best predictive performance.
Keywords: hematological parameters; inflammation; locally advanced rectal cancer; neoadjuvant chemoradiotherapy; predictive biomarkers.
Copyright © 2023 Marinkovic, Stojanovic-Rundic, Stanojevic, Ostojic, Gavrilovic, Jankovic, Maksimovic, Stroggilos, Zoidakis, Castellví-Bel, Fijneman and Cavic.
Conflict of interest statement
The authors declare that the research was conducted in the absence of any commercial or financial relationships that could be construed as a potential conflict of interest.
Figures
Similar articles
-
[Construction of a model based on multipoint full-layer puncture biopsy for predicting pathological complete response after neoadjuvant therapy for locally advanced rectal cancer].Zhonghua Wei Chang Wai Ke Za Zhi. 2024 Apr 25;27(4):403-411. doi: 10.3760/cma.j.cn441530-20240101-00002. Zhonghua Wei Chang Wai Ke Za Zhi. 2024. PMID: 38644246 Chinese.
-
[Application value of texture analysis of magnetic resonance images in prediction of neoadjuvant chemoradiotherapy efficacy for rectal cancer].Zhonghua Wei Chang Wai Ke Za Zhi. 2018 Sep 25;21(9):1051-1058. Zhonghua Wei Chang Wai Ke Za Zhi. 2018. PMID: 30269327 Chinese.
-
Pretreatment blood biomarkers combined with magnetic resonance imaging predict responses to neoadjuvant chemoradiotherapy in locally advanced rectal cancer.Front Oncol. 2022 Aug 9;12:916840. doi: 10.3389/fonc.2022.916840. eCollection 2022. Front Oncol. 2022. PMID: 36016621 Free PMC article.
-
[Application value of colonoscopic assessment in "watch and wait" strategy for mid-lower rectal cancer after neoadjuvant chemoradiotherapy].Zhonghua Wei Chang Wai Ke Za Zhi. 2019 Jul 25;22(7):648-655. doi: 10.3760/cma.j.issn.1671-0274.2019.07.009. Zhonghua Wei Chang Wai Ke Za Zhi. 2019. PMID: 31302963 Chinese.
-
Rectal Cancer: Exploring Predictive Biomarkers Through Molecular Pathways Involved in Carcinogenesis.Biology (Basel). 2024 Dec 3;13(12):1007. doi: 10.3390/biology13121007. Biology (Basel). 2024. PMID: 39765674 Free PMC article. Review.
Cited by
-
Two Decades of Progress in Personalized Medicine of Colorectal Cancer in Serbia-Insights from the Institute for Oncology and Radiology of Serbia.Biomedicines. 2024 Oct 8;12(10):2278. doi: 10.3390/biomedicines12102278. Biomedicines. 2024. PMID: 39457591 Free PMC article.
-
Data-Independent Acquisition Mass Spectrometry Analysis of FFPE Rectal Cancer Samples Offers In-Depth Proteomics Characterization of the Response to Neoadjuvant Chemoradiotherapy.Int J Mol Sci. 2023 Oct 21;24(20):15412. doi: 10.3390/ijms242015412. Int J Mol Sci. 2023. PMID: 37895091 Free PMC article.
-
Methylenetetrahydrofolate reductase polymorphic variants C677T and A1298C in rectal cancer in Slavic population: significance for cancer risk and response to chemoradiotherapy.Front Genet. 2024 Jan 15;14:1299599. doi: 10.3389/fgene.2023.1299599. eCollection 2023. Front Genet. 2024. PMID: 38288161 Free PMC article.
-
Dose Escalation in Neoadjuvant Chemoradiotherapy for Rectal Cancer: Short-Term Efficacy and Toxicity of VMAT-SIB vs. 3D-CRT.Medicina (Kaunas). 2025 Mar 11;61(3):483. doi: 10.3390/medicina61030483. Medicina (Kaunas). 2025. PMID: 40142294 Free PMC article.
-
Performance and Dimensionality of Pretreatment MRI Radiomics in Rectal Carcinoma Chemoradiotherapy Prediction.J Clin Med. 2024 Jan 12;13(2):421. doi: 10.3390/jcm13020421. J Clin Med. 2024. PMID: 38256556 Free PMC article.
References
-
- Caliman E., Fancelli S., Ottanelli C., Mazzoni F., Paglialunga L., Lavacchi D., et al. (2022). Absolute eosinophil count predicts clinical outcomes and toxicity in non-small cell lung cancer patients treated with immunotherapy. Cancer Treat. Res. Commun. 32, 100603. 10.1016/j.ctarc.2022.100603 - DOI - PubMed
-
- Cavic M., Krivokuca A., Boljevic I., Brotto K., Jovanović K., Tanic M., et al. (2016). Pharmacogenetics in cancer therapy - 8 years of experience at the Institute for oncology and Radiology of Serbia. J. B.U.ON. 21, 1287–1295. - PubMed
LinkOut - more resources
Full Text Sources
Research Materials