. 2023 Aug 31:14:1181775.
doi: 10.3389/fgene.2023.1181775. eCollection 2023.

Dysregulation of core neurodevelopmental pathways-a common feature of cancers with perineural invasion

Affiliations

Dysregulation of core neurodevelopmental pathways-a common feature of cancers with perineural invasion

Luz María González-Castrillón et al. Front Genet. .

Abstract

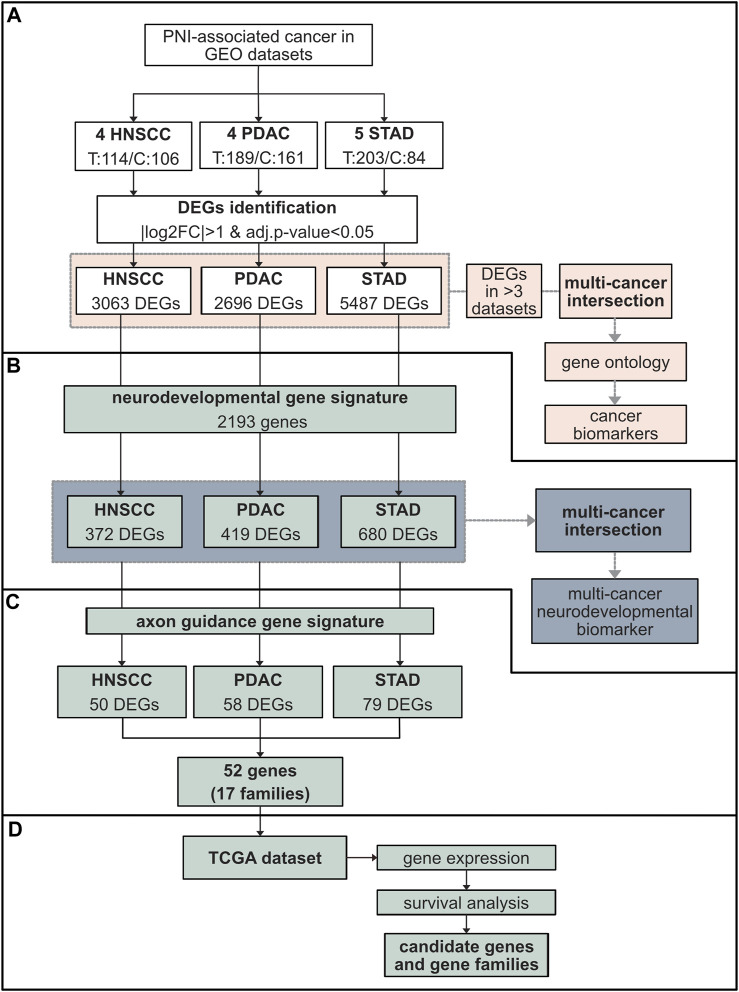
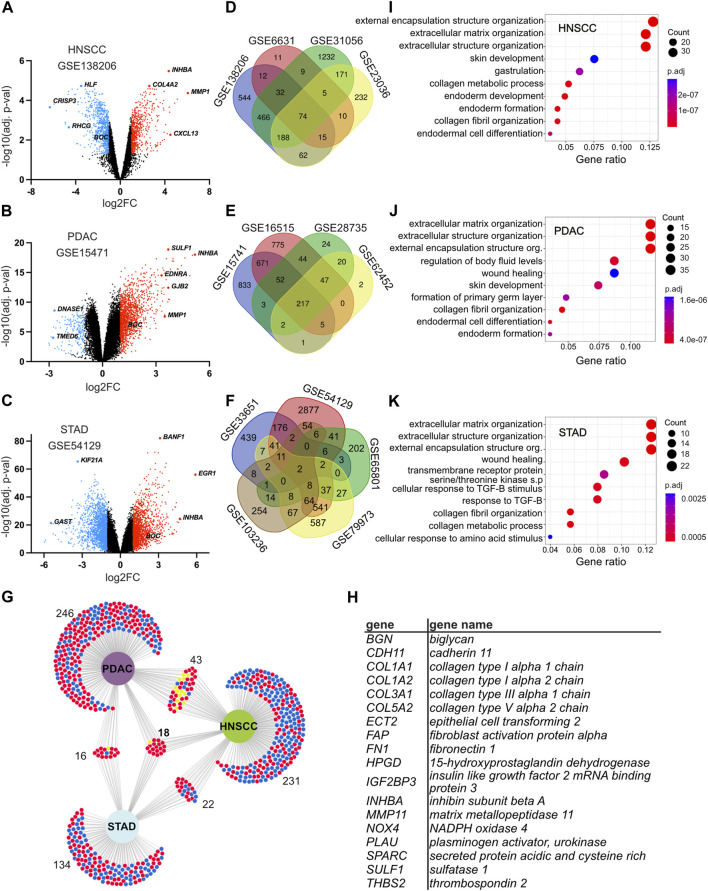
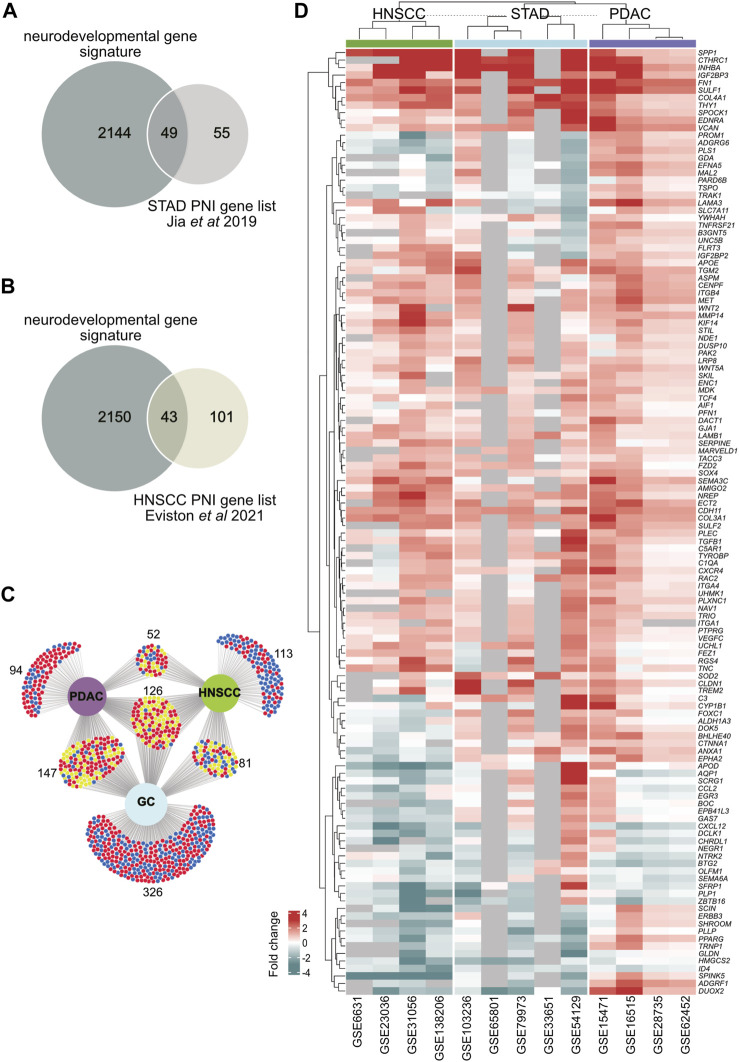
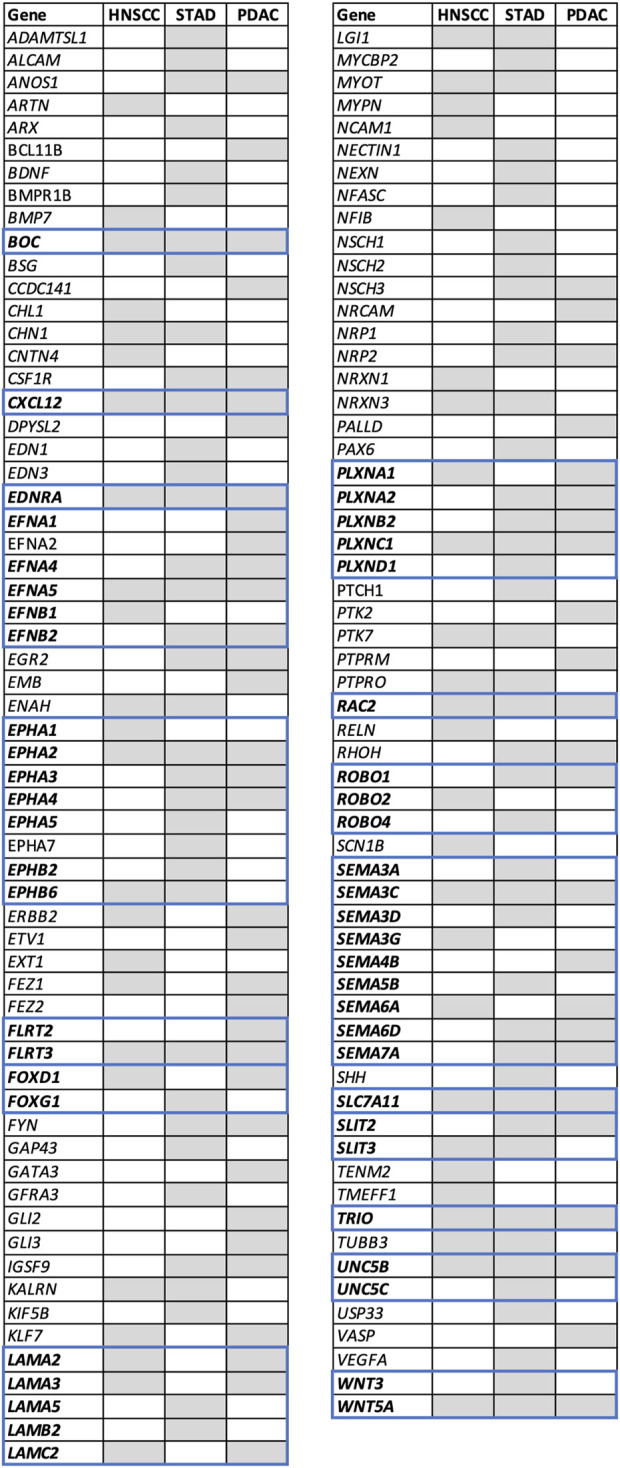
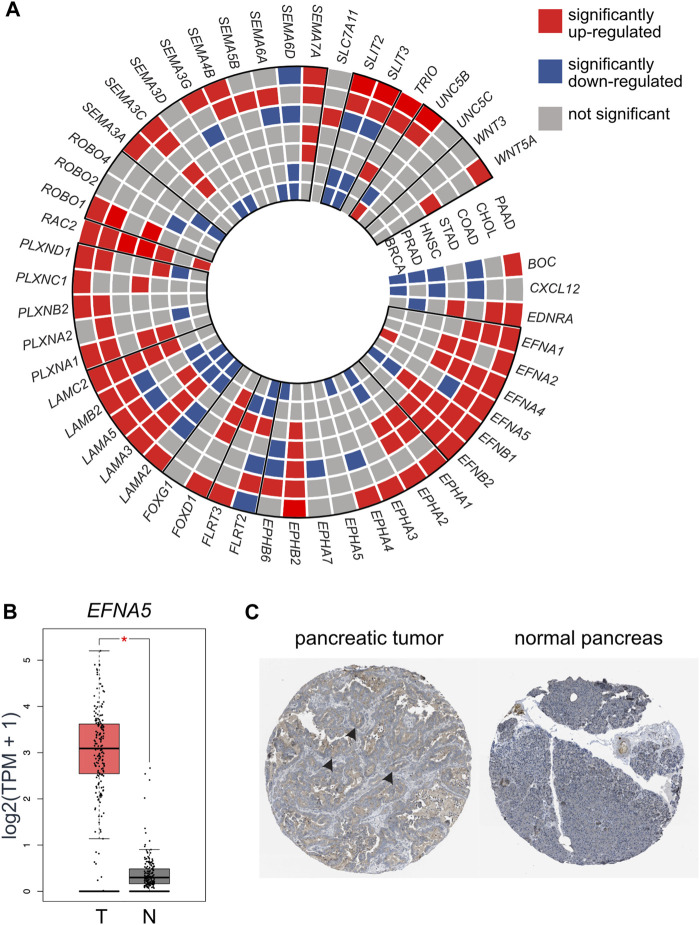
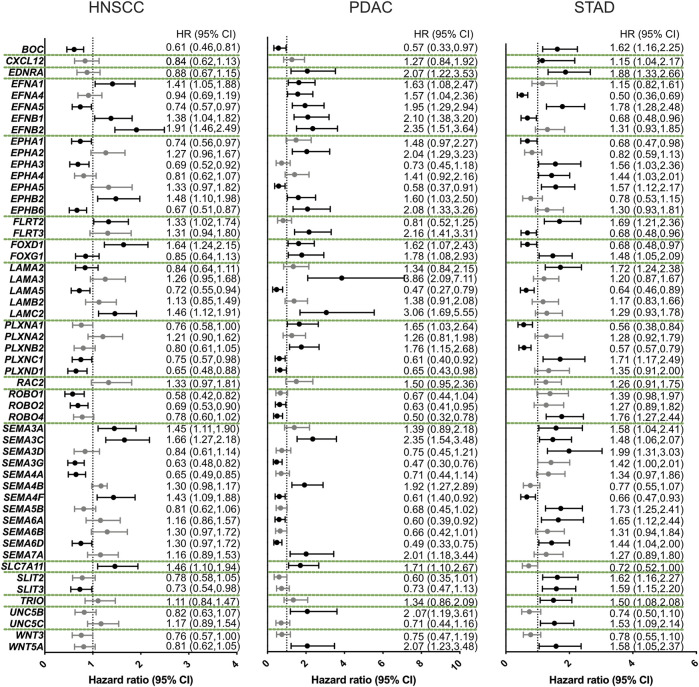
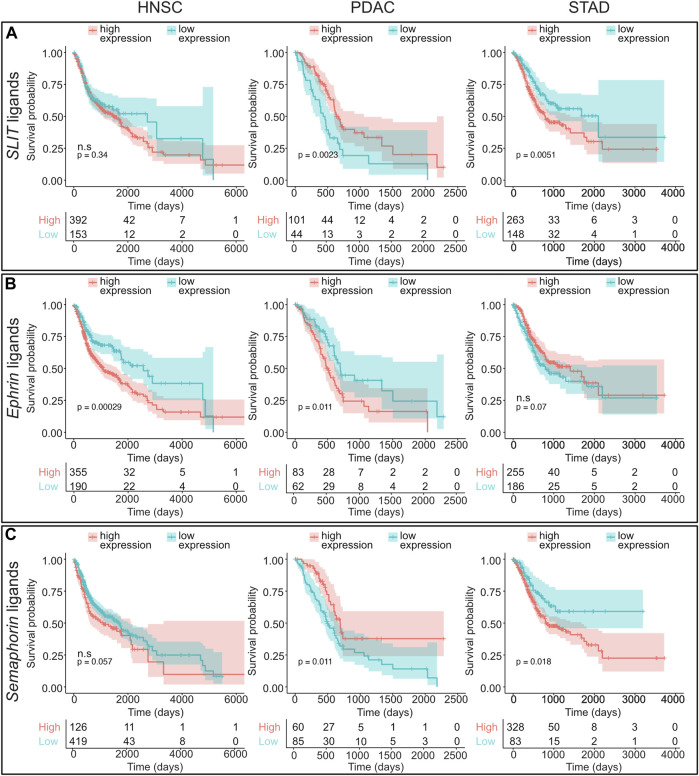
Background: High nerve density in tumors and metastasis via nerves (perineural invasion-PNI) have been reported extensively in solid tumors throughout the body including pancreatic, head and neck, gastric, prostate, breast, and colorectal cancers. Ablation of tumor nerves results in improved disease outcomes, suggesting that blocking nerve-tumor communication could be a novel treatment strategy. However, the molecular mechanisms underlying this remain poorly understood. Thus, the aim here was to identify molecular pathways underlying nerve-tumor crosstalk and to determine common molecular features between PNI-associated cancers. Results: Analysis of head and neck (HNSCC), pancreatic, and gastric (STAD) cancer Gene Expression Omnibus datasets was used to identify differentially expressed genes (DEGs). This revealed extracellular matrix components as highly dysregulated. To enrich for pathways associated with PNI, genes previously correlated with PNI in STAD and in 2 HNSCC studies where tumor samples were segregated by PNI status were analyzed. Neurodevelopmental genes were found to be enriched with PNI. In datasets where tumor samples were not segregated by PNI, neurodevelopmental pathways accounted for 12%-16% of the DEGs. Further dysregulation of axon guidance genes was common to all cancers analyzed. By examining paralog genes, a clear pattern emerged where at least one family member from several axon guidance pathways was affected in all cancers examined. Overall 17 different axon guidance gene families were disrupted, including the ephrin-Eph, semaphorin-neuropilin/plexin, and slit-robo pathways. These findings were validated using The Cancer Genome Atlas and cross-referenced to other cancers with a high incidence of PNI including colon, cholangiocarcinoma, prostate, and breast cancers. Survival analysis revealed that the expression levels of neurodevelopmental gene families impacted disease survival. Conclusion: These data highlight the importance of the tumor as a source of signals for neural tropism and neural plasticity as a common feature of cancer. The analysis supports the hypothesis that dysregulation of neurodevelopmental programs is a common feature associated with PNI. Furthermore, the data suggested that different cancers may have evolved to employ alternative genetic strategies to disrupt the same pathways. Overall, these findings provide potential druggable targets for novel therapies of cancer management and provide multi-cancer molecular biomarkers.

Keywords: bioinformatics; biomarker; cancer; head and neck squamous cell carcinoma; neurodevelopment; pancreatic ductal adenocarcinoma; perineural invasion; stomach adenocarcinoma.


Conflict of interest statement

The authors declare that the research was conducted in the absence of any commercial or financial relationships that could be construed as a potential conflict of interest.

Figures

FIGURE 1
FIGURE 1
Schematic representation of the study design and data analysis. (A) Study population comprising GEO cohorts from three cancers associated with high nerve density and PNI, HNSCC (four datasets), PDAC (four datasets), and STAD (five datasets) (Table 1). The total number of tumor (T) versus control (C) samples are indicated. The fold change in gene expression between tumor and control tissue was performed through the software GEO2R. Genes with |log2FC|>1 and adj. p-val <0.05 were considered differentially expressed genes (DEGs). The number of DEGs for each cancer is indicated. For each cancer type, DEGs common in at least three datasets from the same cancer type were identified (pink). An intersection between the DEGs common in at least three datasets for each cancer were subsequently cross-referenced between PDAC, HNSCC, and STAD to identify common genes and gene ontology performed (pink). (B) The DEGs identified in (A) were cross-referenced with a neurodevelopmental gene signature (QuickGO GO:0007399) (green). A total of 372 neurodevelopmental DEGs were isolated in HNSCC, 419 in PDAC, and 680 in STAD. Neurodevelopmental DEGs were intersected among all cancers analyzed (green). (C) DEGs from each cancer type were analyzed for the presence of axon guidance genes. This resulted in 52 individual axon guidance genes across cancers comprising 17 common axon guidance gene families dysregulated in all cancers. (D) These results were further analyzed using TCGA data cohorts including the same cancers to the GEO analysis in addition to other cancer types associated with high nerve density and PNI: BRCA, PRCA, CHOL, and COAD. This analysis included gene expression comparison between tumor and control tissue and survival analysis. Abbreviations: GEO, Gene Expression Omnibus database; HNSCC, head and neck squamous cell carcinoma; PDAC, pancreatic ductal adenocarcinoma; STAD, stomach adenocarcinoma; DEG, differentially expressed gene; FC, fold change; TCGA, The Cancer Genome Atlas; BRCA, breast cancer; PRCA, prostate cancer; CHOL, cholangiocarcinoma; COAD, colon adenocarcinoma.
FIGURE 2
FIGURE 2
Identification of differentially expressed genes and genes common in head and neck squamous cell carcinoma (HNSCC), pancreatic ductal adenocarcinoma (PDAC), and stomach adenocarcinoma (STAD). (A–C) Volcano plots displaying the distribution of upregulated and downregulated genes when comparing gene expression between tumor and control tissues in selected datasets GSE138206 for HNSCC (A), GSE15471 for PDAC (B), and GSE54129 for STAD (C). All datasets are shown in Supplementary Figure S14. The X-axis indicates the log2FC and the Y-axis the −log10 (adj. p-value). Each dot represents a gene. Red depicts upregulated genes with log2FC > 1 and adj. p-value <0.05; blue depicts downregulated genes with a log2FC < −1 and adj. p-value <0.05. Black depicts genes that were either not significant or where the fold change was below the threshold. (D–F) Venn diagrams of DEGs in the indicated datasets showing the intersection between different datasets from the same cancer type. Each dataset has a distinct color and is labeled with the dataset identification number for HNSCC (D), PDAC (E), and STAD (F). (G) Intersection analysis of DEGs between HNSCC, PDAC, and STAD. DEGs common in at least three datasets for the same cancer were intersected between each cancer examined. Significantly downregulated and upregulated DEGs are delineated with blue and red, respectively. Genes that are either down and upregulated depending on the cancer type are depicted in yellow. The number of genes in each dataset is indicated. (H) List of the 18 DEGs common in at least three datasets in each cancer. (I–K) Gene Ontology analysis of DEGs common in at least three different datasets for the same cancer. Enriched terms for the top 10 biological processes ranked by their count and gene ratio are presented for HNSCC (I), PDAC (J), and STAD (K). Abbreviations: DEG, differentially expressed gene; HNSCC, head and neck squamous cell carcinoma; PDAC, pancreatic ductal adenocarcinoma; STAD, stomach adenocarcinoma; s. p, signaling pathway; TGF-B, transforming growth factor beta adj. p-value, adjusted p-value.
FIGURE 3
FIGURE 3
Identification of neurodevelopmental DEGs in head and neck squamous cell carcinoma (HNSCC), pancreatic ductal adenocarcinoma (PDAC), and stomach adenocarcinoma (STAD). (A) A Venn diagram showing the intersection analysis between a gastric cancer PNI gene list constructed from Jia et al. (2019) and a neurodevelopmental gene signature in this paper. (B) A Venn diagram showing the intersection analysis between a HNSCC PNI gene list constructed from Eviston et al. (2021) and a neurodevelopmental gene signature in this paper. (C) DEGs from all cancer datasets were cross-referenced with the neurodevelopmental gene signature. An intersection analysis of neurodevelopmental DEGs from PDAC, HNSCC, and STAD is shown. 372 neurodevelopmental DEGs were found in HNSCC, 419 in PDAC, and 680 in STAD. There were 126 neurodevelopmental DEGs common to all cancers in any dataset from each cancer. Significantly downregulated and upregulated DEGs are delineated with blue and red, respectively. Genes that are either down or upregulated depending on the cancer type are depicted in yellow. (D) A hierarchical clustering heatmap of the 126 DEGS common to PDAC, HNSCC and GC in (C) is shown. Genes that were not annotated for a given dataset are shown in gray. The expression fold change values are depicted by the intensity of color along a red (upregulated) to blue (downregulated) scale as indicated on the diagram. Abbreviations: DEG, differentially expressed gene; HNSCC, head and neck squamous cell carcinoma; PDAC, pancreatic ductal adenocarcinoma; STAD, stomach adenocarcinoma; PNI, perineural invasion.
FIGURE 4
FIGURE 4
Axon guidance differentially expressed genes in head and neck squamous cell carcinoma (HNSCC), pancreatic ductal adenocarcinoma (PDAC), and stomach adenocarcinoma (STAD). DEGs defined as genes with |log2FC|>1 and adj. p-val <0.05 from all GEO datasets examined were cross-referenced to the axon guidance gene signature (GO:0007411) (Supplementary Table S9). DEGs present in at least one dataset are depicted as gray boxes. Genes are arranged in alphabetical order. Genes belonging to the same family are shown in bold and bordered by blue boxes. A heatmap comparing the expression level in all datasets examined is shown in Supplementary Figure S19. Abbreviations: DEG, differentially expressed gene; HNSCC, head and neck squamous cell carcinoma; PDAC, pancreatic ductal adenocarcinoma; STAD, stomach adenocarcinoma; FC, fold change and adj. p-value, adjusted p-value; GEO, gene expression omnibus.
FIGURE 5
FIGURE 5
TCGA dataset analysis revealed axon guidance genes were dysregulated in a broad range of cancers associated with PNI. (A) A wheel chart depicting dysregulated axon guidance genes in the TCGA datasets. Cancer types are depicted as concentric circle layers and individual genes depicted as slices. Paralog genes are grouped with a bold outline. Significantly upregulated (red), downregulated (blue), and genes which did not reach statistical significance (gray) between tumor and control tissues are depicted. (B) mRNA expression of selected gene EFNA5 in PAAD (Tumor (T) = 179 samples) and normal pancreas from TCGA and GTEx cohorts (normal (N) = 171 samples). (C) Immunohistochemistry of an example differentially expressed molecule EFNA5 in pancreatic tumor (https://www.proteinatlas.org/ENSG00000184349-EFNA5/pathology/pancreatic+cancer#32836_B_4_2) and normal pancreas (https://www.proteinatlas.org/ENSG00000184349-EFNA5/tissue/pancreas#32837_A_3_3) image credit: Human Protein Atlas version 22 proteinatlas.org (Uhlén et al., 2015; Uhlen et al., 2017), arrow heads depict overexpression of EFNA5 (brown staining) in the tumor sample. Abbreviations: PNI, perineural invasion; BRCA, breast cancer; PRCA, prostate cancer; HNSCC, head and neck squamous cell carcinoma; STAD, stomach cancer; COAD, colon adenocarcinoma; CHOL, cholangiocarcinoma; PAAD, pancreatic adenocarcinoma; TPM, transcripts per million; TCGA, The Cancer Genome.
FIGURE 6
FIGURE 6
Axon guidance gene expression influences disease survival. Forest plots of the overall disease survival with respect to relative gene expression. For this analysis, the reference group included patients with low expression of the candidate gene. The dotted line represents a hazard ratio (HR) of 1. Higher expression of candidate genes was associated with significant less overall survival when HR > 1, with a confidence interval (CI) of 95%. These are the data points to the right the dotted line. Higher expression of candidate genes was associated with more overall survival when HR < 1 and 95% CI. These are the data points to the left of the dotted line. Abbreviations: HNSCC, head and neck squamous cell carcinoma; PDAC, pancreatic ductal adenocarcinoma; STAD, stomach adenocarcinoma; HR, hazard ratio; CI, confidence interval.
FIGURE 7
FIGURE 7
Survival analysis of axon guidance gene families analyzing cohorts of paralog genes. Kaplan–Meier plots and number of patients at risk are shown which visualize HNSCC, PDAC, and STAD overall survival based on combined expression levels for the following paralog gene families: (A) SLIT ligands (SLIT1, SLIT2, and SLIT3), (B) EPHRIN ligands (EFNA1, EFNA2, EFNA3, EFNA4, EFNA5, EFNB1, EFNB2, and EFNB3), and (C) semaphorin ligands (SEMA3A, SEMA3B, SEMA3C, SEMA3D, SEMA3E, SEMA3F, SEMA3G, SEMA4A, SEMA4B, SEMA4C, SEMA4D, SEMA4F, SEMA4G, SEMA5A, SEMA5B, SEMA6A, SEMA6B, SEMA6C, SEMA6D, and SEMA7A). For this analysis, patients were segregated in two cohorts (low and high ligand expression) based on the most significant cut-off value for the combined genes. Low- and high-expression groups are depicted in blue and red curves, respectively. Abbreviations: HNSCC, head and neck squamous cell carcinoma; PDAC, pancreatic ductal adenocarcinoma; STAD, stomach adenocarcinoma; ns, not significant.

Similar articles

Cited by

  • Prognostic Evaluation of Piezo2 Channels in Mammary Gland Carcinoma.
    Martín-Sanz R, Rodrigues-Françoso A, García-Mesa Y, García-Alonso FJ, Gómez-Muñoz MA, Malmierca-González S, Salazar-Blázquez R, García-Suárez O, Feito J. Martín-Sanz R, et al. Cancers (Basel). 2024 Jun 29;16(13):2413. doi: 10.3390/cancers16132413. Cancers (Basel). 2024. PMID: 39001475 Free PMC article.

References

    1. Amit M., Na’ara S., Gil Z. (2016). Mechanisms of cancer dissemination along nerves. Nat. Rev. Cancer 16, 399–408. 10.1038/nrc.2016.38 - DOI - PubMed
    1. Anderson T. D., Feldman M., Weber R. S., Ziober A. F., Ziober B. L. (2001). Tumor deposition of laminin-5 and the relationship with perineural invasion. Laryngoscope 111, 2140–2143. 10.1097/00005537-200112000-00011 - DOI - PubMed
    1. Ashrafizadeh M., Taeb S., Hushmandi K., Orouei S., Shahinozzaman M., Zabolian A., et al. (2020). Cancer and SOX proteins: new insight into their role in ovarian cancer progression/inhibition. Pharmacol. Res. 161, 105159. 10.1016/J.PHRS.2020.105159 - DOI - PubMed
    1. Badea L., Herlea V., Dima S. O., Dumitrascu T., Popescu I. (2008). Combined gene expression analysis of whole-tissue and microdissected pancreatic ductal adenocarcinoma identifies genes specifically overexpressed in tumor epithelia. Hepatogastroenterology 55, 2016–2027. - PubMed
    1. Bapat A. A., Hostetter G., Von Hoff D. D., Han H. (2011). Perineural invasion and associated pain in pancreatic cancer. Nat. Rev. Cancer 11, 695–707. 10.1038/nrc3131 - DOI - PubMed