[Preprint]. 2023 Sep 6:rs.3.rs-3240080.
doi: 10.21203/rs.3.rs-3240080/v1.

The canonical HPA axis facilitates and maintains light adaptive behavior

Affiliations

The canonical HPA axis facilitates and maintains light adaptive behavior

Han Lee et al. Res Sq. .

Update in

Abstract

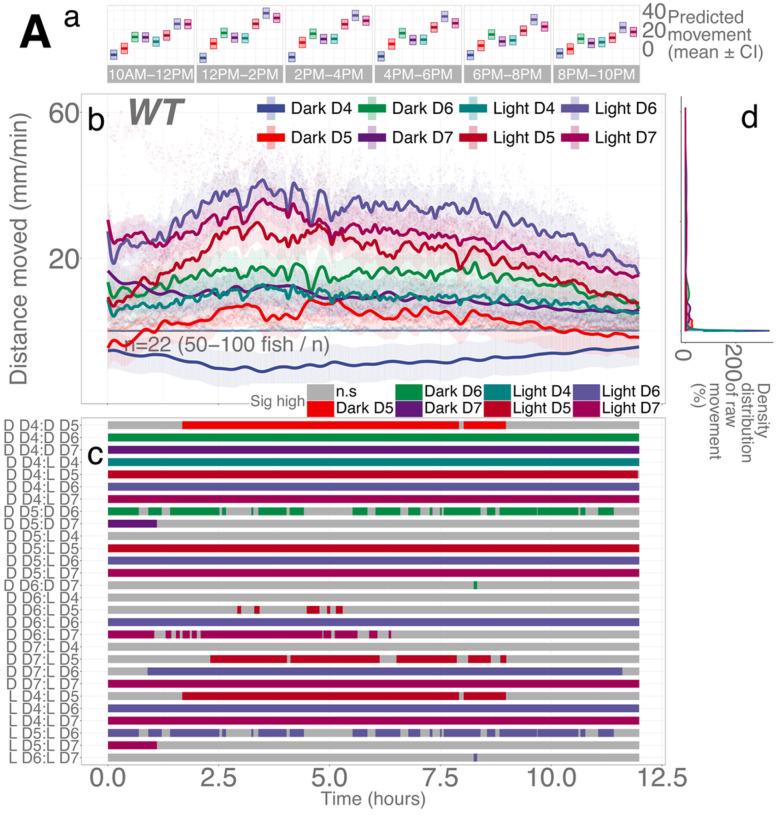
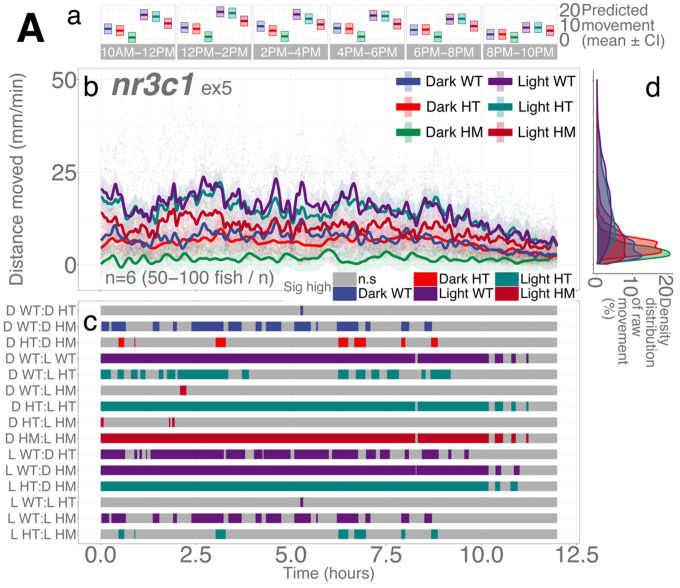
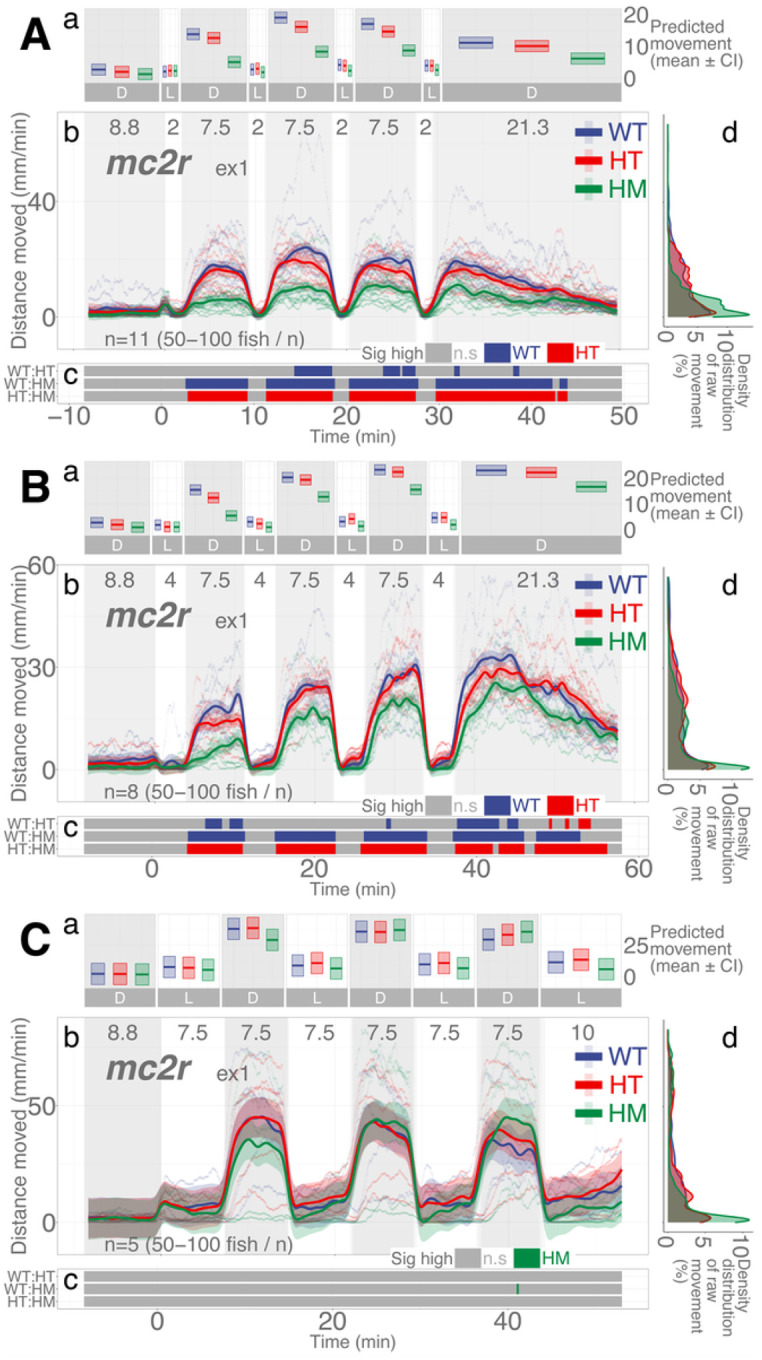
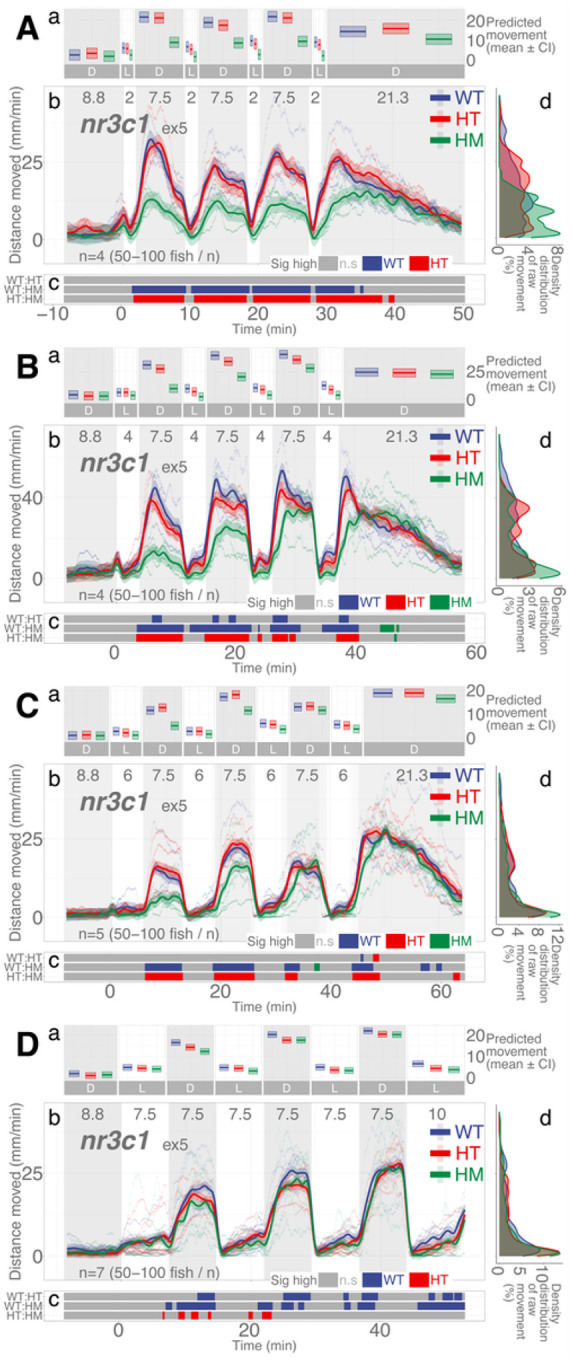
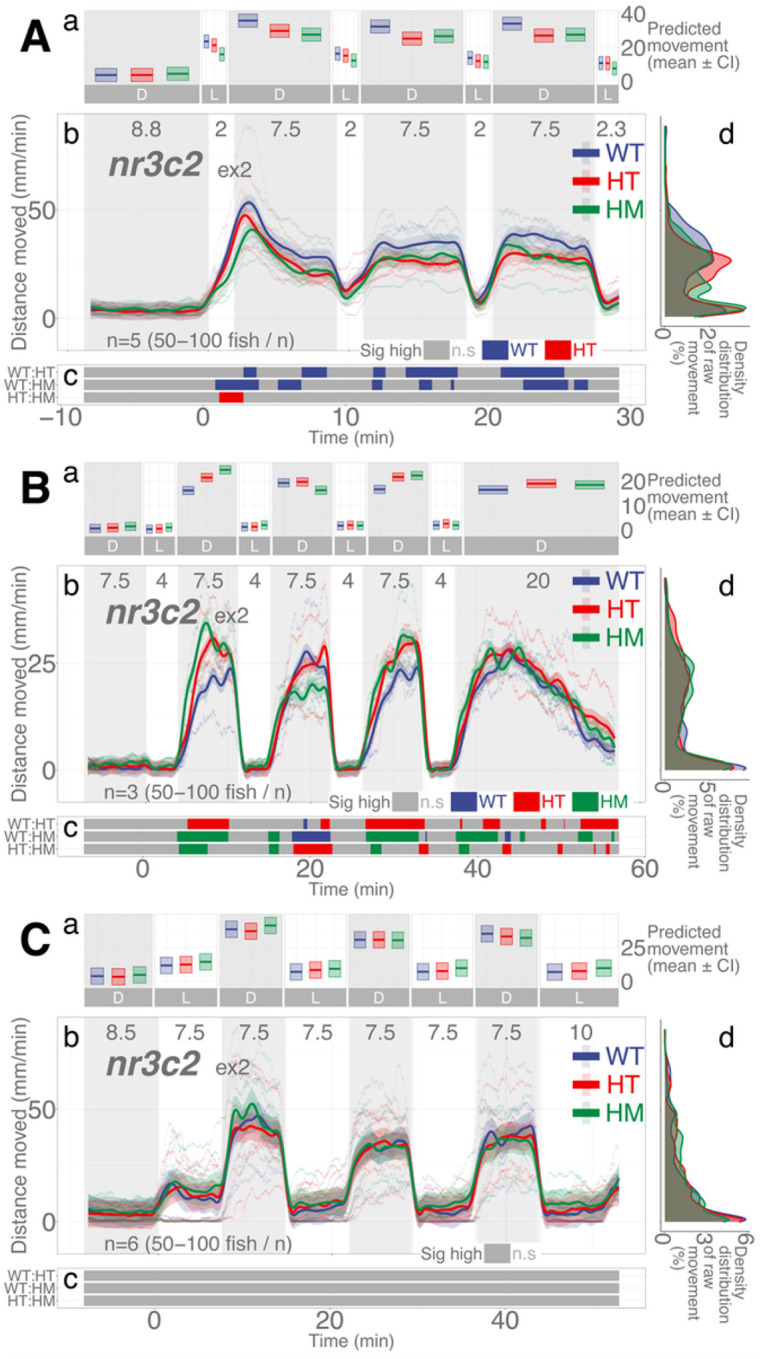
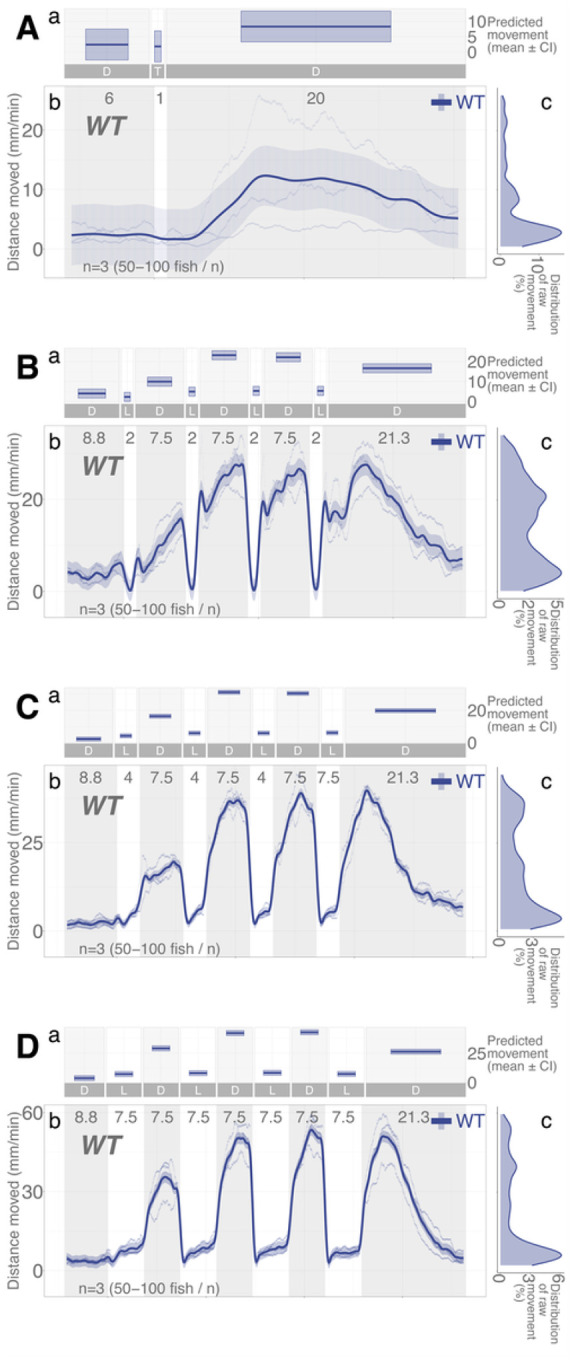
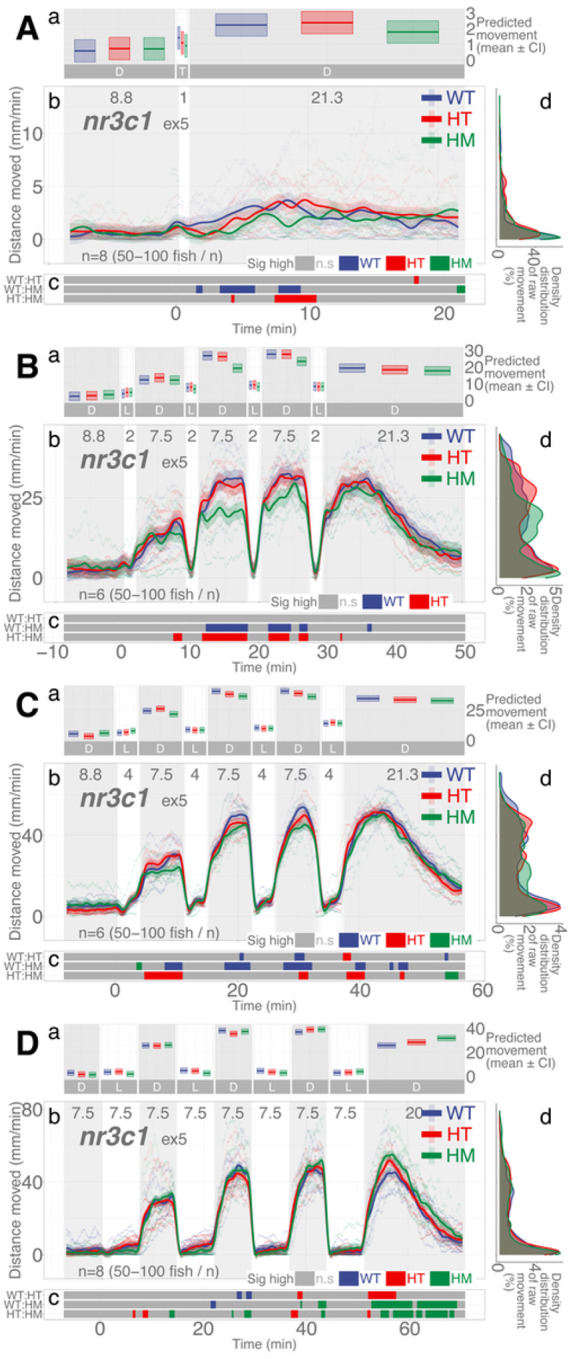
The vertebrate stress response (SR) is mediated by the hypothalamic-pituitary-adrenal (HPA) axis and contributes to generating context appropriate physiological and behavioral changes. Although the HPA axis plays vital roles both in stressful and basal conditions, research has focused on the response under stress. To understand broader roles of the HPA axis in a changing environment, we characterized an adaptive behavior of larval zebrafish during ambient illumination changes. The glucocorticoid receptor (nr3c1) was necessary to maintain basal locomotor activity in light and darkness. The HPA axis was required to adapt to light more efficiently but became dispensable when longer illumination was provided. Light adaptation was more efficient in dimmer light and did not require the mineralocorticoid receptor (nr3c2). Our findings show that the HPA axis contributes to the SR at various stages, facilitating the phasic response and maintaining an adapted basal state, and that certain adaptations occur without HPA axis activity.

Keywords: GAM (generalized additive models); GR (glucocorticoid receptor); light adaptation; light assays; stress response; zebrafish.


Conflict of interest statement

All authors declare no conflict of interest regarding this manuscript.

Figures

Figure 1
Figure 1. Schematics of experimental process and behavioral assay paradigms.
A Experimental flow. Embryos obtained on 0 days-post-fertilization (dpf) through natural spawning. Healthy larvae were plated onto a pair of 48-well plates on 3–4 dpf. Assays were performed on 5 dpf unless otherwise stated. B Baseline assays. Larvae were videorecorded without any exogenous stimuli for about 12 hours between 9:30 am and 10:30 pm in light or darkness. C Dark-light repeat assays. Fish were observed in a changing illumination regimen i.e., 30-min acclimation + 4x [7.5-min dark + 7.5-min light] + 25-min dark. Some assays do not include the final [25-min dark] component since they were performed before the experimental protocol was established. D Statistical analysis pipeline post-experiment. Data from the dark-light repeat assays went through the complete statistical analysis to obtain the difference between different assay regimens (i.e., [7.5 + 2-min] assay vs. [7.5 + 7.5-min] assay). Inferences for the proportions were not made for baseline assays because there was only one assay regimen for the baseline assay (continuous recording in a dark or lit condition).
Figure 2
Figure 2. Illumination and developmental stages are determinants of basal locomotion in WT larvae.
Aa Locomotor activity (mean predicted value (mm/min) ± 95%CI) for each experimental condition predicted by the generalized additive model (GAM) for each time span. Ab Basal locomotor activity of WTlarvae over 12 hours. The scatterplot (points) shows actual mean locomotor activity (mm/min) for each experimental condition of each assay. The line graph shows predicted locomotor activity for each experimental condition by the GAM (predicted value ± 95%CI). Ac Time points where an experimental condition showed significantly high locomotor activity compared to the other in a pairwise comparison. Ad Density distribution of actual mean locomotor activity shows severely right skewed distribution. The integration of the curve equals 100%. Since individual y-axis bin (distance moved (mm/min)) is smaller than 1 (i.e., 0.2 mm/min), the x-axis values reach over 100% while the area under the curve is still 100%. (D: dark, D4: 4 dpf, L: light, n.s: not significant)
Figure 3
Figure 3. Illumination and genotype are determinants of basal locomotion in nr3c1ex5 lineage larvae.
Aa Locomotor activity (mean predicted value (mm/min) ± 95%CI) for each experimental condition predicted by the GAM for each time span. Ab Basal locomotor activity of nr3c!ex5 larvae over 12 hours. The scatterplot (points) shows actual mean locomotor activity (mm/min) for each experimental condition of each assay. The line graph shows predicted locomotor activity for each experimental condition by the GAM (predicted value ± 95%CI). Ac Time points where an experimental condition showed significantly high locomotor activity compared to the other in a pairwise comparison. Ad Density distribution of actual mean locomotor activity shows severely right skewed distribution. The integration of the curve equals 100%. (D: dark, L: light, WT: wildtype, HT: heterozygous, HM: homozygous, n.s: not significant)
Figure 4
Figure 4. mc2r lineage larvae respond differentially in post-illumination darkness based on the durations of illumination and genotype.
Aa, Ba, Ca Locomotor activity (mean predicted value (mm/min) ± 95%CI) for each experimental condition predicted by the GAM for each photo period (gray: dark, white: light period). Ab, Bb, Cb Locomotor response of mc2tex1 larvae during dark-light repeat assays. The scatterplot (points) shows actual mean locomotor activity (mm/min) for each experimental condition of each assay. The line graph shows predicted locomotor activity for each experimental condition by the GAM (predicted value ± 95%CI; gray: dark, white: light period). Ac, Bc, Cc Time points where an experimental condition showed significantly high locomotor activity compared to the other in a pairwise comparison. Ad, Bd, Cd Density distribution of actual mean locomotor activity shows severely right skewed distribution. The integration of the curve equals 100%. (D: dark, L: light, WT: wildtype, HT: heterozygous, HM: homozygous, n.s: not significant)
Figure 5
Figure 5. nr3c1ex5 lineage larvae respond differentially in post-illumination darkness based on the durations of illumination and genotype.
Aa, Ba, Ca, Da Locomotor activity (mean predicted value (mm/min) ± 95%CI) for each experimental condition predicted by the GAM for each photo period (gray: dark, white: light period). Ab, Bb, Cb, Db Locomotor response of nr3dex5 larvae during dark-light repeat assays. The scatterplot (points) shows actual mean locomotor activity (mm/min) for each experimental condition of each assay. The line graph shows predicted locomotor activity for each experimental condition by the GAM (predicted value ± 95%CI; gray: dark, white: light period). Ac, Bc, Cc, Dc Time points where an experimental condition showed significantly high locomotor activity compared to the other in a pairwise comparison. Ad, Bd, Cd, Dd Density distribution of actual mean locomotor activity shows severely right skewed distribution. The integration of the curve equals 100%. (D: dark, L: light, WT: wildtype, HT: heterozygous, HM: homozygous, n.s: not significant)
Figure 6
Figure 6. Mutation in nr3c2ex2 do not have main effect on locomotion.
Aa, Ba, Ca Locomotor activity (mean predicted value (mm/min) ± 95%CI) for each experimental condition predicted by the GAM for each photo period (gray: dark, white: light period). Ab, Bb, Cb Locomotor response of nr3c2ex2 larvae during dark-light repeat assays. The scatterplot (points) shows actual mean locomotor activity (mm/min) for each experimental condition of each assay. The line graph shows predicted locomotor activity for each experimental condition by the GAM (predicted value ± 95%CI; gray: dark, white: light period). Ac, Bc, Cc Time points where an experimental condition showed significantly high locomotor activity compared to the other in a pairwise comparison. Despite such apparent significant difference at some time points, there was no main effect of being HM on locomotor response compared to WT siblings (Refer to the Results). The tile graphs are provided to show the patterns in difference. Ad, Bd, Cd Density distribution of actual mean locomotor activity shows severely right skewed distribution. The integration of the curve equals 100%. (D: dark, L: light, WT: wildtype, HT: heterozygous, HM: homozygous, n.s: not significant)
Figure 7
Figure 7. Much dimmer illumination reproduces the same pattern of dark-light responses in WT larvae.
Dimmer illumination (20.5 μW·cm−2; 300 lx) was used compared to that of all other experiments (469.4 μW·cm−2; 8000 lx). IR illumination was the same (116.0 μW·cm−2; 0 lx). Aa, Ba, Ca, Da Locomotor activity (mean predicted value (mm/min) ± 95%CI) predicted by the GAM for each photo period (gray: dark, white: light period). A brief illumination assay (1-min light) without the repeat components was included to understand behavior in dim light (A). Ab, Bb, Cb, Db Locomotor response of WT larvae during dark-light repeat assays. The scatterplot (points) shows actual mean locomotor activity (mm/min) of each assay. The line graph shows predicted locomotor activity by the GAM (predicted value ± 95%CI; gray: dark, white: light period). Ac, Bc, Cc, Dc Time points where an experimental condition showed significantly high locomotor activity compared to the other in a pairwise comparison. Ad, Bd, Cd, Dd Density distribution of actual mean locomotor activity shows severely right skewed distribution. The integration of the curve equals 100%. (D: dark, L: light, n.s: not significant)
Figure 8
Figure 8. Much dimmer illumination reproduces the same pattern of dark-light responses in nr3c1ex5 lineage larvae and may lead to more effect photoadaptation.
Dimmer illumination (20.5 μW·cm−2; 300 lx) was used compared to that of all other experiments (469.4 μW·cm−2; 8000 lx). IR illumination was the same (116.0 μW·cm−2; 0 lx). Aa, Ba, Ca, Da Locomotor activity (mean predicted value (mm/min) ± 95%CI) for each experimental condition predicted by the GAM for each photo period (gray: dark, white: light period). A brief illumination assay (1-min light) without the repeat components was included to understand behavior in dim light (A). Ab, Bb, Cb, Db Locomotor response of nr3c1ex5 larvae during dark-light repeat assays. The scatterplot (points) shows actual mean locomotor activity (mm/min) for each experimental condition of each assay. The line graph shows predicted locomotor activity for each experimental condition by the GAM (predicted value ± 95%CI; gray: dark, white: light period). Ac, Bc, Cc, Dc Time points where an experimental condition showed significantly high locomotor activity compared to the other in a pairwise comparison. Despite such apparent significant difference at some time points, there was no main effect of being HM on locomotor response compared to WT siblings, starting from the 2-min light assays (Refer to the Results). The tile graphs are provided to show the patterns in difference. Ad, Bd, Cd, Dd Density distribution of actual mean locomotor activity shows severely right skewed distribution. The integration of the curve equals 100%. (D: dark, L: light, WT: wildtype, HT: heterozygous, HM: homozygous, n.s: not significant)

References

    1. Russell G. & Lightman S. The human stress response. Nat Rev Endocrinol 15, 525–534 (2019). 10.1038/s41574-019-0228-0 - DOI - PubMed
    1. Chrousos G. P. Stress and disorders of the stress system. Nat Rev Endocrinol 5, 374–381 (2009). 10.1038/nrendo.2009.106 - DOI - PubMed
    1. Sapolsky R. M., Romero L. M. & Munck A. U. How do glucocorticoids influence stress responses? Integrating permissive, suppressive, stimulatory, and preparative actions. Endocr Rev 21, 55–89 (2000). 10.1210/edrv.21.1.0389 - DOI - PubMed
    1. Nicolaides N. C., Charmandari E., Kino T. & Chrousos G. P Stress-Related and Circadian Secretion and Target Tissue Actions of Glucocorticoids: Impact on Health. Front Endocrinol (Lausanne) 8, 70 (2017). 10.3389/fendo.2017.00070 - DOI - PMC - PubMed
    1. Spiga F. & Lightman S. L. Dynamics of adrenal glucocorticoid steroidogenesis in health and disease. Mol Cell Endocrinol 408, 227–234 (2015). 10.1016/j.mce.2015.02.005 - DOI - PubMed

Publication types