[Preprint]. 2023 Sep 6:rs.3.rs-2126145.
doi: 10.21203/rs.3.rs-2126145/v1.

Mechanisms of mRNA processing defects in inherited THOC6 intellectual disability syndrome

Affiliations

Mechanisms of mRNA processing defects in inherited THOC6 intellectual disability syndrome

Elizabeth Werren et al. Res Sq. .

Update in

Abstract

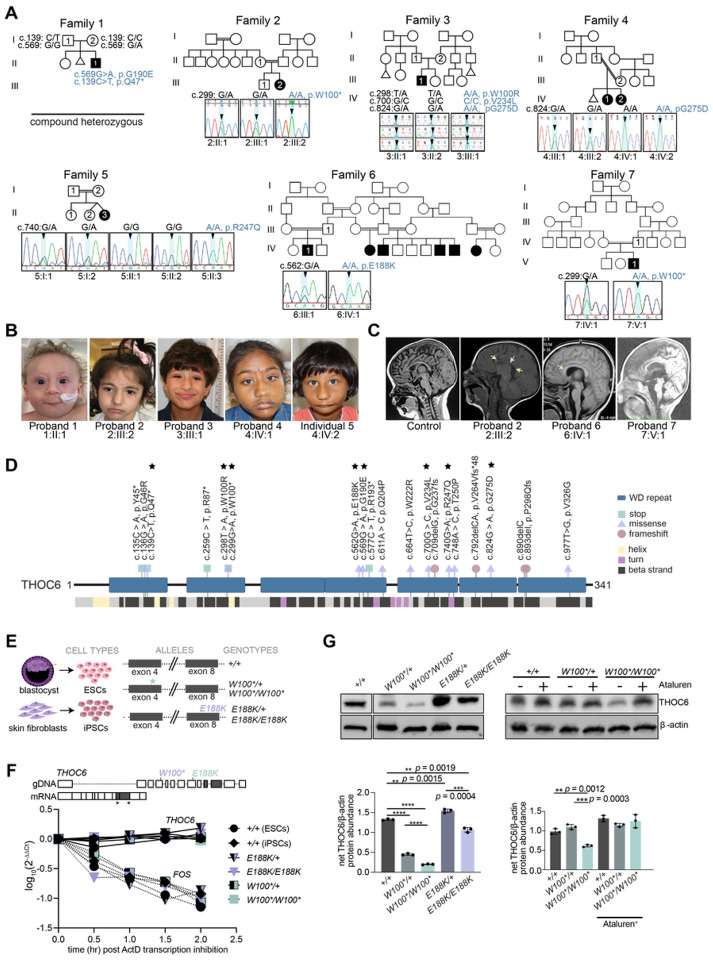
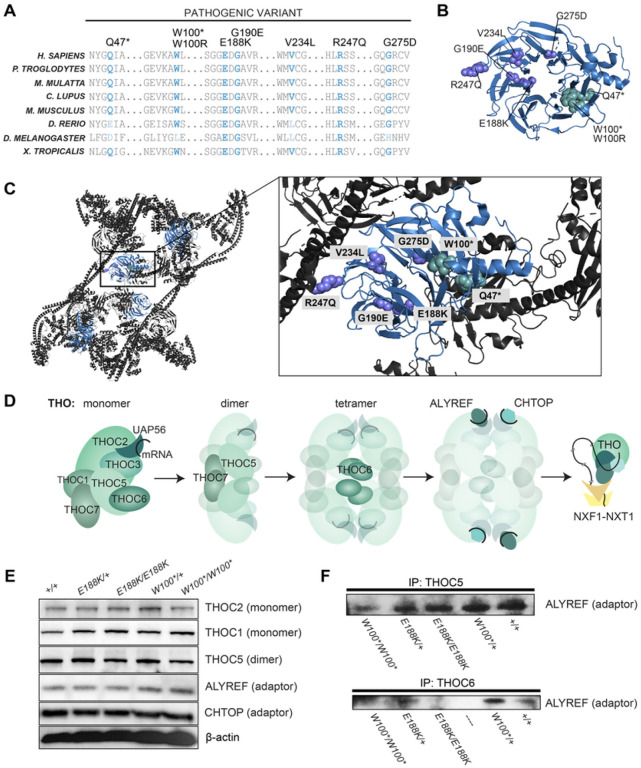
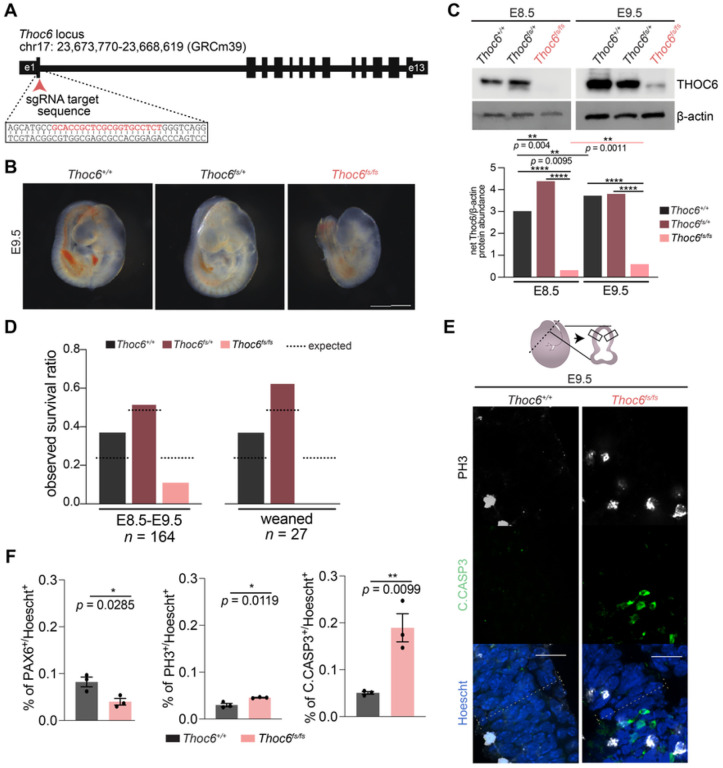
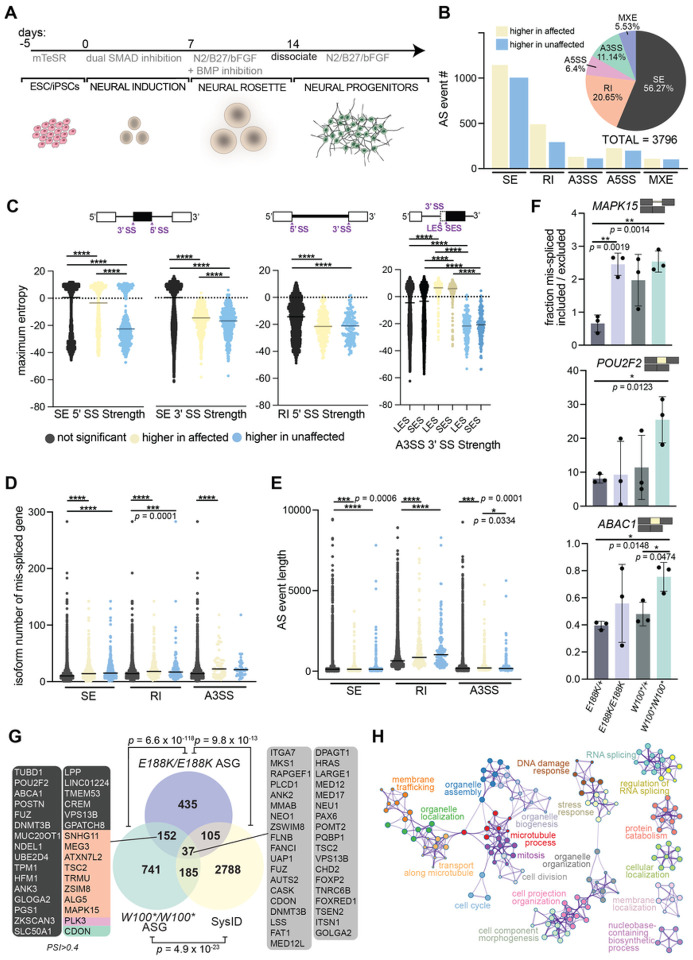
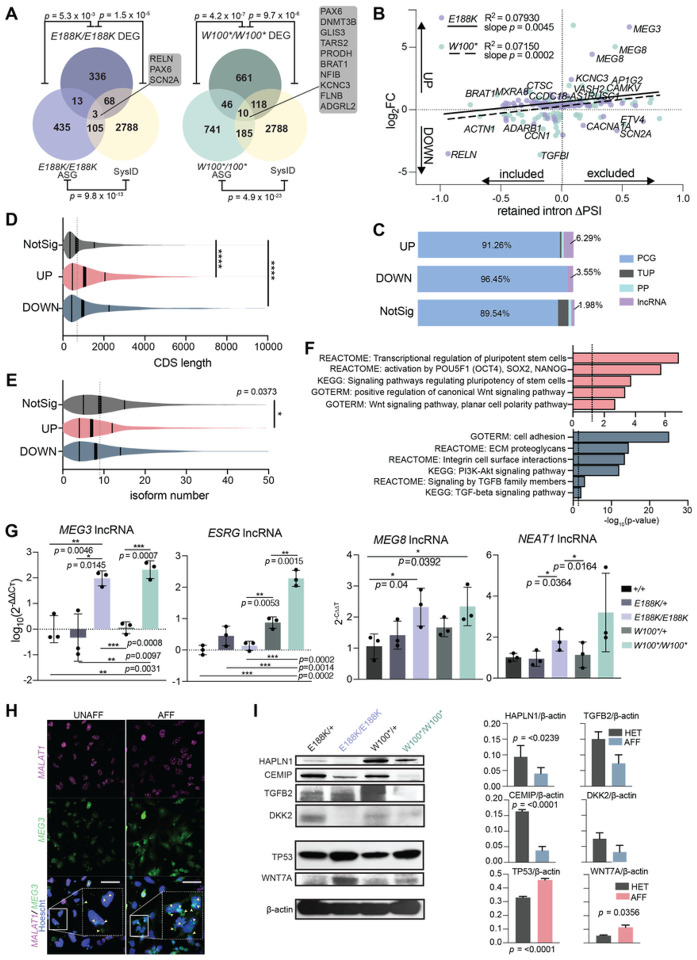
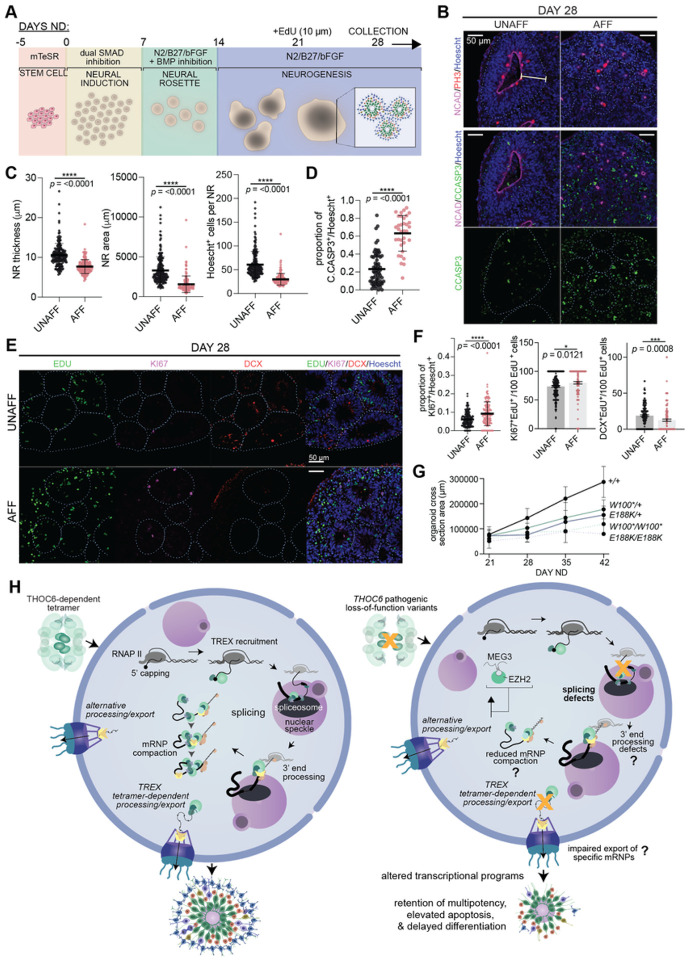
THOC6 is the genetic basis of autosomal recessive THOC6 Intellectual Disability Syndrome (TIDS). THOC6 facilitates the formation of the Transcription Export complex (TREX) tetramer, composed of four THO monomers. The TREX tetramer supports mammalian mRNA processing that is distinct from yeast TREX dimer functions. Human and mouse TIDS model systems allow novel THOC6-dependent TREX tetramer functions to be investigated. Biallelic loss-of-functon(LOF) THOC6 variants do not influence the expression and localization of TREX members in human cells, but our data suggests reduced binding affinity of ALYREF. Impairment of TREX nuclear export functions were not detected in cells with biallelic THOC6 LOF. Instead, mRNA mis-splicing was observed in human and mouse neural tissue, revealing novel insights into THOC6-mediated TREX coordination of mRNA processing. We demonstrate that THOC6 is required for regulation of key signaling pathways in human corticogenesis that dictate the transition from proliferative to neurogenic divisions that may inform TIDS neuropathology.


Conflict of interest statement

COMPETING INTERESTS The authors declare no competing interests.

Figures

Figure 1
Figure 1. Biallelic pathogenic variants in THOC6 cause syndromic intellectual disability.
(A) Pedigree drawings of segregating TIDS phenotypes in families 1–7, with generations listed on the left-hand side. Females are represented as circles and males are denoted by squares. Miscarriages are denoted by small triangles. Affected family members are indicated by solid black coloring while unaffected are unfilled. Consanguineous partnerships are represented by double lines. Chromatograms from Sanger sequencing of THOC6 confirmation of genotypes are provided for each tested family member in families 1–7. (B) Facial photographs of Probands 1–4 and Individual 5. (C) Sagittal brain MRI showing corpus callosum dysgenesis (Probands 2, 6, & 7) and cortical and cerebellar atrophy (Proband 6) compared to control (left). (D) Canonical THOC6 protein map consisting of 341 amino acids. WD40 repeat domains 1–7 are denoted by purple rectangles. Location of known pathogenic variants are annotated relative to linear protein map (top) and secondary structure (below). Variants reported in present study are distinguished by a black star. Missense (blue triangle), nonsense (red square), and frameshift (green circle). (E) Schematic of patient and control-derived human cell types and respective genotypes. (F) Decay of THOC6 mRNA (solid line) following ActD transcriptional inhibition compared to FOS mRNA decay (dotted line) in human ESC/iPSCs across genotypes. Values calculated relative to GAPDH reference mRNA. (G) Western blot of human ESC/iPSCs indicating reduced THOC6 protein expression in THOC6W100*/W100* iPSCs compared to unaffected controls. Confirmation of readthrough by ataluren treatment (30 mM). Abundance quantifications relative to b-actin control (right). Data represented as mean ±SEM. P-value, two-tailed unpaired t test. ****, p-value <0.0001.
Figure 2
Figure 2. Genetic mechanism of biallelic pathogenic THOC6 variants.
(A) Amino acid alignment showing conservation of affected residues for pathogenic variants in present clinical study. Variants mapped to THOC6 folded β-propeller structure (B) and THO/TREX complex (C). (D) Schematic of TREX core tetrameric assembly mediated by THOC6 with functional implications for mRNA processing and export based on published crystal structure. (E) Steady-state protein abundance for THO/TREX complex members and (F) ALYREF abundance following co-immunoprecipitation with THOC5 and THOC6 across genotypes.
Figure 3
Figure 3. Generation of Thoc6fs/fs mouse model.
(A) CRISPR/Cas9 editing strategy to introduce frameshift variants in mouse Thoc6. (B) Representative images of isolated Thoc6+/+, Thoc6fs/+, and Thoc6fs/fs whole embryos at E9.5 prior. Scale bar: 50 μm. (C) Western blot analysis with quantifications of E8.5 and E9.5 mouse embryos showing increased expression during development. Ablation of Thoc6 protein in Thoc6fs/fs is observed at E8.5, with presence of band suggesting read-through product at E9.5. β-actin, loading control. (D) Litter ratio analysis for E8.5–9.5 (left) and weaned (right) Thoc6fs/fs mice. Ratios are consistent with embryonic lethality of homozygous frameshift mice. n = 164 mice (left); n = 27 mice (right). (E) Immunostaining of markers PH3 and C.CASP3 in E9.5 mouse forebrain. Illustration highlights sectioning and quantification approach. (F) Quantifications of fractions of PAX6, PH3, and C.CASP3-expressing cells in E9.5 neuroepithelium. Measurements were combined from one rostral and one caudal section (from two lateral segments depicted by solid black boxes in E) per three embryo replicates per genotype. Data shown as mean ±SEM. Significance, two-tailed t test.
Figure 4
Figure 4. Characterization of alternative splicing events in THOC6 affected hNPCs.
(A) Differentiation protocol to derive human neural progenitor cells from affected and unaffected ESC/iPSCs. (B) Combined rMATS summary results for AS events in THOC6W100*/W100* and THOC6E188K/E188K hNPCs relative to THOC6W100*/+ control hNPCs. Event type (pie chart) and inclusion status (bar chart). Yellow, higher inclusion in affected. Blue, higher inclusion in unaffected. (C) Significant splice site strength score differences at mis-spliced events in affected hNPCs based on maximum entropy model. (D) transcript number per AS gene and (E) AS event length in THOC6W100*/W100 and THOC6E188K/E188K vs. THOC6W100*/+ NPCs. (F) RT-PCR AS validations of SE (ABAC1, POU2F2) and RI (MAPK15) events in three additional biological replicates of hNPCs per genotype with quantified mis-spliced ratios. Data shown as mean ±SEM. P-values (C-F), two-tailed unpaired t test. ****, p = < 0.0001. (G) Venn diagram of overlap of THOC6 W100*/W100* and THOC6E188K/E188K AS genes and all syndromic intellectual disability genes included in the SysID database. Overlap significance tested by Fisher’s exact test. ASG, alternatively spliced genes. Metascape analysis on combined significant mis-spliced events (FDR <0.05) in THOC6E188K/E188K and THOC6W100*/W100* NPCs (H).
Figure 5
Figure 5. Differential expression analysis in affected hNPCs.
(A) Venn diagram of gene overlap of THOC6 W100*/W100* and THOC6E188K/E188K affected genes and all syndromic intellectual disability genes included in the SysID database. Overlap significance tested by Fisher’s exact test. DEG, differentially expressed genes; ASG, alternatively spliced genes. (B) Linear regression analysis of log2foldchange and D percent transcripts spliced in (PSI) for significant retained intron events in affected cells. Purple dots indicate THOC6E188K/E188K hits and green dots indicate THOC6 W100*/W100*. Best fit line, R2, and slope p-value for THOC6E188K/E188K (solid line) and THOC6 W100*/W100* (dotted line). (C) Percentage of gene type by condition for combined DEGs in affected hNPCs. NotSig, not significant; Up, upregulated. Down, downregulated; lncRNA, long non-coding RNA; PP, processed pseudogene; TUP, transcribed unprocessed pseudogene; PCG, protein coding gene. Violin plots of coding sequence (CDS) length (D) and isoform number (E) of combined DEGs in affected cells compared to non-significant genes. (F) DAVID biological pathway enrichment analysis of combined upregulated genes (top, red) and downregulated genes (bottom, blue) in THOC6 affected hNPCs. (G) qPCR relative abundance quantifications (2‒ΔΔCt) for MEG3, ESRG, MEG8, and NEAT1 in hNPCs. Three technical replicates of three biological replicates per genotype. (H) RNA FISH probing for MEG3 and MALAT1 in affected and unaffected hNPCs. Cell inset showing MEG3 expression and localization differences with yellow arrows in merged image. Scale bar 50 mm. UNAFF, unaffected (W100*/+); AFF, affected (W100*/W100*). (I) Protein abundance of top downregulated and upregulated genes across genotypes. Genes labeled with log2FC > 1 or < −1 and PSI > 0.1 or < −0.1. Data shown as mean ±SEM. Significance, two-tailed unpaired t test.
Figure 6
Figure 6. Characterization of mRNA processing defects in Thoc6fs/fs mouse E9.5 forebrain.
(A) Cartoon of E9.5 mouse forebrain total RNA sample preparation. (B) rMATS summary results for AS events in Thoc6fs/fs E9.5 forebrain. Event type (pie chart) and inclusion status (bar chart). Yellow, higher inclusion in Thoc6fs/fs. Blue, higher inclusion in Thoc6+/+. (C) Quantifications from RT-PCR validating top AS events Cenpt, Admts6, Fam214b in 2–4 biological replicates. Significance, two-tailed unpaired t test. Data are mean ±SEM. (D) Significant splice site strength score differences at mis-spliced events in Thoc6fs/fs samples based on maximum entropy model. (E) RT-qPCR validations of Thoc6, Wnt7a, Islr2, Ier3, Kcnt2, Anax2 mRNA abundance on two additional biological replicates of E9.5 forebrain per genotype. Three technical replicates analyzed per sample. Significance, two-tailed unpaired t test. Data are mean ±SEM. (F) DAVID analysis showing significantly enriched biological pathways among upregulated genes (top, magenta) and downregulated genes (bottom, blue) in Thoc6fs/fs E9.5 forebrain. (G) Venn diagram of overlap of DEG in affected hNPCs and Thoc6fs/fs mouse E9.5 forebrain. Overlap significance tested by Fisher’s exact test.
Figure 7
Figure 7. Modeling of THOC6 variant pathogenesis in human cerebral organoids.
(A) Cerebral organoid differentiation protocol. ND, neural differentiation. (B) Immunostaining of PH3, N-Cadherin, apoptosis marker cleaved caspase3 (C.CASP3), and Hoescht in day 28 human cerebral organoids differentiated from unaffected and affected iPSCs, highlighting differences in neural rosette morphology. 40x magnification; Scale bar: 50 μm. UNAFF, unaffected; AFF, affected. (C-D) Quantifications of area, thickness, Hoescht+ cells, and fraction of C.CASP3+ cells per NR for THOC6W100*/+ and THOC6E188K/+ controls and THOC6W100*/W100* and THOC6E188K/E188K affected organoids. NR (organoid) number analyzed across one differentiation replicate per genotype: unaffected, n = 67 (15); affected, n = 34 (10). (E) Immunostaining of EDU, KI67, DCX to assess timing of differentiation in day 28 organoids with quantifications (F). NR (organoid) number analyzed across three differentiation replicates per genotype: unaffected, n = 187 (87); affected, n = 157 (67). (G) Growth rate of organoids across genotypes measured by cross section area (μm) from days 21–42. (C-D, F-G) Data shown as mean ±SEM. Significance, two-tailed unpaired t test. Representative image for unaffected and affected are THOC6E188K/+ and THOC6E188K/E188K, respectively. (H) Schematic of proposed model of THOC6 pathogenesis.

Similar articles

References

    1. Schalock R. L., Luckasson R. & Tassé M. J. An Overview of Intellectual Disability: Definition, Diagnosis, Classification, and Systems of Supports (12th ed.). Am J Intellect Dev Disabil 126, 439–442 (2021). 10.1352/1944-7558-126.6.439 - DOI - PubMed
    1. Yang Y. et al. Molecular findings among patients referred for clinical whole-exome sequencing. JAMA 312, 1870–1879 (2014). 10.1001/jama.2014.14601 - DOI - PMC - PubMed
    1. Retterer K. et al. Clinical application of whole-exome sequencing across clinical indications. Genet Med 18, 696–704 (2016). 10.1038/gim.2015.148 - DOI - PubMed
    1. Vasudevan P. & Suri M. A clinical approach to developmental delay and intellectual disability. Clin Med (Lond) 17, 558–561 (2017). 10.7861/clinmedicine.17-6-558 - DOI - PMC - PubMed
    1. Gieldon L. et al. Diagnostic value of partial exome sequencing in developmental disorders. PLoS One 13, e0201041 (2018). 10.1371/journal.pone.0201041 - DOI - PMC - PubMed

Publication types

LinkOut - more resources