[Preprint]. 2023 Sep 8:rs.3.rs-3246773.
doi: 10.21203/rs.3.rs-3246773/v1.

Live imaging of the airway epithelium reveals that mucociliary clearance modulates SARS-CoV-2 spread

Affiliations

Live imaging of the airway epithelium reveals that mucociliary clearance modulates SARS-CoV-2 spread

Thomas Hope et al. Res Sq. .

Update in

Abstract

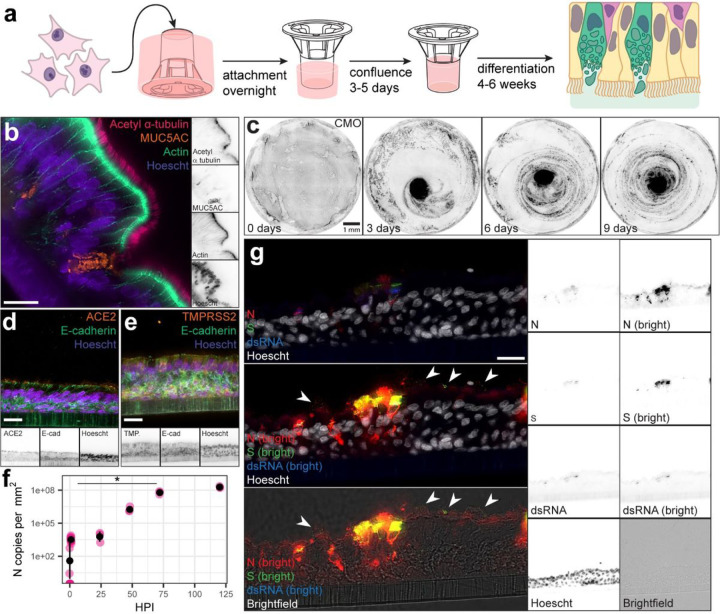
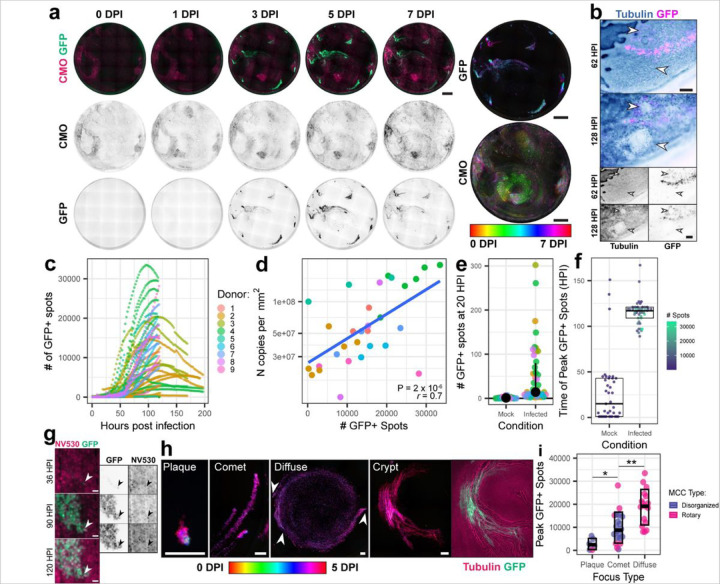
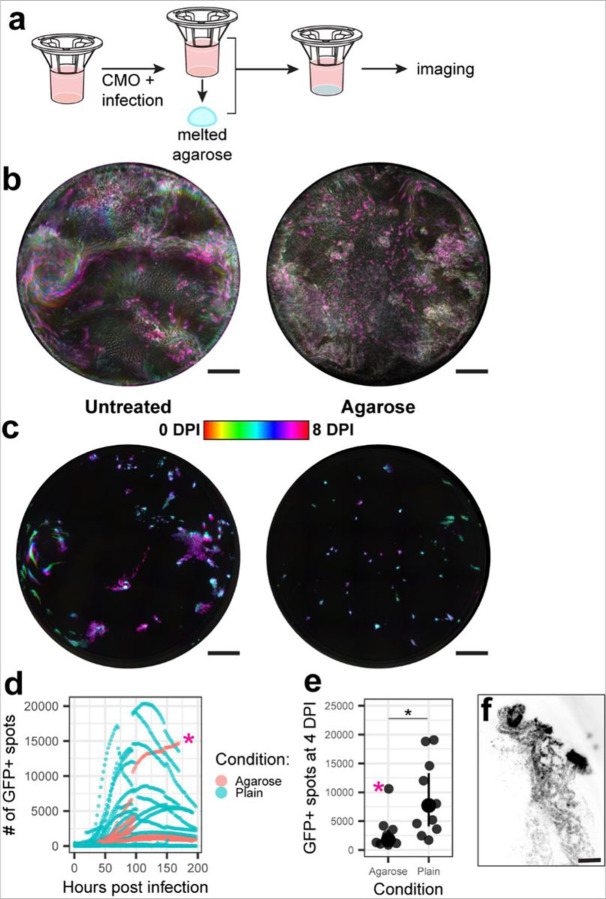
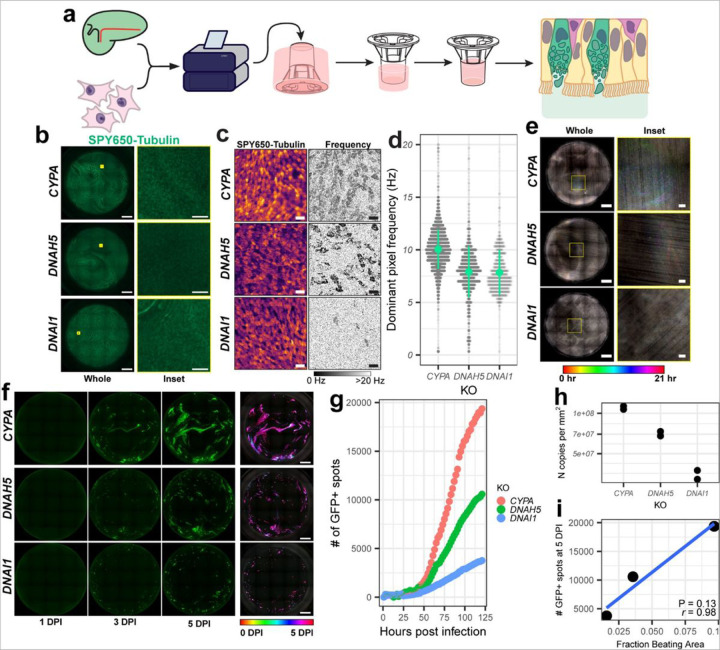
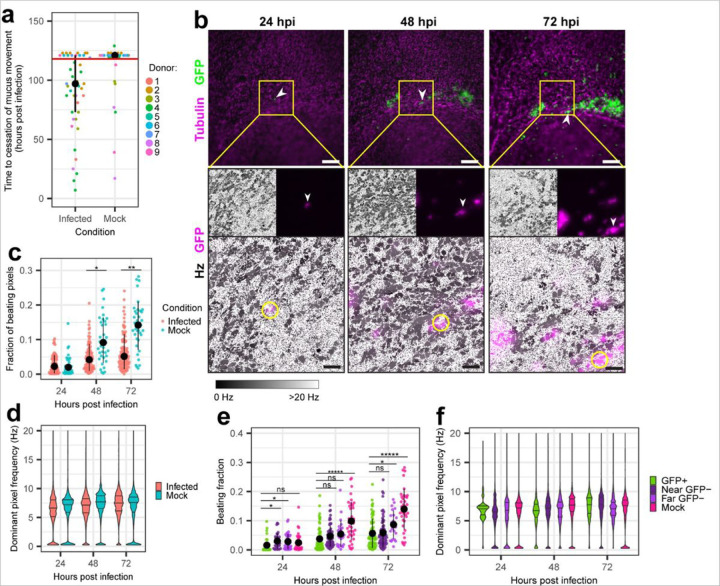
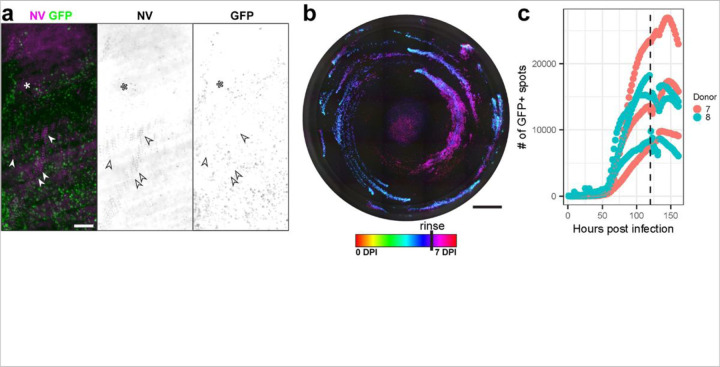
SARS-CoV-2 initiates infection in the conducting airways, which rely on mucocilliary clearance (MCC) to minimize pathogen penetration. However, it is unclear how MCC impacts SARS-CoV-2 spread after infection is established. To understand viral spread at this site, we performed live imaging of SARS-CoV-2 infected differentiated primary human bronchial epithelium cultures for up to 9 days. Fluorescent markers for cilia and mucus allowed longitudinal monitoring of MCC, ciliary motion, and infection. The number of infected cells peaked at 4 days post-infection in characteristic foci that followed mucus movement. Inhibition of MCC using physical and genetic perturbations limited foci. Later in infection, MCC was diminished despite relatively subtle ciliary function defects. Resumption of MCC and infection spread after mucus removal suggests that mucus secretion mediates this effect. We show that MCC facilitates SARS-CoV-2 spread early in infection while later decreases in MCC inhibit spread, suggesting a complex interplay between SARS-CoV-2 and MCC.

Keywords: airway; airway epithelial cells; cilia; epithelium; innate immunity; live cell imaging; microscopy; mucociliary clearance; mucus; respiratory virus; sars-cov-2.


Conflict of interest statement

Declarations COMPETING FINANCIAL INTERESTS J.F.H. has received research support, paid to Northwestern University, from Gilead Sciences and is a paid consultant for Merck. All other authors declare no conflicts of interest.

Figures

Figure 1
Figure 1. Inverted ALI culture models support SARS-CoV-2 infection and MCC.
a,Schematic of inverted ALI culture. b, Immunofluorescent image of a section of a differentiated ALI culture stained for: cilia (acetyl α-tubulin, bright pink), cell-cell junctions (actin, spring green) mucus (MUC5AC, amber), and nuclei (Hoescht, electric indigo). Panels on the right show single channels in inverted grayscale. Scale bar = 20 µm. c, Time lapse of an inverted ALI culture incubated with CellMask Orange Plasma Membrane stain (CMO, inverted greyscale) demonstrating rotary mucociliary clearance over 9 days. Scale bar = 1 mm. d, Immunofluorescent image of a section of a differentiated ALI culture stained for ACE2 (amber), tight junctions (E-Cadherin, spring green), and nuclei (Hoescht, electric indigo). Bottom panels show single channels in inverted grayscale. Scale bar = 20 µm. e,Immunofluorescent image of a section of an ALI culture stained for TMPRSS2 (amber), tight junctions (E-Cadherin, spring green), and nuclei (Hoescht, electric indigo). Bottom panels show single channels in inverted grayscale. Scale bar = 20 µm. f, Copies of nucleoprotein (N) RNA per square millimeter of culture area in mucus collected from inverted ALI cultures immediately prior to or at several timepoints after infection. Fuchsia points represent the mean of technical duplicates (n >= 3 biological replicates per timepoint). Black points and bars represent the mean of means +/− standard deviation. * p-value = 0.02 by Welch’s t-test. g,Immunofluorescent images of a section of a differentiated ALI culture 72 hours after SARS-CoV-2 infection stained for SARS-CoV-2 N (red), Spike (S, green), double-stranded RNA (dsRNA, blue), and nuclei (Hoescht, white). Thresholding of viral antigens is altered in the middle & bottom panel to highlight dim viral protein puncta among the cilia and mucus (white arrowheads). Panels on the right show single channels in inverted grayscale. Scale bar = 20 µm.
Figure 2
Figure 2. Spatiotemporal dynamics of SARS-CoV-2 spread in inverted ALI cultures.
a, Differentiated ALI cultures were infected with icSARS-CoV-2-eGFP (green) in the presence of the indicated stains and imaged using a 4x air lens every other hour for 5–9 days. Images of one representative culture stained with CellMask Orange Plasma Membrane dye (CMO, bright pink) and infected with icSARS-CoV-2/eGFP (spring green) are shown over 7 days of infection. Temporal projections of this culture are shown on the right. Scale bar = 1 mm. b, Representative time lapse images of a focus of infection (GFP, magenta) in a culture stained with SPY650-tubulin (cyan ink wash). Arrowheads highlight ruptures. Scale bar = 200 µm. c, Graph of GFP+ spots over time in SARS-CoV-2 infected ALI cultures from 9 independent donors (n >= 3 replicates per donor). d, Scatterplot of peak GFP+ spots versus N RNA concentration per square millimeter of culture area at 5 days post infection (mean of technical duplicate) from infections of ALI cultures from 8 independent donors (n >= 3 replicates per donor). Pearson’s correlation coefficient r = 0.7, p-value = 2 × 10⁻⁶. e, The number of GFP+ spots counted manually at 20 hours post-infection for each culture (n >= 3 cultures per condition). The black dot and bar depict the mean and interquartile range. c,d,e, Colors are consistent for each donor. f, Time to peak GFP+ spots for cultures where peak occurred prior to cessation of imaging (n = 3–6 cultures per donor per condition). Dots are colored by peak number of GFP+ spots. Black boxplots depict the mean and interquartile range. g, Representative time lapse images of a comet-shaped focus of infection, with SARS-CoV-2-eGFP in spring green & NucView 530 in bright pink. The white arrowhead indicates the first observed infected cell. Scale bar = 10 µm. h, Representative images of foci of various morphology. Scale bar = 100 µm. The first four images are temporal projections from 0 to 5 days post infection; the image to the far right shows the crypt focus at a single timepoint with icSARS-CoV-2/eGFP in green and SPY650-tubulin in bright pink. Arrowheads mark comet heads which initiated the diffuse focus. h, Peak GFP+ spots in each culture separated by focus morphology type. Points are colored by MCC pattern of the culture. Mean and standard deviation are shown. * p = 0.004 & ** p = 0.0006 by Wilcoxon rank sum test.
Figure 3
Figure 3. Agarose overlay restricts mucus flow and SARS-CoV-2 spread.
a, Schematic of agarose overlay experimental design. b, Temporal projection of CMO signal and c, SARS-CoV-2-eGFP signal in representative cultures with (right) and without (left) agarose overlay. Scale bar = 1 mm. d, The number of GFP+ spots in each culture at each timepoint post infection. Agarose overlay cultures are in red, and no overlay cultures are in blue (n >= 3 replicates per donor per condition for 3 donors). The pink asterisk marks an outlier with infected crypts. e, The number of GFP+ spots at 4 days post infection for each culture shown in d. The pink asterisk marks the same outlier. * p = 0.007 by Wilcoxon rank sum test. f, Inverted greyscale image of the GFP channel at 3 days post infection of an infected crypt in the agarose overlay culture indicated with a pink asterisk in d & e. Scale bar = 100 µm.
Figure 4
Figure 4. Genetic perturbation of ciliary motion inhibits SARS-CoV-2 spread.
a, Schematic for the production of gene knockout in inverted ALI cultures. b, Images of SPY650-tubulin signal (green) from KO cultures. Left panels are whole cultures (scale bar = 1 mm). Right panels are insets marked with yellow in the whole culture images (scale bar = 50 µm). c, Sum projections of SPY650-tubulin videos in knockout ALI cultures (left). The dominant beat frequency in Hz of each pixel of the same movies (right) with beating multiciliated cells visible as dark grey patches. Scale bar = 20 µm. d, Bee-swarm plots of the distribution of beat frequency of pixels with power above the noise threshold in SPY650-tubulin movies of knockout ALI cultures. 0.3 mm2 per culture (~1% of total culture area) was surveyed per culture with differences in plot density reflecting different numbers of beating pixels in each culture. e, Temporal projections of 20-hour time lapses of NucView 530 signal from each knockout ALI culture during infection. Rainbow traces indicate motion, while whiter portions indicate lack of motion. Left panels are whole cultures (scale bar = 1 mm). Right panels are insets marked with yellow in the whole culture images (scale bar = 50 µm). f, Snapshots of GFP signal following SARS-CoV-2/eGFP infection of each knockout culture at the indicated time points. The rightmost panels are temporal projections of the entire time course. Scale bar = 1 mm. g, Number of GFP+ spots at each timepoint for each culture. h, Copies of nucleoprotein RNA per mm2 of culture area in mucus collected from knockout ALI cultures at 120 HPI. Points are technical duplicates. i, Scatterplot of peak GFP+ spots versus fraction beating area for KO cultures. Pearson’s correlation coefficient r = 0.98, p-value = 0.13.
Figure 5
Figure 5. Effects of SARS-CoV-2 infection on ciliary motion.
a, Time to cessation of mucus motion in each infected or mock culture (n = 9 donors, >= three replicates per donor). Black dots and lines represent the median +/− interquartile range of each condition. Points above the pink line had mucus motion continuing to the end of imaging. p = 3 × 10⁻⁵ by chi-squared test on the depicted data binned by whether MCC ceased during imaging. b, Live imaging snapshots of an infected cell identified at 24 hpi & followed to 72 hpi. Tubulin and SARS-CoV-2/eGFP are visualized in magenta and green, respectively (top). Scale bar = 200 µm. Beat frequency in Hz of the central field of view (FOV) is shown below in greyscale with infected cells overlaid in magenta (bottom). Scale bar = 50 µm. Arrowheads (top) or yellow circles (bottom) identify the initial infected cell. c, The fraction of beating pixels (power above 40) in each FOV for mock-infected (blue) and SARS-CoV-2 infected (red) cultures over time. Each FOV is 0.0274 mm^2 with at least eight FOVs surveyed for three donors at each timepoint. The black dot and line represents the average +/− standard deviation in each condition. Significance by Wilcoxon rank sum test. * p = 3 × 10⁻⁵. ** p = 7 × 10⁻⁸. d, Violin plots of beat frequency of each beating pixel for all fields of view shown in c. Beat frequency is cut off at 20 Hz to highlight the physiological range of ciliary motion. Horizontal lines within each violin mark median and interquartile range. e, The fraction of beating pixels in subsets of FOVs from mock and infected cultures stratified by proximity to GFP signal. Near GFP-pixels are from FOVs that contain GFP+ pixels and far GFP- pixels are from FOVs in infected cultures that do not contain any GFP+ pixels. Significance was determined by Kruskal-Wallis rank sum test with Benjamini-Hochberg post hoc correction at alpha = 0.05. * p 0.025–0.0025; ** p 0.0025–0.00025, ***** p < 0.0001 f, Violin plots of beat frequency of beating pixels in mock and infected cultures, with those from infected cultures stratified by proximity to GFP+ pixels. d,f, Beat frequency is cut off at 20 Hz to highlight the physiological range of ciliary motion. Horizontal lines within each violin mark median and interquartile range.
Figure 6
Figure 6. Effects of SARS-CoV-2 infection on mucociliary clearance.
a, Projected image showing apoptotic nuclei tracks (NucView 530, magenta) moving over a focus of infection (GFP, green) over the course of 0.8 seconds. Bottom panels are inverted greyscale single channels. Arrowheads point to moving NV puncta; asterisk is adjacent to static NV puncta. Scale bar = 200 µm. b, Temporal projection of the GFP channel of a whole infected culture with a mucosal rinse at 120 hpi (one representative image). Scale bar = 1 mm. c, GFP+ spots at each timepoint for 120 hpi rinsed cultures (n = 3 replicates for two donors). The vertical dashed line marks the time of rinse.

References

    1. Hou Y. J. et al. SARS-CoV-2 Reverse Genetics Reveals a Variable Infection Gradient in the Respiratory Tract. Cell 182, 429–446.e14 (2020). - PMC - PubMed
    1. Killingley B. et al. Safety, tolerability and viral kinetics during SARS-CoV-2 human challenge in young adults. Nat. Med. 28, 1031–1041 (2022). - PubMed
    1. Zhou J. et al. Viral emissions into the air and environment after SARS-CoV-2 human challenge: a phase 1, open label, first-in-human study. Lancet Microbe (2023) doi:10.1016/s2666-5247(23)00101-5. - DOI - PMC - PubMed
    1. Knowles M. R. & Boucher R. C. Mucus clearance as a primary innate defense mechanism for mammalian airways. J Clin Invest 109, 571–577 (2002). - PMC - PubMed
    1. Zhang L., Peeples M. E., Boucher R. C., Collins P. L. & Pickles R. J. Respiratory Syncytial Virus Infection of Human Airway Epithelial Cells Is Polarized, Specific to Ciliated Cells, and without Obvious Cytopathology. J Virol 76, 5654–5666 (2002). - PMC - PubMed

Publication types

LinkOut - more resources