[Preprint]. 2023 Sep 6:rs.3.rs-3296446.
doi: 10.21203/rs.3.rs-3296446/v1.

Temporal dynamics and genomic programming of plasma cell fates

Affiliations

Temporal dynamics and genomic programming of plasma cell fates

Godhev Kumar Manakkat Vijay et al. Res Sq. .

Update in

  • Temporal dynamics and genomic programming of plasma cell fates.
    Manakkat Vijay GK, Zhou M, Thakkar K, Rothrauff A, Chawla AS, Chen D, Lau LC, Gerges PH, Chetal K, Chhibbar P, Fan J, Das J, Joglekar A, Borghesi L, Salomonis N, Xu H, Singh H. Manakkat Vijay GK, et al. Nat Immunol. 2024 Jun;25(6):1097-1109. doi: 10.1038/s41590-024-01831-y. Epub 2024 May 2. Nat Immunol. 2024. PMID: 38698087

Abstract

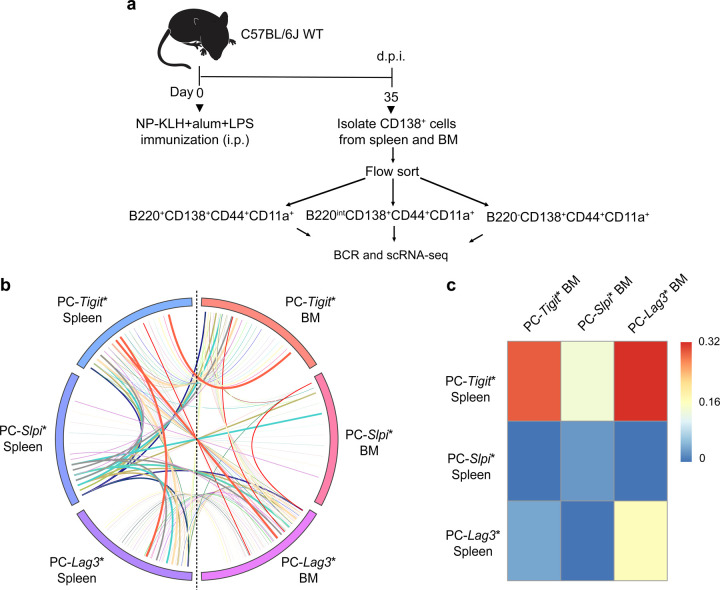
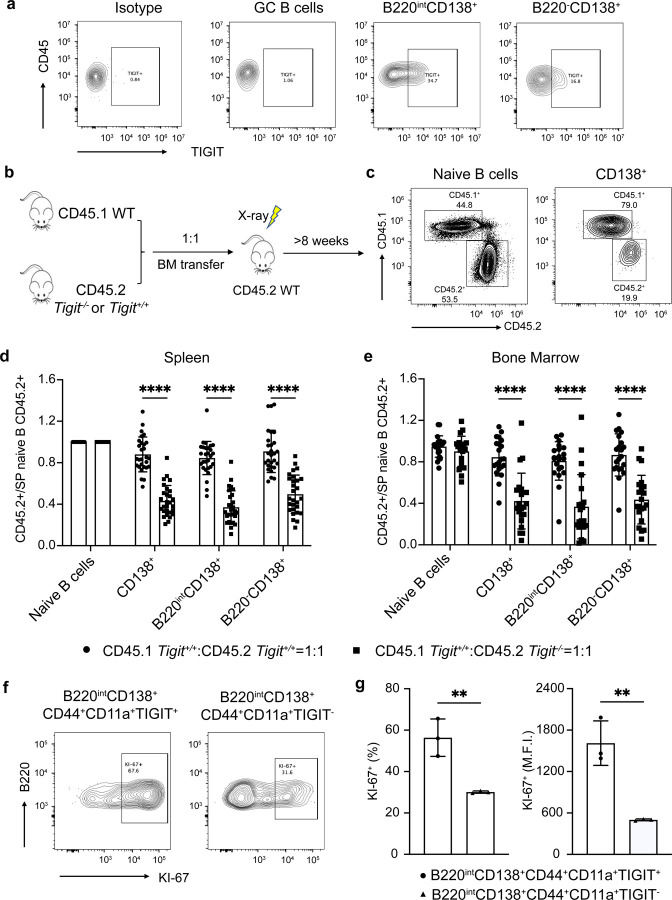
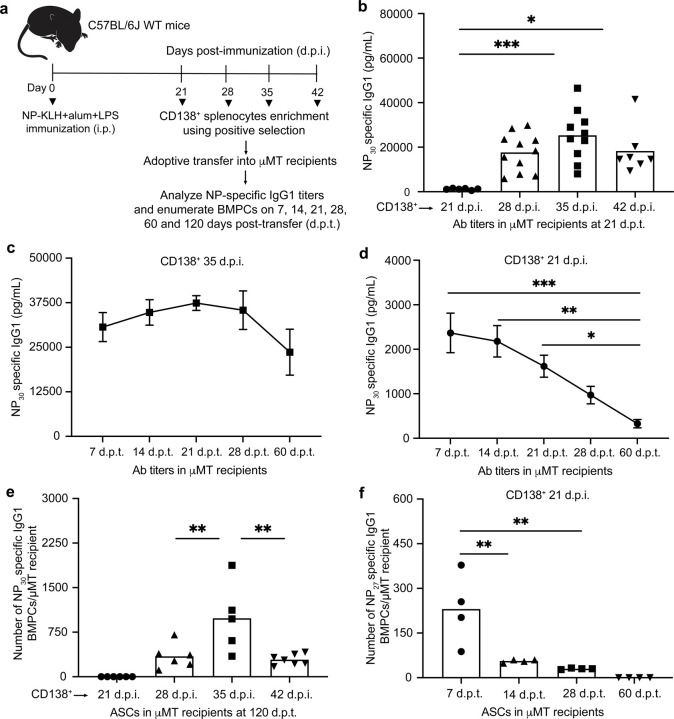
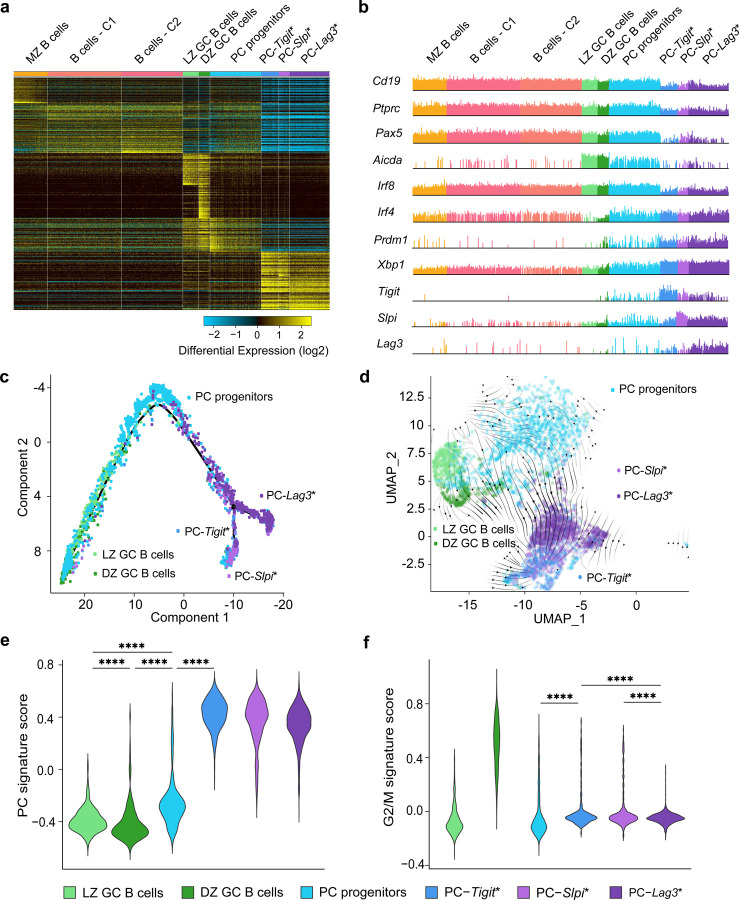
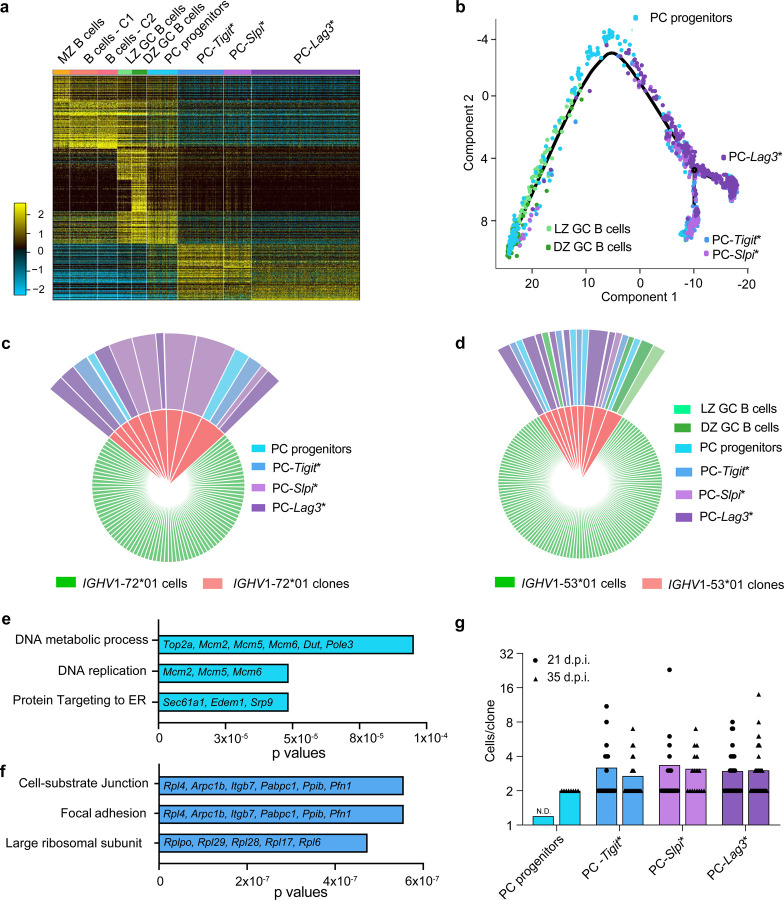
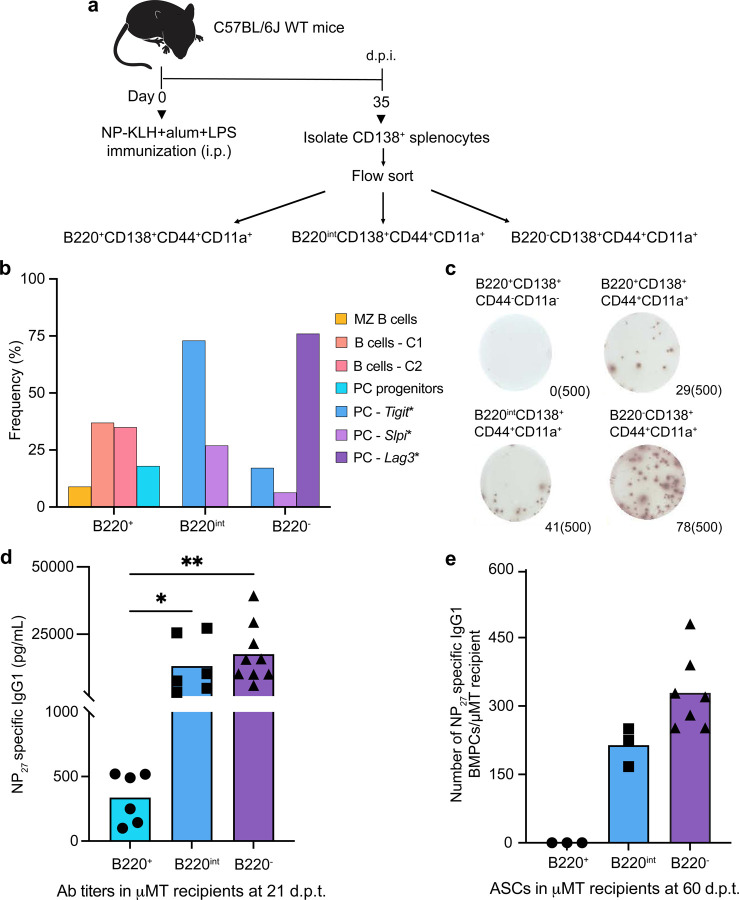
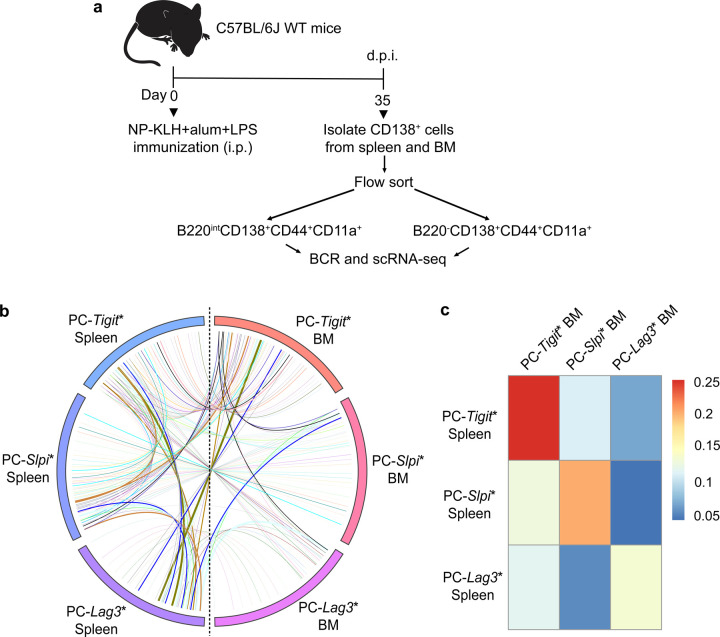
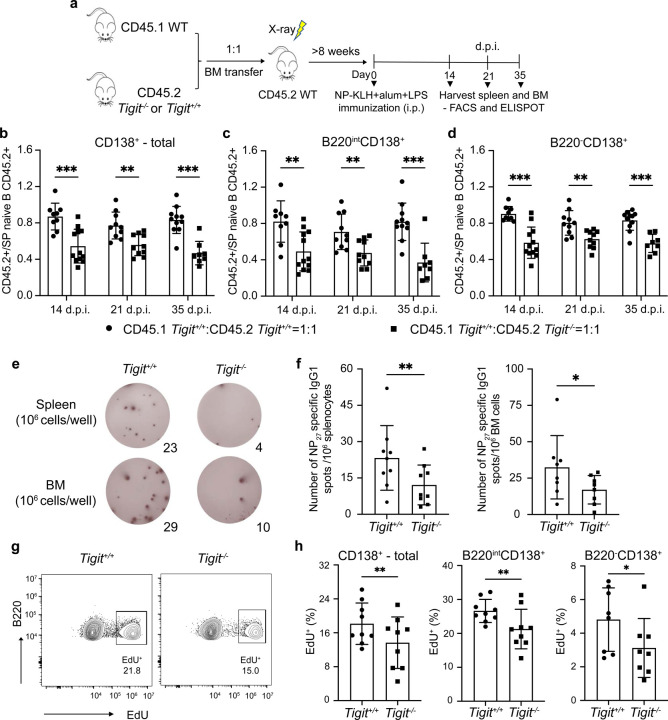
Affinity-matured plasma cells (PCs) of varying lifespans are generated through a germinal center (GC) response. The developmental dynamics and genomic programs of antigen-specific PC precursors remain to be elucidated. Using a model antigen, we demonstrate biphasic generation of PC precursors, with those generating long-lived bone marrow PCs preferentially produced in the late phase of GC response. Clonal tracing using scRNA-seq+BCR-seq in spleen and bone marrow compartments, coupled with adoptive transfer experiments, reveal a novel PC transition state that gives rise to functionally competent PC precursors. The latter undergo clonal expansion, dependent on inducible expression of TIGIT. We propose a model for the proliferation and programming of precursors of long-lived PCs, based on extended antigen encounters followed by reduced antigen availability.

Keywords: BCRseq; Plasma cell precursors; clonal tracking; durability of PCs; scRNAseq; temporal PC dynamics.


Conflict of interest statement

Competing interests: The authors declare no competing interests.

Figures

Extended Data Fig. 1.
Extended Data Fig. 1.. Temporal dynamics of BMPC precursors generated during a GC response
a, A representative flow plot showing the frequency of CD138 expressing cells in the enriched CD138+ splenocytes (positive selection) that were used in adoptive transfer experiments. b,c, Titers of NP-specific IgG1 antibodies in µMT recipients following adoptive transfer of CD138+ splenocytes at 28 d.p.i. (n=6) (b) and 42 d.p.i. (n=7) (c) at indicated d.p.t..
Extended Data Fig. 2.
Extended Data Fig. 2.. scRNA-seq analysis of PC genomic states and trajectories
a, Comb plots displaying the incidence and amplitude of indicated GC B cell, DZ GC and cell cycle genes in designated cluster as in Fig. 2a. b, Plots displaying the incidence and amplitude of indicated PC genes in each cluster as above. c, Plots displaying the incidence and amplitude of indicated marker genes distinguishing the three PC clusters as above. d, Pseudotime analysis of cells in the Monocle 2 trajectory (Fig. 2e). LZ GC B cells were set as the root state for the pseudo trajectory analysis.
Extended Data Fig. 3.
Extended Data Fig. 3.. Delineation of antigen-specific PC genomic states and clonal tracking
a, Experimental design for isolation and analysis of NP-specific B220+ cells from C57BL6/J mice (14 d.p.i.), analyzed by scRNA-seq and BCR-seq. b, Plot displaying the rank order of top 25 IGHV genes expressed in NP-specific B220+ cells (14 d.p.i.). c, d, Plots displaying the rank order of top 50 IGHV genes expressed in CD138+ splenocytes on 35 d.p.i. (c) and 21 d.p.i. (d). Red bars are NP-specific IGHV genes expressed on 14, 21 and 35 d.p.i., blue bars are presumptive KLH-specific IGHV genes expressed on 21 and 35 d.p.i.. e, Mutation frequencies of IGHV1–72*01 gene in splenic PC progenitors (left) and PC clusters (right) on 21 and 35 d.p.i.. f, Pie-charts displaying the proportion of IGHV1–72*01 gene segments harboring high affinity W33L mutations in splenic PCs (21 d.p.i. vs. 35 d.p.i.). g, Combined heatmap of genomic states in the enriched CD138+ splenocytes from both 21 and 35 d.p.i., generated using cellHarmony, for which CD138+ splenocytes (35 d.p.i.) were used as a reference dataset. Columns in heatmap represent cells from 21 and 35 d.p.i. (n=14,068); rows represent MarkerFinder genes (n=413). h, Heatmap of differentially expressed genes (DEGs) in NP- and KLH-specific PC progenitors and indicated PC genomic states (35 vs. 21 d.p.i.) generated using cellHarmony, for which 35 d.p.i. were used as a reference dataset. Rows represent the expression of differentially expressed genes on 35 d.p.i.. Statistical significance was tested by Wilcoxon test (e). *p<0.05; and ***p<0.005.
Extended Data Fig. 4.
Extended Data Fig. 4.. Functional and genomic analysis of BMPC precursors within splenic CD138+ subsets
a, Representative t-SNE plots based on flow cytometry data showing the indicated markers in the enriched CD138+ splenocytes obtained using positive selection at 35 d.p.i.. b, Representative flow plot showing the gating strategy for sorting CD138+ splenic subsets (35 d.p.i.) used in adoptive transfer experiments. Purity of the indicated PC subsets are displayed.
Extended Data Fig. 5.
Extended Data Fig. 5.. Clonal tracking of antigen-specific PC precursors that migrate from spleen to bone marrow
a, Experimental design enabling clonal tracking of PC precursors that migrate from spleen to bone marrow of NP-KLH immunized mice (35 d.p.i.). Coupled scRNA-seq and BCR-seq was performed on indicated cells (including PC progenitors), within each compartment, isolated by flow cytometry. b, Circos plot displaying clones and their genomic states in spleen and bone marrow. Colored bars denote distinctive ICGS2 delineated genomic states in spleen and bone marrow. Colored lines represent clones that contain cells with identical V(D)J rearrangements that span two or more genomic states. c, Heatmap displaying the frequencies of clones spanning indicated genomic states in the spleen and the bone marrow.
Extended Data Fig. 6.
Extended Data Fig. 6.. Tigit deficiency impairs generation of PCs
a, Representative flow plots showing TIGIT expression in B cell and PC subsets. b, Experimental design for the bone marrow chimeric model. c, Representative flow plots showing the proportions of CD45.1+ or CD45.2+ cells in each cell compartment of the chimeras. d, e, Quantification of the normalized proportions of CD45.2+ cells in the indicated cell compartments in the spleen (d) and bone marrow (e) of the chimeras. The proportions of CD45.2+ cells in individual compartments were normalized to the proportion of CD45.2+ cells within naïve B cell subset in the spleen of each mouse. f, Representative flow plots showing the frequencies of KI-67+ cells in TIGIT-expressing cells and their counterparts in the B220int plasma cell subset (35 d.p.i.). g, Quantification of the frequency and mean fluorescence intensity of KI-67+ cells in B220int subset as in (f). Each symbol represents an individual mouse (d,e,g). Statistical significance was tested by two-tailed t-test (d,e,g). **p<0.01; and ****p<0.0001.
Fig. 1.
Fig. 1.. Temporal dynamics of BMPC precursors generated during a GC response
a, Experimental design enabling temporal analysis of BMPC precursors and the durability of their plasma cell progeny. CD138+ splenocytes from NP-KLH immunized mice, at indicated days post-immunization (d.p.i.), were transferred into B cell deficient µMT hosts. NP-specific antibody titers and ELISPOT analyses were performed at indicated days post-transfer (d.p.t.). b, Titers of NP-specific IgG1 antibodies in µMT recipients following adoptive transfer of CD138+ splenocytes (21, 28, 35 and 42 d.p.i.) measured at 21 d.p.t.. c, Titers of NP-specific IgG1 antibodies in µMT recipients (n=6) following adoptive transfer of CD138+ splenocytes (35 d.p.i.) at indicated d.p.t.. d, Titers of NP-specific IgG1 antibodies following adoptive transfer of CD138+ splenocytes (21 d.p.i.) in µMT recipients (n=6) at indicated d.p.t.. e, ELISPOT analysis of NP-specific IgG1+ BMPCs detected in µMT recipients following adoptive transfer of CD138+ splenocytes (21, 28, 35 and 42 d.p.i.) at 120 d.p.t.. f, ELISPOT analysis of NP-specific IgG1+ BMPCs detected in µMT recipients following adoptive transfer of CD138+ splenocytes (21 d.p.i.) at indicated d.p.t.. Each symbol represents an individual mouse (b,e,f). Data are pooled from three independent experiments shown as the mean (b,e,f) or mean ± S.E.M (c,d). Statistical significance was tested by Kruskal Wallis with Dunn’s multiple comparison test (b) or one-way ANOVA with Tukey’s multiple comparison test (c-f). *p<0.05; **p<0.01; and ***p<0.005.
Fig. 2.
Fig. 2.. ScRNA-seq analysis of PC genomic states and trajectories
a, Heatmap generated using cluster-specific marker genes delineated by the MarkerFinder algorithm in AltAnalyze (Methods) for CD138+ splenocytes isolated at 35 d.p.i. (Fig. 1a) and profiled using 5’-end droplet based scRNA-seq. Columns in heatmap represent cells (n=8,813); rows represent markerfinder genes (n=413). Cell clusters were generated using ICGS2 in AltAnalyze (Methods) with inferred genomic states annotated on the top. MZ B cells, marginal zone B cells; B cells - C1, B cells – cluster 1; B cells - C2, B cells – cluster 2; LZ GC B cells, light zone germinal center B cells; DZ GC B cells, dark zone germinal center B cells; PC progenitors, plasma cell progenitors; PC-Tigit*, PCs expressing highest Tigit; PC-Slpi*, PCs expressing highest Slpi; PC-Lag3*, PCs expressing highest Lag3. b, Comb plots displaying the incidence and amplitude of indicated genes in each cluster as in a. c, Developmental trajectory of GC B cells and plasma cells constructed by Monocle 2 (Methods). d, Developmental trajectory of GC B cells and plasma cells constructed by scVelo on 2-D UMAP space (Methods). e, Violin plots displaying the PC gene signature score (Methods) for indicated cell clusters. f, Violin plots displaying the G2/M signature score (Methods) for indicated cell clusters. Each dot (c,d) represents an individual cell. Statistical significance was tested by Benjamini-Hochberg for multiple test corrections (e,f). **p<0.01; ***p<0.005 and ****p<0.0001.
Fig. 3.
Fig. 3.. Delineation of antigen-specific PC genomic states and clonal tracking
a, Heatmap derived from Fig. 2a by filtering antigen-specific cells based on BCR-seq (Methods). Columns and rows in heatmap represent cells (n=2,613) and MarkerFinder genes (n=413), respectively. b, Developmental trajectory analysis of the antigen-specific cells based on Monocle 2. Cells are color coded based on ICGS2 cluster identity as in Figure 2a. c,d, Pie-charts displaying the NP-dominant IGHV1–72*01 (Vh186.2) (c) and IGHV1–53*01 clones (d), colored by the ICGS2 cluster identities manifested within each clone. Green sectors are cells that express the rearranged IGHV1–72*01 or IGHV1–53*01 gene whereas red sectors are IGHV1–72*01 or IGHV1–53*01 clones that bear identical V(D)J rearrangements in their heavy and light chain loci. Outermost sectors display the ICGS2 cluster identities of cells within the clones. e, Bar plot displaying the key gene ontology pathways associated with the upregulated genes in PC progenitors (35 vs. 21 d.p.i.). f, Bar plot displaying the gene ontology pathways associated with the upregulated genes in PC-Tigit* cluster (35 vs. 21 d.p.i.). g, Bar plot displaying the number of cells per clone in the indicated genomic states at 35 or 21 d.p.i.. Each dot (b) represents an individual cell. Selected genes within gene ontology pathways are displayed (e,f). Each symbol (g) represents a clone within the indicated genomic state. N.D. not detectable (g).
Fig. 4.
Fig. 4.. Functional and genomic analysis of BMPC precursors within splenic CD138+ subsets
a, Experimental design involving designated splenic CD138+ subsets isolated by flow cytometry from NP-KLH immunized mice (35 d.p.i.) and analyzed by scRNA-seq as well as by adoptive transfer into B cell deficient µMT hosts. b, Bar plot displaying the frequency of indicated genomic states, delineated by clustering of scRNA-seq data using ICGS2 reference clusters and cellHarmony (Methods). c, ELISPOT analysis of NP-specific IgG1+ ASCs detected in indicated subsets measured at 35 d.p.i.. d, Titers of NP-specific IgG1 antibodies in µMT recipients following adoptive transfer of CD138+ splenic subsets (35 d.p.i.) measured at 21 d.p.t.. e, ELISPOT analysis of NP-specific IgG1+ BMPCs detected in µMT recipients following adoptive transfer of indicated CD138+ subsets (60 d.p.t.). Each symbol represents an individual mouse (d,e). Data are pooled from three different experiments (c,d,e). Statistical significance was tested by Kruskal Wallis with Dunn’s multiple comparison test (d,e). *p<0.05; and **p<0.01.
Fig. 5.
Fig. 5.. Clonal tracking of antigen-specific PC precursors migrating from spleen to bone marrow
a, Experimental design enabling clonal tracking of PC precursors that migrate from spleen to bone marrow of NP-KLH immunized mice (35 d.p.i.). Coupled scRNA-seq and BCR-seq was performed on indicated cells, within each compartment, isolated by flow cytometry. b, Circos plot displaying clones and their genomic states in spleen and bone marrow. Colored bars denote distinctive ICGS2 delineated genomic states in spleen and bone marrow. Colored lines represent clones that contain cells with identical V(D)J rearrangements that span two or more genomic states. c, Heatmap displaying the frequencies of clones spanning indicated genomic states in the spleen and bone marrow.
Fig. 6.
Fig. 6.. Tigit deficiency impairs generation of PCs
a, Experimental design of the bone marrow chimeric mouse model used to analyze function of Tigit in the generation of PCs after NP-KLH immunization. b-d, Quantitative analysis of the normalized proportions of CD45.2+ cells in the CD138+ splenic compartment of control (CD45.1 Tigit+/+:CD45.2 Tigit+/+=1:1) and experimental (CD45.1 Tigit+/+:CD45.2 Tigit−/−=1:1) chimeric mice: (b) total, (c) B220int and (d) B220 subsets at the indicated d.p.i.. The proportions of CD45.2+ cells in the various CD138+ subsets were normalized based on the fraction of CD45.2+ naïve splenic B cells in each chimeric mouse. e,f, ELISPOT analysis of NP-specific IgG1+ ASCs (Tigit+/+ or Tigit−/− ) in spleen and bone marrow compartment of chimeric mice after NP-KLH immunization (35 d.p.i.). Splenic and bone marrow cells were sorted based on CD45.1 or CD45.2 expression and plated for ELISPOT analyses. Representative images of NP-specific IgG1+ ASCs at 35 d.p.i. (e) and quantitative analysis (f). g, Representative flow plots showing the percentage of EdU+ cells in B220intCD138+ subsets (Tigit+/+ or Tigit−/−) in the spleen of chimeric mice after NP-KLH immunization (35 d.p.i.). h, Plots displaying the EdU+ cells in total (left), B220int (middle) and B220 (right) CD138+ subsets (Tigit+/+ or Tigit−/−) in the spleen of chimeric mice after NP-KLH immunization (35 d.p.i.). Each symbol represents an individual mouse (b-d,f,h). Data are representative of three independent experiments (b-h) and shown as the mean ± SEM. Statistical significance was tested by two-tailed t-test (b-d,f,h). *p<0.05; **p<0.01; ***p<0.005 and ****p<0.0001.

Similar articles

References

    1. Benner R., van Oudenaren A. & de Ruiter H. Antibody formation in mouse bone marrow: IX. Peripheral lymphoid organs are involved in the initiation of bone marrow antibody formation. Cellular Immunology 34, 125–137 (1977). - PubMed
    1. Benner R., Hijmans W. & Haaijman J.J. The bone marrow: the major source of serum immunoglobulins, but still a neglected site of antibody formation. Clin Exp Immunol 46, 1–8 (1981). - PMC - PubMed
    1. Slifka M.K., Matloubian M. & Ahmed R. Bone marrow is a major site of long-term antibody production after acute viral infection. Journal of virology 69, 1895–1902 (1995). - PMC - PubMed
    1. Smith K.G.C., Hewitson T.D., Nossal G.J.V. & Tarlinton D.M. The phenotype and fate of the antibody-forming cells of the splenic foci. European Journal of Immunology 26, 444–448 (1996). - PubMed
    1. Manz R.A., Thiel A. & Radbruch A. Lifetime of plasma cells in the bone marrow. Nature 388, 133–134 (1997). - PubMed

Publication types

LinkOut - more resources