. 2023 Sep 1;26(10):107796.
doi: 10.1016/j.isci.2023.107796. eCollection 2023 Oct 20.

Stromal cells-specific retinoic acid determines parturition timing at single-cell and spatial-temporal resolution

Affiliations

Stromal cells-specific retinoic acid determines parturition timing at single-cell and spatial-temporal resolution

Hui Zhao et al. iScience. .

Abstract

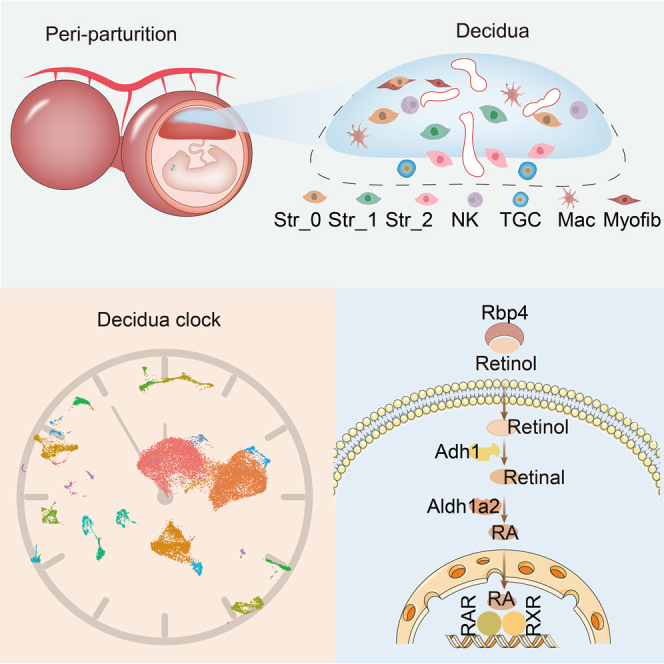
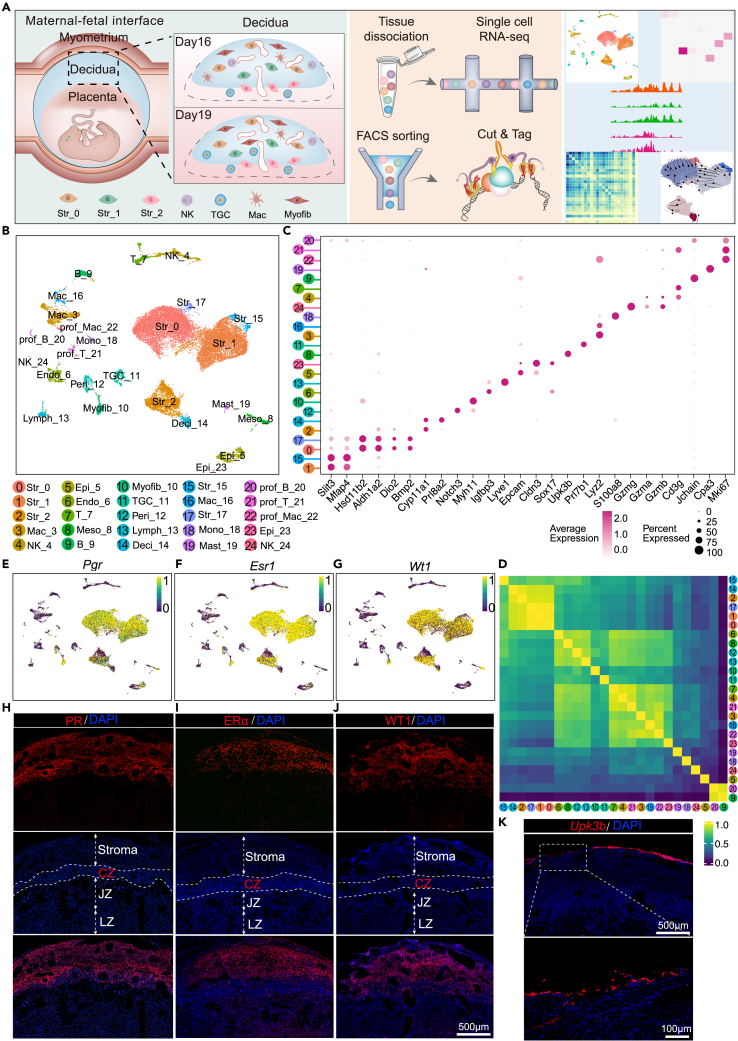
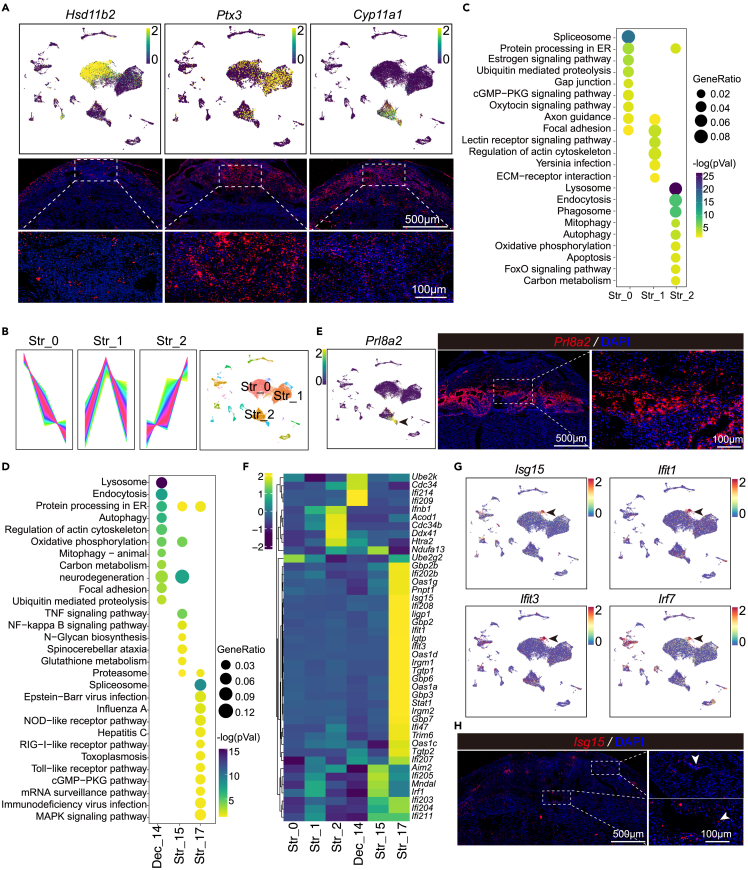
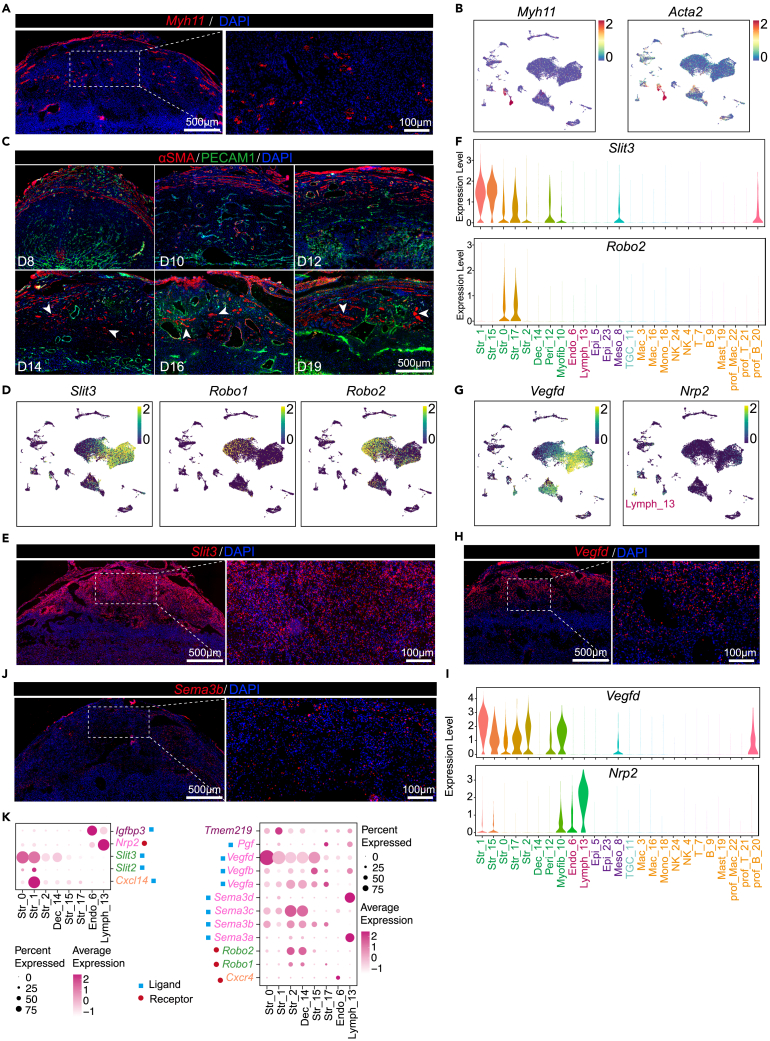
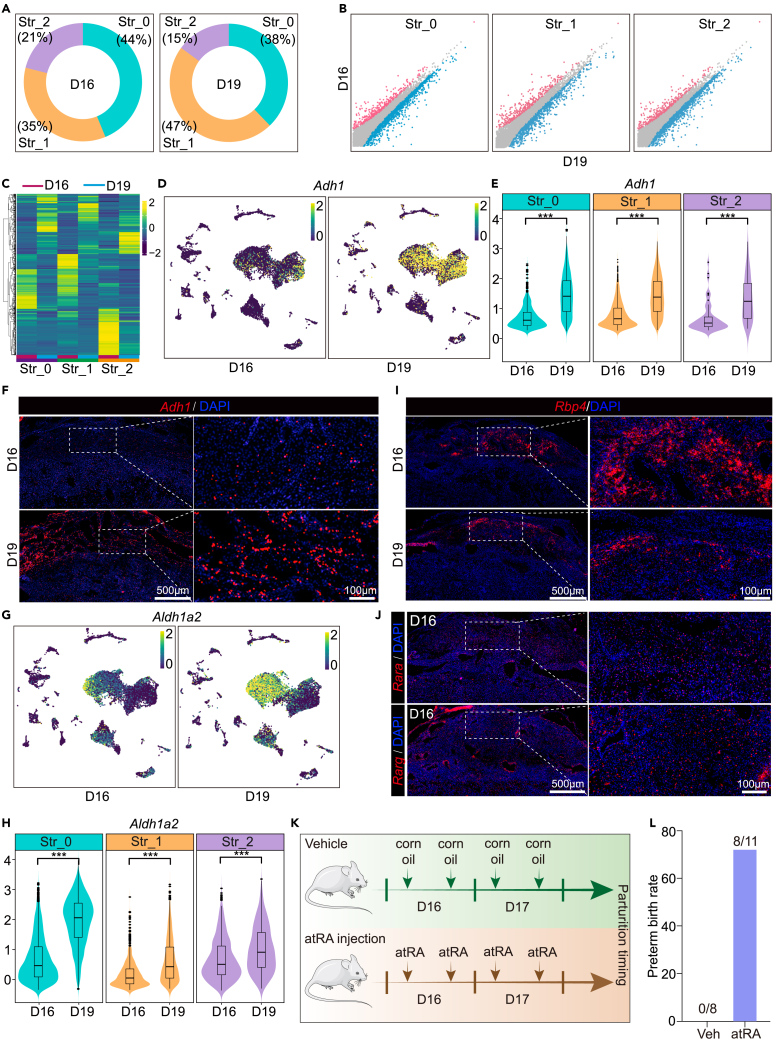
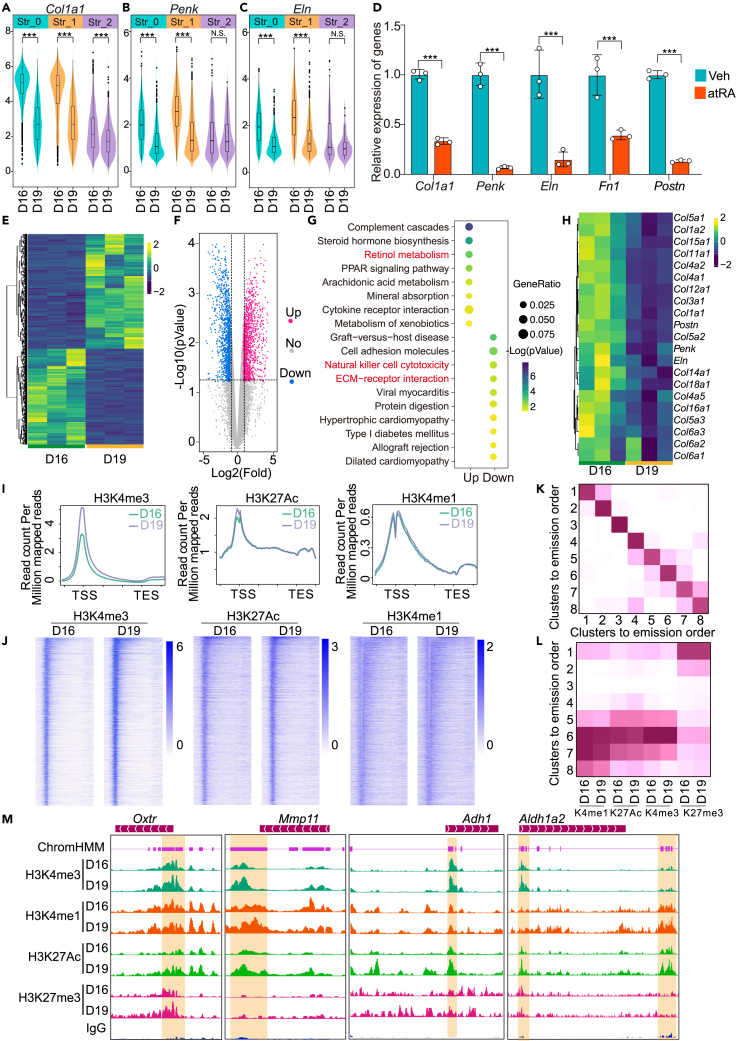
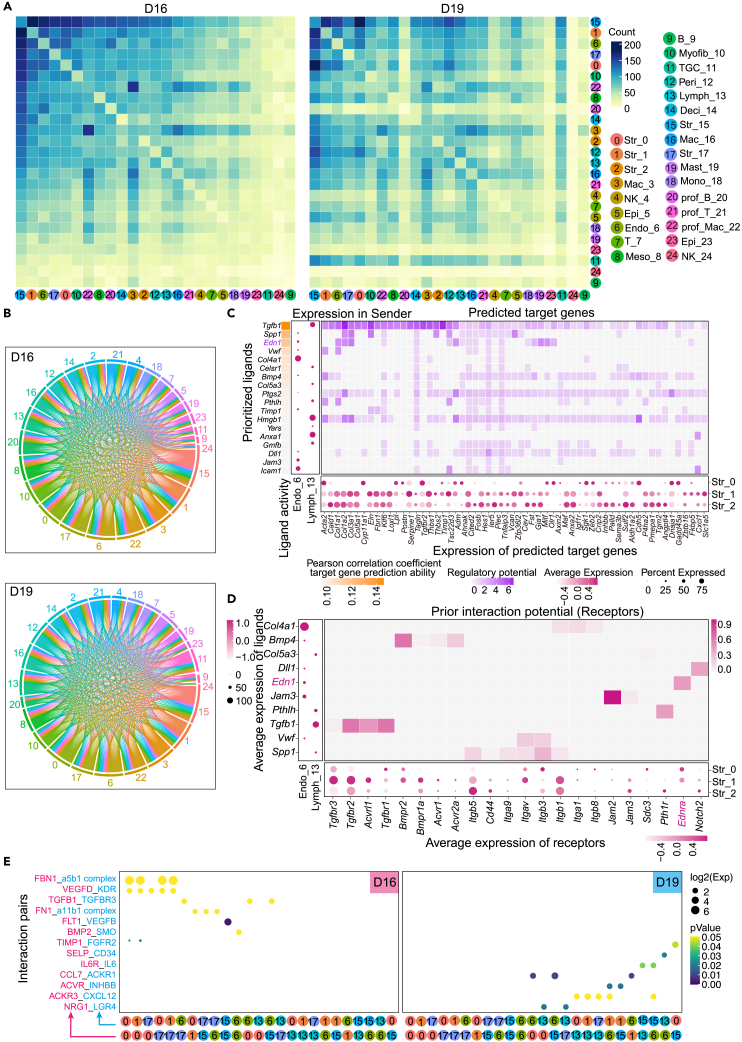
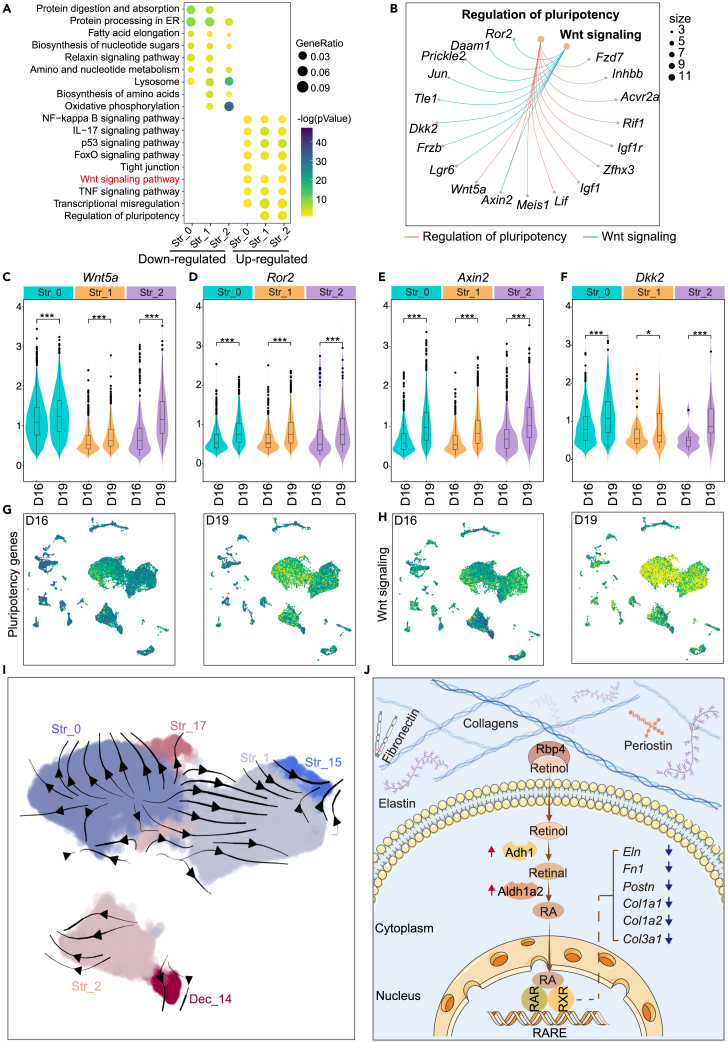
The underlying mechanisms governing parturition remain largely elusive due to limited knowledge of parturition preparation and initiation. Accumulated evidences indicate that maternal decidua plays a critical role in parturition initiation. To comprehensively decrypt the cell heterogeneity in decidua approaching parturition, we investigate the roles of various cell types in mouse decidua process and reveal previously unappreciated insights in parturition initiation utilizing single-cell RNA sequencing (scRNA-seq). We enumerate the cell types in decidua and identity five different stromal cells populations and one decidualized stromal cells. Furthermore, our study unravels that stromal cells prepare for parturition by regulating local retinol acid (RA) synthesis. RA supplement decreases expression of extracellular matrix-related genes in vitro and accelerates the timing of parturition in vivo. Collectively, the discovery of contribution of stromal cells in parturition expands current knowledge about parturition and opens up avenues for the intervention of preterm birth (PTB).

Keywords: Cell biology; Women's health.


Conflict of interest statement

The authors declare no competing interests.

Figures

None
Graphical abstract
Figure 1
Figure 1
The single-cell landscape of mouse D16 and D19 decidua (A) Diagram illustrates the experimental workflow for single-cell transcriptome and epigenome profiling in days 16 and 19 decidua. Str_0: stromal cells 0; Str_1: stromal cells 1; Str_2: stromal cells 2; NK: natural killer cells; TGC: trophoblast giant cells; Mac: macrophages; Myofib: myofibroblast cells. (B) Uniform manifold approximation and projection (UMAP) plot of the major cell types in days 16 and 19 decidua. Dots represent individual cells, and colors represent different cell populations. (C) The expression of marker genes across different cell types. (D) The Pearson correlation of genes’ expression of different cell types. (E–G) UMAP visualization of the expression of selected marker genes Pgr (D), Esr1 (F), and Wt1 (G) in stromal cells. (H–J) Immunostaining of progesterone receptor (PR) (H), estrogen receptor alpha (ERα) (I), and WT1 transcription factor (WT1) (J) in day 16 decidua. CZ: compacting zone; JZ: junctional zone; LZ: labyrinth zone. (K) Localization of Upk3b mRNA in day 16 decidua.
Figure 2
Figure 2
The signature of different stromal cells (A) The expression and localization of Hsd11b2, Ptx3, and Cyp11a1 in Str_0, Str_1, and Str_2, respectively. (B) Genes highly express in Str_0, Str_1, and Str_2 by gene expression clustering analysis. (C) The KEGG enrichment of genes highly express in Str_0, Str_1, and Str_2 stromal cells; dot size: number of genes in data attributed to each KEGG term; color bar: the log10 transformation of enrichment p value. (D) KEGG enrichment of genes highly express in Dec_14, Str_15, and Str_17 cells; dot size: number of genes in data attributed to each KEGG term; color bar: the log10 transformation of enrichment p value. (E) The expression and localization of Prl8a2 mRNA in day 16 decidua. Arrow head indicated the expression of Prl8a2. (F) Heatmap of genes in interferon β (INFβ) signaling pathway in different stromal cells and decidualized stromal cells. Colors represent z-scores normalized expression of genes. (G) The expressions of INFβ signaling pathway genes Isg15, Ifit1, Ifit3, and Irf7 in Str_17. Arrow heads indicate the expression of these genes. (H) The localization of Isg15 mRNA in day 16 decidua.
Figure 3
Figure 3
The signaling pathway of stromal cells migration (A) The localization of Myh11 mRNA in day 16 decidua by SCRINSHOT. (B) The expression of smooth muscle markers Myh11 and Acta2 in decidua. (C) Immunostaining of αSMA (red), PECAM1 (green), and DAPI (blue) in decidua from days 8–19. (D) The UMAP visualization of the expression of Slit3 and its receptors Robo1 and Robo2 in different cell types. (E) The localization of Slit3 mRNA in day 16 decidua. (F) Violin plots show the expression levels for Slit3 and Robo2 in different cell types. (G) The UMAP visualization of Vegfd and its receptor Nrp2 in different cell types. (H) The localization of Vegfd mRNA in day 16 decidua. (I) Violin plots show the expression levels for Vegfd and Nrp2 in different cell types. (J) Localization of Sema3b mRNA in day 16 decidua. (K) The expressions of genes associated with migration signaling pathways. The same color in left and right represent genes in the same signaling pathway with ligands marked with blue and receptors marked with red. The size of the dot represents the percent of cells expressed with indicated genes and the color represents the average expression of indicated gene.
Figure 4
Figure 4
Decidual retinoic acid synthesis during parturition preparation (A) Stromal cell composition in days 16 (left circle) and 19 (right circle) decidua. (B) Scatterplots depict differentially expressed genes in Str_0, Str_1, and Str_2 between day 16 and day 19. Red and blue represent genes specifically expressed in day 16 and day 19, respectively. (C) Heatmap of the differentially expressed genes in Str_0, Str_1, and Str_2 between day 16 and day 19. Color bar represents Z score normalized expression of genes. (D) UMAP visualization of the expression of Adh1 in days 16 and 19 stromal cells in decidua. (E) Quantitative expression of Adh1 in distinct stromal cells between days 16 and 19. ∗∗∗p < 0.001, Wilcoxon tests. (F) Localization of Adh1 mRNA in days 16 and 19 decidua. (G) UMAP visualization of the expression of Aldh1a2 in days 16 and 19 stromal cells in decidua. (H) Quantitative expression of Aldh1a2 in distinct stromal cells between days 16 and 19. ∗∗∗p < 0.001, Wilcoxon tests. (I) Localization of Rbp4 mRNA in days 16 and 19 decidua. (J) Localization of Rara and Rarg mRNAs in days 16 and 19 decidua. (K) Experimental schedule of atRA administration induced preterm birth in D16-D17 pregnant female mice (i.p. injection with 800 μg/mouse each time). (L) The ratio of preterm birth after atRA injection.
Figure 5
Figure 5
The downstream genes of RA and the epigenetic landscape of stromal cells approaching parturition (A–C) Quantitative expression of Col1a1 (A), Penk (B), and Eln (C) in distinct stromal cells between days 16 and 19. ∗∗∗p < 0.001, Wilcoxon tests. (D) Relative expression of Col1a1, Penk, Eln, Fn1, and Postn mRNAs in day 16 cultured stromal cell after 5 μM atRA treatment for 24 h. ∗∗∗p < 0.001, Student’s t test. Data are represented as mean ± SEM (n = 3). (E) Heatmap of differentially expressed genes by bulk RNA-seq in whole decidua from days 16 and D19; Colors represent the Z score normalized expression of genes. (F) Volcano plot of differentially expressed genes by bulk RNA-seq in whole decidua between days 16 and 19. Red color represents of upregulated genes in day 19 decidua with p < 0.05 and fold change >2; blue color represents downregulated genes in day 19 decidua with p < 0.05 and fold change <0.5; gray color represents not significantly change genes in these two groups. (G) Dot plot of enriched signaling pathways based on differentially expressed genes by bulk RNA-seq between day 16 and day 19 decidua. (H) Heatmap of extracellular matrix genes in days 16 and 19 decidua by bulk RNA-seq. (I) Metaplot of H3K4me3, H3K27Ac, and H3K4me1 modification across gene body. TSS, transcription start site; TES, transcription end site. (J) Heatmap of H3K4me3, H3K27Ac, and H3K4me1 distribution across gene body in days 16 and 19 stromal cells. (K) Chromatin state adjacency frequencies (how often 2 chromatin states neighbor each other) defined by multivariate hidden Markov model-based method (ChromHMM) via integrating chromatin modification of H3K4me1, H3K4me3, H3K27Ac, and H3K27me3. Genome is segmented into 200-bp intervals based on state classifications and divided into 8 different modification signatures. (L) Definition of distinctive genomic regions marked by H3K4me1, H3K4me3, H3K27Ac, and H3K27me3 which learned by ChromHMM based on the CUT&Tag data. (M) The visualizations of H3K4me3, H3K4me1, H3K27Ac, and H3K27me3 modification at Oxtr, Mmp11, Adh1, and Aldh1a2 loci in IGV. The magenta track represents pattern six defined by ChromHMM in (L) with higher modification of H3K4me1, H3K27Ac, and H3K4me3 and weaker modification of H3K27me3. The red boxes highlight the regions with differential modifications in one of H3K4me3, H3K4me1, and H3K27Ac.
Figure 6
Figure 6
Cell-to-cell connection in day 16 and day 19 decidua (A) The abundance of connection between different cell types in days 16 and 19 decidua utilizing CellPhoneDB. (B) The circular plot represents outgoing signaling and incoming signaling among different cell types in days 16 and 19 decidua analyzed by CellPhoneDB. (C) The interaction between endothelium and lymphatic endothelial cells with the major stromal cells. The most left is the prioritized ligands defined by NicheNet. Pearson correlation indicates the ability of each ligand to its target genes, and better predictive ligands are thus ranked higher. The dot plots represent the expression of ligands in endothelium and lymphatic endothelial cells and their target genes in different stromal cells. Heatmap shows the predicted ligands activity by NicheNet on their target genes in different stromal cells. (D) Heatmap shows the bona fide interactions between the ligands in endothelium and lymphatic endothelial cells and their receptors in different stromal cells. Dot plots represent the average expression of ligands and their receptors in senders and receivers, respectively. (E) The differential changed signaling pathways between endothelium, lymphatic endothelial cells, and different stromal cells in day 16 and day 19 defined by CellPhoneDB. Among them, BMP2-SMO and VEGFD-KDR are mainly enriched in day 16 decidua, while SELP-CD34 and ACVR-INHBB are mainly enriched in day 19. The size of dot represents the expression of indicated ligand (magenta) and its receptor (blue) in different cell types and color bar represents their enrich significance. The numbers in the colored round indicate different cell types as annotated in (A).
Figure 7
Figure 7
The activity of WNT signaling pathway in stromal cells between day 16 and day 19 (A) The functional enrichment analysis of differentially expressed genes among three stromal cells between day 16 and day 19 by scRNA-seq. (B) The networks of pluripotency and WNT signaling pathway-related genes. (C–F) Quantitative expression of Wnt5a (C), Ror2 (D), Axin2 (E), and Dkk2 (F) in distinct stromal cells between days 16 and 19. ∗∗∗p < 0.001, Wilcoxon tests. (G) Expression of pluripotency signature genes in day 16 and day 19 decidua. (H) Expression of WNT signaling pathway signature genes in day 16 and day 19 decidua. (I) The RNA velocity map of different stromal cells. (J) Summary diagram of the retinoid pathway in parturition. Retinol is transferred into stromal cells by RBP4 and metabolized to retinal by retinol dehydrogenases ADH1. Retinal is further converted to retinoic acid (RA) by ALDH1A2. After binding with its nuclear receptors RARs and RXRs (heterodimers or homodimers), RA affects the expression of sort of extracellular matrix-associated genes. RBP4, retinol-binding protein 4; RAR, retinoic acid receptor; RARE, retinoic acid response element; RXR, retinoid X receptor; RA, retinoic acid.

Similar articles

Cited by

References

    1. Goldenberg R.L., Culhane J.F., Iams J.D., Romero R. Epidemiology and causes of preterm birth. Lancet. 2008;371:75–84. doi: 10.1016/S0140-6736(08)60074-4. - DOI - PMC - PubMed
    1. Muglia L.J., Katz M. The enigma of spontaneous preterm birth. N. Engl. J. Med. 2010;362:529–535. doi: 10.1056/NEJMra0904308. - DOI - PubMed
    1. Norwitz E.R., Bonney E.A., Snegovskikh V.V., Williams M.A., Phillippe M., Park J.S., Abrahams V.M. Molecular Regulation of Parturition: The Role of the Decidual Clock. Cold Spring Harb. Perspect. Med. 2015;5:a023143. doi: 10.1101/cshperspect.a023143. - DOI - PMC - PubMed
    1. Moster D., Lie R.T., Markestad T. Long-term medical and social consequences of preterm birth. N. Engl. J. Med. 2008;359:262–273. doi: 10.1056/NEJMoa0706475. - DOI - PubMed
    1. Cappelletti M., Doll J.R., Stankiewicz T.E., Lawson M.J., Sauer V., Wen B., Kalinichenko V.V., Sun X., Tilburgs T., Divanovic S. Maternal regulation of inflammatory cues is required for induction of preterm birth. JCI Insight. 2020;5:e138812. doi: 10.1172/jci.insight.138812. - DOI - PMC - PubMed

LinkOut - more resources