. 2023 Aug 19;26(10):107668.
doi: 10.1016/j.isci.2023.107668. eCollection 2023 Oct 20.

Bifidobacterium affects antitumor efficacy of oncolytic adenovirus in a mouse model of melanoma

Affiliations

Bifidobacterium affects antitumor efficacy of oncolytic adenovirus in a mouse model of melanoma

Lorella Tripodi et al. iScience. .

Abstract

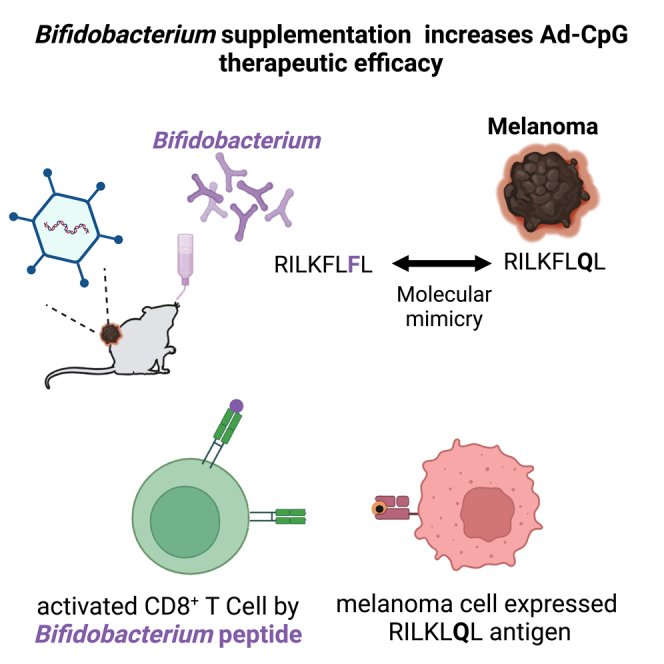
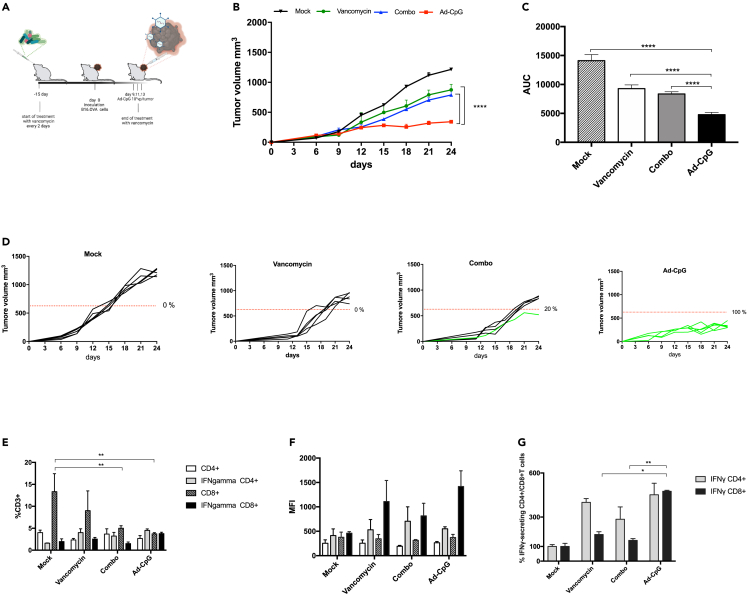
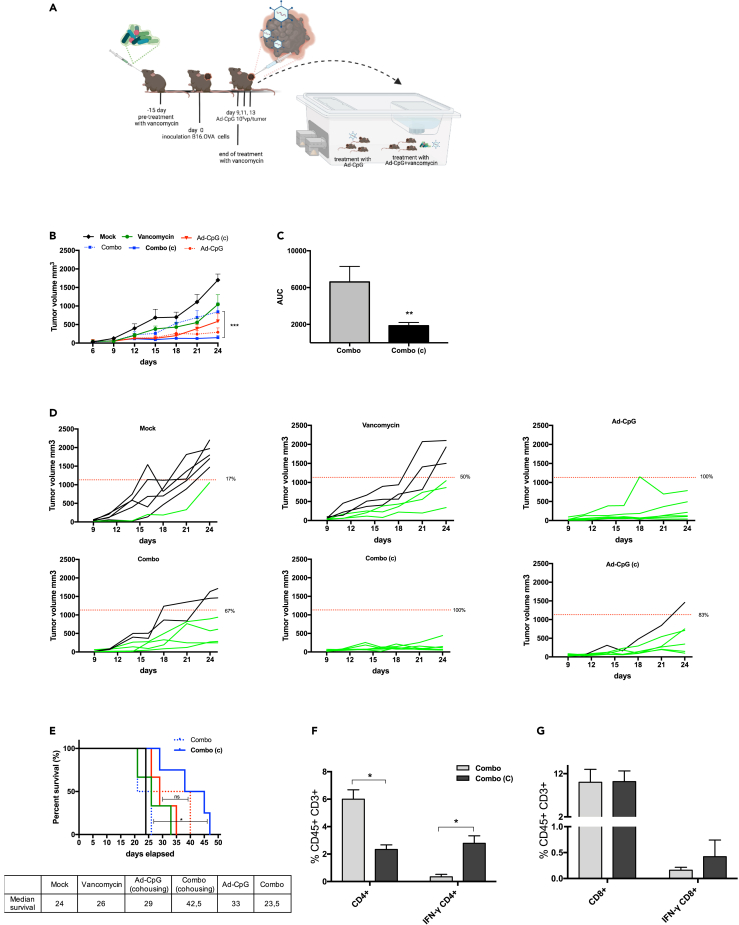
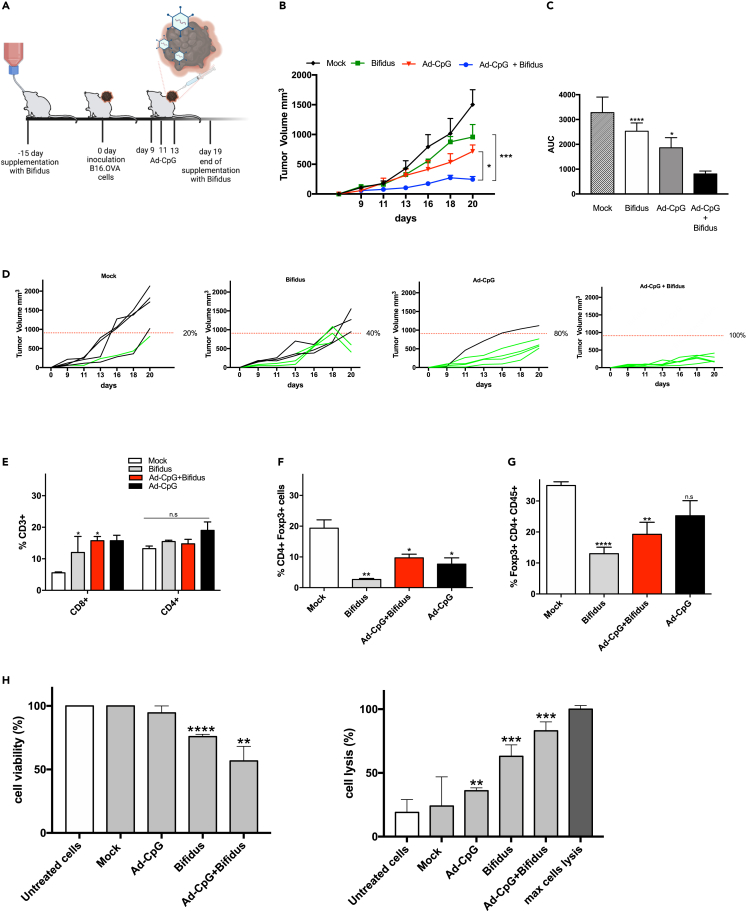
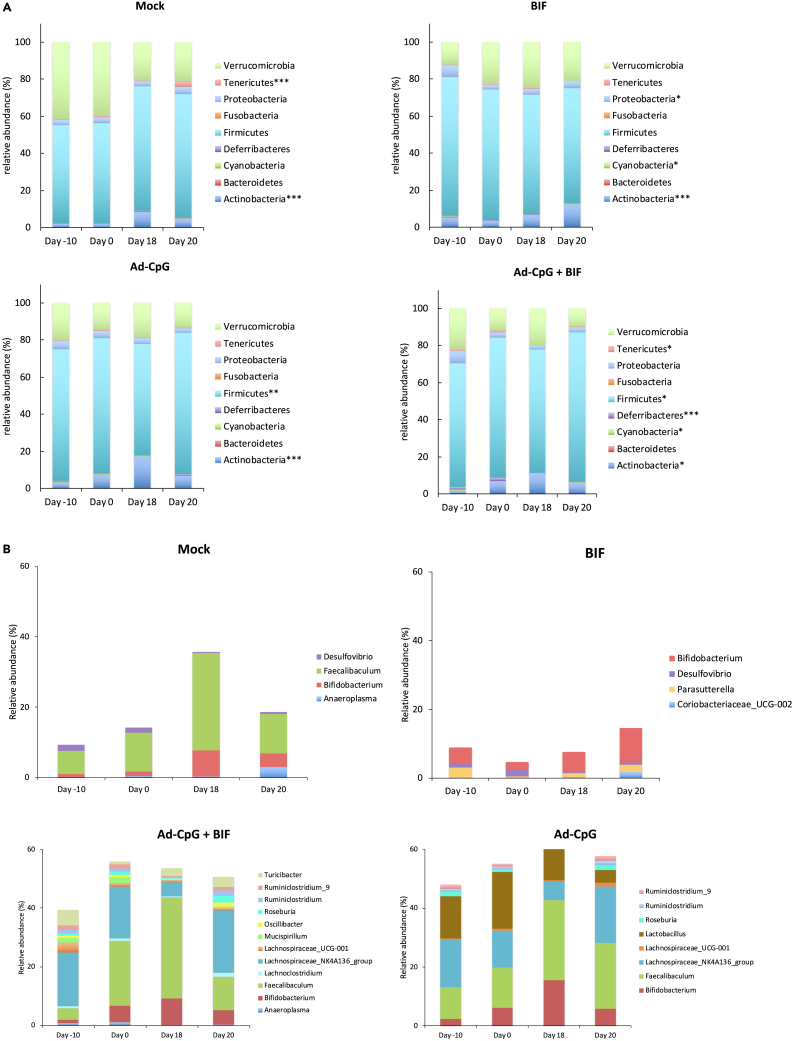
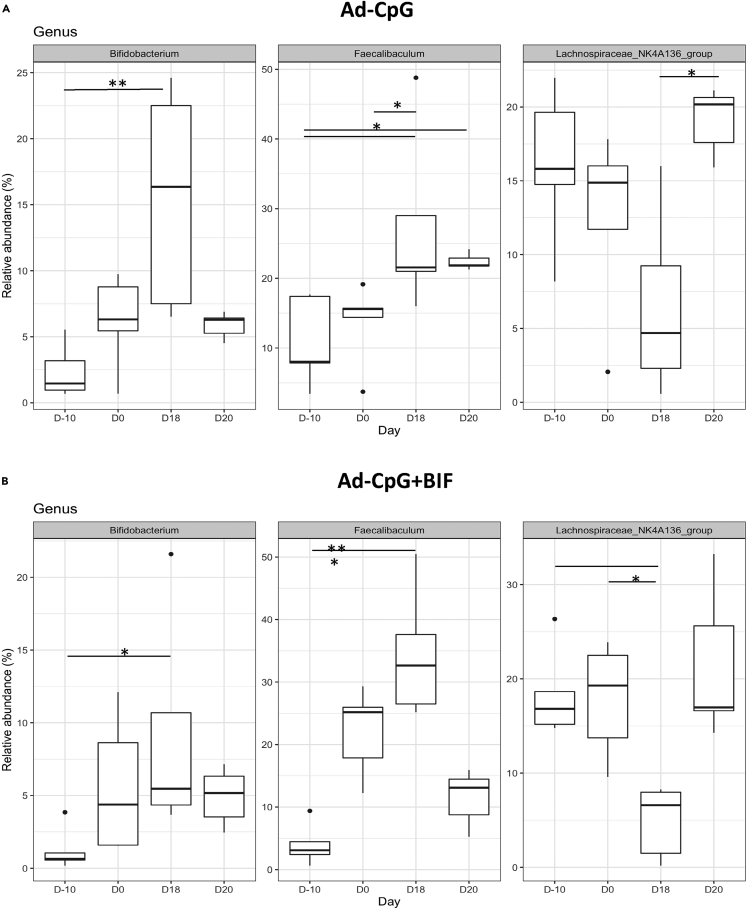
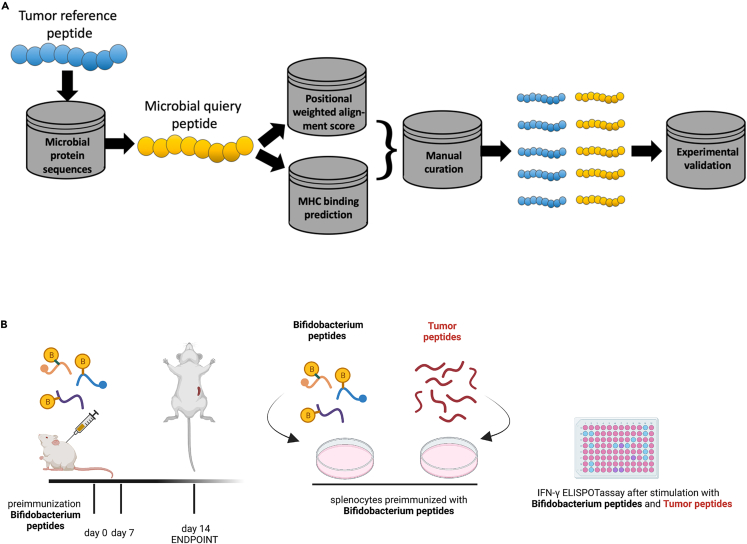
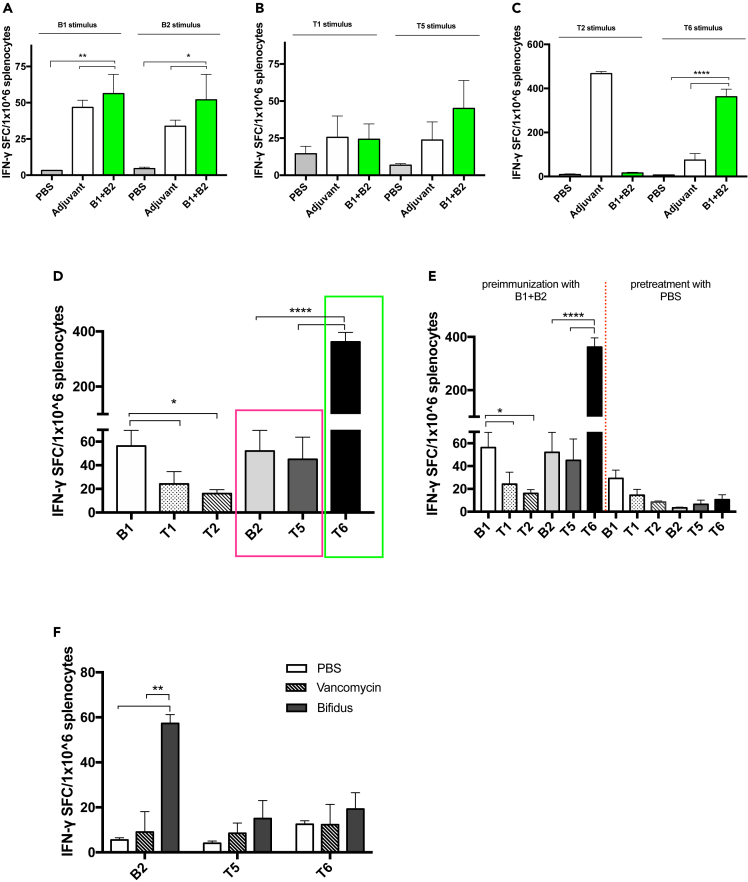
Gut microbiota plays a key role in modulating responses to cancer immunotherapy in melanoma patients. Oncolytic viruses (OVs) represent emerging tools in cancer therapy, inducing a potent immunogenic cancer cell death (ICD) and recruiting immune cells in tumors, poorly infiltrated by T cells. We investigated whether the antitumoral activity of oncolytic adenovirus Ad5D24-CpG (Ad-CpG) was gut microbiota-mediated in a syngeneic mouse model of melanoma and observed that ICD was weakened by vancomycin-mediated perturbation of gut microbiota. Ad-CpG efficacy was increased by oral supplementation with Bifidobacterium, reducing melanoma progression and tumor-infiltrating regulatory T cells. Fecal microbiota was enriched in bacterial species belonging to the Firmicutes phylum in mice treated with both Bifidobacterium and Ad-CpG; furthermore, our data suggest that molecular mimicry between melanoma and Bifidobacterium-derived epitopes may favor activation of cross-reactive T cells and constitutes one of the mechanisms by which gut microbiota modulates OVs response.

Keywords: Cancer; Microbiome; Virology.


Conflict of interest statement

Vincenzo Cerullo is founder and shareholder at VALO therapeutics.

Figures

None
Graphical abstract
Figure 1
Figure 1
Perturbation of gut microbiome reduces the efficacy of Ad-CpG treatment in a syngeneic mouse model of melanoma (A) Experimental design: vancomycin was administered by oral gavage every 2 days, starting 15 days before tumor implantation until the first Ad-CpG injection. At day 0, 3.5 × 105 B16.OVA cells were injected in the right flank of female C57BL/6J mice (n = 5 per group). Ad-CpG was administered intratumorally on days 9, 11, and 13. (B) tumor-bearing mice (n = 5 per group) were treated with saline solution (Mock), 100 μL of vancomycin (10 mg/mL) by oral gavage, 1 × 10E9 vp/tumor of Ad-CpG and with a combination of Ad-CpG + vancomycin. Tumor size was determined for each mouse with a digital caliper; results are graphed as mean for each treatment groups +/− standard single error of the mean (SEM); statistical difference has been determined with two-way ANOVA (∗p < 0.05; ∗∗p < 0.01; ∗∗∗p < 0.001; p < 0.0001). (C) Average area under the curves relative to tumor growth in the different experimental groups indicated as mean ± SEM. The statistical significance was evaluated by unpaired t test with Welch’s correction and the asterisks indicate statistical significance (∗∗∗∗p < 0.0001). (D) Growth curves for each tumor are reported as a single graph for each group (n = 5 animals per group). The percentage of responders (mice with an absolute tumor volume lower than 627.25 mm3) for each group is indicated. Volumes of tumors in responders are represented in green, whereas tumors volumes in non-responder are represented by black curves. (E) Percentages of total CD3+ CD4+ T lymphocytes, IFN-γ CD4+ CD3+, CD3+ CD8+ T lymphocytes and IFN-γ CD8+ CD3+ T cells present in the tumors. The statistical significance was evaluated by two-way ANOVA test using Tukey’s multiple comparisons test and the asterisks indicate statistical significance (∗∗p < 0.01) compared to CD8+CD3+ of tumors in mock-treated mice. (F) Mean Fluorescent Intensity (MFI) of T cells represented in plot E as average +/− SEM. (G) Percentages of IFN-γ+ CD4+ CD3+ and IFN-γ+ CD8+ CD3+ T cells calculated as ratio of IFNγ+ CD4+ CD3+/CD4+ CD3+ and ratio IFNγ+ CD8+ CD3+/CD8+ CD3+ and normalized on ratio value of mock group. The statistical significance was evaluated by paired student’s t test and the asterisks indicate statistical significance (∗p < 0.05; ∗∗p < 0.01) compared to the percentage of IFNγ+ CD8+ CD3+ of Ad-CpG-treated tumor. The data are represented as mean ± SEM.
Figure 2
Figure 2
Cohousing with antibiotic-untreated mice can restore Ad-CpG efficacy in vancomycin-treated mice (A) Experimental design of the cohousing experiment: vancomycin was administered by oral gavage every two days, 15 days before tumor implantation. At day 0, 3.5 × 105 B16.OVA cells were injected in the flank of female C57BL/6J mice (n = 6 per group). Ad-CpG was administered intratumorally on days 9, 11, and 13. After the third injection of the virus, we cohoused the group treated with the combined regimen with mice treated with only Ad-CpG. The groups involved in the cohousing were indicated as (Ad-CpG (c) and (Combo (c). Tumor-bearing mice (n = 6 per group) were treated with saline solution (Mock), 100 μL of 10 mg/mL vancomycin (Vancomycin), 1 × 10E9 vp/tumor of adenovirus (Ad-CpG) and with a combination of Ad-CpG and vancomycin (Combo). (B) Tumor size was measured with a digital caliper and results are graphed as mean ± SEM; statistical difference has been determined with two-way ANOVA (∗∗∗p < 0.001). (C) Average area under the curves relative to tumor growth in the different experimental groups is indicated as mean ± SEM; the statistical significance was evaluated by unpaired t test with Welch’s correction and the asterisks indicate statistical significance (∗∗p < 0.01). (D) Growth curves for each tumor are reported as a single graph for each group (n = 6 animals per group). Percentage of responders (mice with an absolute tumor volume lower than 1132.22 mm3) for each group is indicated. The threshold level to evaluate tumor-bearing mice responder to Ad-CpG therapy was defined by the median value of volumes of the saline solution-treated tumors on day 21. Volumes of tumors in responders are represented in green, whereas tumors volumes in non-responders are represented by black curves. (E) Survival curves relative to the experimental groups represented in panel B. The median survival of each group is reported in the table below the graph. The log rank Mantel-Cox analysis was used to calculate the p value (∗p < 0.05) of the survival curves. (F) Percentage of IFN-γ CD4+/CD4+ T cells ratio. The statistical significance was examined by paired student’s t test and the asterisks indicate statistical significance (∗p < 0.05) compared to control group, treated with combined regimen and kept isolated (Combo). (G) Percentage of IFN-γ CD8+/CD8+ T cells ratio. Results are graphed as mean for each treatment group +/− SEM.
Figure 3
Figure 3
Co-administration of Ad-CpG and Bifidobacterium spp. reduces melanoma growth in a syngeneic mouse model by reducing the activity of CD4+ regulatory T cells (A and B) Experimental design: Bifidobacterium spp. cocktail (Bifidus) was added to the drinking water, every 2 days, starting 15 days before the cancer cell inoculation and until day 19. At day 0, 3.5 × 105 B16.OVA cells were injected in the right flank of female C57BL/6J mice (n = 5 per group). Ad-CpG was administered intratumorally on days 9, 11 and 13; B) tumor-bearing mice (n = 5 per group) were treated with saline solution (Mock), 10E9 CFU/mL of Bifidus (Bifidus), 1 × 10E9 vp/tumor of adenoviral therapy (Ad-CpG) and with a combination of the two monotherapies (Ad-CpG + Bifidus). Tumor size was determined for each mouse; results are graphed as mean for each treatment group +/− SEM; the statistical difference has been determined with two-way ANOVA (∗p < 0.05; ∗∗∗p < 0.001). (C) Average area under the curves relative to the tumor growth in the different experimental groups is indicated as mean ± SEM. The statistical significance was evaluated by unpaired t test with Welch’s correction and the asterisks indicate statistical significance (∗p < 0.05; ∗∗∗p < 0.001). (D) Growth curves for each tumor reported as a single graph for each group (n = 5 animals per group). The percentage of responders (mice with an absolute tumor volume lower than 907.91 mm3) for each group is indicated. Volumes of tumors in responders are represented in green, whereas tumors volume in non-responders are represented by black curves. (E) Percentage of total CD3+ CD4+ T-lymphocytes present in the spleen of treated mice. (F) Percentage of total CD3+ CD4+ Foxp3+ T-lymphocytes present in the spleens. (G) Percentage of total CD45+ CD4+ Foxp3+ T lymphocytes present in the tumors. The statistical significance was evaluated by Student’s t test and the asterisks indicate statistical significance (∗p < 0.05; ∗∗p < 0.01; ∗∗∗p < 0.001; ∗∗∗∗p < 0.0001) compared to the relative lymphocytes’ population of spleens or tumors in mock-treated mice. (H) B16-OVA cells were incubated with or without murine splenocytes isolated from spleens of mice, previously treated with PBS (mock), Ad-CpG, Bifidus or a combination of virus and Bifidobacterium for 48 h. Left plot: cell viability is reported as a percentage of viable cells compared to untreated B16-OVA cancer cells (white bar). Right plot: tumor cell lysis was determined by measurement of the LDH levels released in the culture medium and expressed as a percentage with respect to max lysis control represented by cells treated with 10% Triton X-100. The experiments were performed in triplicate and statistical significance (∗p < 0.05; ∗∗p < 0.01; ∗∗∗p < 0.001; ∗∗∗∗p < 0.0001) was assessed by the Student’s t test by comparing the cells, treated as indicated, to untreated cells. The data are represented as mean +/− standard deviation (SD).
Figure 4
Figure 4
Treatment of tumor with Ad-CpG increases Firmicutes in murine fecal microbiome (A) The bar plots show Kruskal-Wallis test results on amplicon sequence variants (ASVs) grouped in phyla for each study group over the time points (Day-10, Day 0, Day 18, and Day 20). The treatments were indicated as Mock: untreated tumor-bearing-mice; BIF: Bifidobacterium oral supplementation-receiving mice; Ad-CpG: Ad5-CpG-treated mice; Ad-CpG + BIF: combined regimen-treated mice. Each column in the plot represents a time point and each color in the column represents the percentage of relative abundance. The phyla significantly (∗p < 0.05; ∗∗p < 0.01; ∗∗∗p < 0.001) different between the four time points and for each treatment, were shown in each panel alongside each bar plot graph. (B) The bar plots show the relative abundances of differentially abundant genera (p < 0.05) according to the Kruskal-Wallis test among the four time points for each treatment. The color legends show the identified genera.
Figure 5
Figure 5
Treatment of tumor with Ad-CpG increases the abundance of three specific genera in murine fecal microbiome (A and B) Over the time points (Day-10, Day 0, Day 18, and Day 20), the three genera with a relative abundance >2% shown in the boxplots were in common between Ad-CpG and Ad-CpG + BIF group and belong to phyla Actinobacteria (Bifidobacterium) and Firmicutes (Faecalibaculum and Lacknospiraceae NK4A136). The treatments were indicated as Ad-CpG: Ad5-CpG-treated mice; Ad-CpG + BIF: combined regimen-treated mice. Middle line in boxes represents the median; lower box bounds the first quartile; upper box bounds the 3rd quartile. Whiskers represent the 95% confidence interval of the mean. The significance of distribution differences has been calculated by applying the Kruskal-Wallis test, Dunn’s post-hoc test and Benjamini-Hochberg p value adjustment (∗p < 0.05; ∗∗p < 0.01; ∗∗∗p < 0.005).
Figure 6
Figure 6
Experimental characterization of peptides (A) Flowchart of the bioinformatics workflow for peptides discovery. (B) Schematic representation of the schedule followed during the preimmunization procedure. The mice have been subcutaneously injected with two Bifidobacterium peptides (such as B1+B2) at days 0 and 7. PBS or poly (I:C) were used as controls as well. The spleens were harvested at day 14 and IFN-γ ELISpot was performed on harvested splenocytes and individual response to Bifidobacterium peptides and the corresponding similar tumor peptides were evaluated for each mouse.
Figure 7
Figure 7
Bifidobacterium-derived peptides can resemble murine melanoma epitopes and mediate strong CTL response (A–E) IFN-γ ELISpot was performed on harvested splenocytes from mice preimmunized with PBS, adjuvant poly (I:C) or with two Bifidobacterium peptides (B1+B2) and individual response to B1 stimulus and B2 (B) to T1 and T5 stimulus (C) to T2 and T6 stimulus (D) to stimulus B1, T1, T2, B2, T5, and T6 for each group of mice (n = 3) is reported as the value of IFN-γ spot-forming cells (SFC) on 1 × 106 splenocytes. Comparison of number of spots IFN-γ detected between B2 and T5, in magenta box, and comparison between B2 and T6 in the green box (E) IFN-γ ELISpot was performed on harvested splenocytes from mice preimmunized with two Bifidobacterium peptides (B1+B2) and with PBS and stimulated with peptides B1, T1, T2, B2, T5, and T6. (F) IFN-γ ELISpot was performed on harvested splenocytes from mice treated with PBS, with vancomycin and from mice received oral supplementation with Bifidobacterium spp. (Bifidus) and stimulated with peptides B2, T5, and T6. For each group of mice (n = 3) number of spots (IFN-γ) is reported. All data are depicted as bar plots and represented as mean ± SEM. The statistical analysis was performed with ordinary one-way ANOVA test (∗p < 0.05; ∗∗p < 0.01; ∗∗∗p < 0.001; ∗∗∗∗p < 0.0001).

References

    1. Kim K., Kim H.S., Kim J.Y., Jung H., Sun J.-M., Ahn J.S., Ahn M.-J., Park K., Lee S.-H., Choi J.K. Predicting clinical benefit of immunotherapy by antigenic or functional mutations affecting tumour immunogenicity. Nat. Commun. 2020;11:951. doi: 10.1038/s41467-020-14562-z. - DOI - PMC - PubMed
    1. Sambi M., Bagheri L., Szewczuk M.R. Current Challenges in Cancer Immunotherapy: Multimodal Approaches to Improve Efficacy and Patient Response Rates. J. Oncol. 2019;2019 doi: 10.1155/2019/4508794. - DOI - PMC - PubMed
    1. Alexander J.L., Wilson I.D., Teare J., Marchesi J.R., Nicholson J.K., Kinross J.M. Gut microbiota modulation of chemotherapy efficacy and toxicity. Nat. Rev. Gastroentero. 2017;14:356–365. doi: 10.1038/nrgastro.2017.20. - DOI - PubMed
    1. Gopalakrishnan V., Spencer C.N., Nezi L., Reuben A., Andrews M.C., Karpinets T.V., Prieto P.A., Vicente D., Hoffman K., Wei S.C., et al. Gut microbiome modulates response to anti–PD-1 immunotherapy in melanoma patients. Science. 2018;359:97–103. doi: 10.1126/science.aan4236. - DOI - PMC - PubMed
    1. Sepich-Poore G.D., Zitvogel L., Straussman R., Hasty J., Wargo J.A., Knight R. The microbiome and human cancer. Science. 2021;371 doi: 10.1126/science.abc4552. - DOI - PMC - PubMed

LinkOut - more resources