

Identification of SIRT3 as an eraser of H4K16la
- PMID: 37720100
- PMCID: PMC10504495
- DOI: 10.1016/j.isci.2023.107757
Identification of SIRT3 as an eraser of H4K16la
Abstract
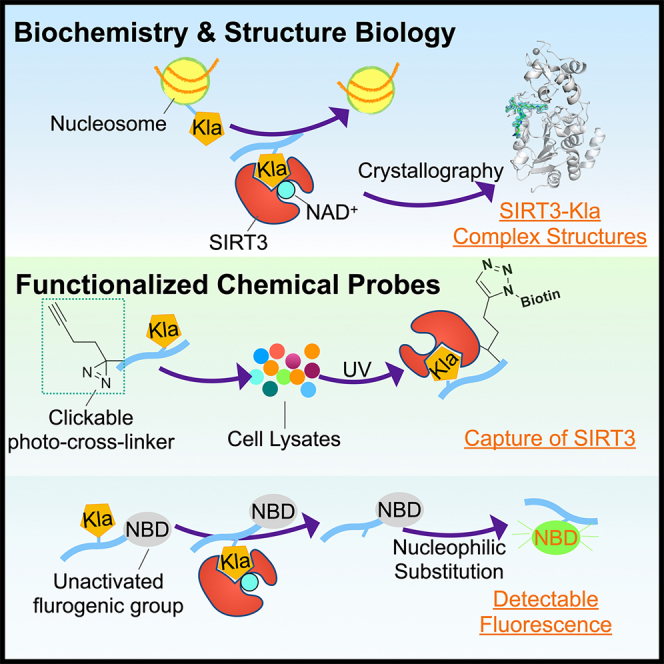
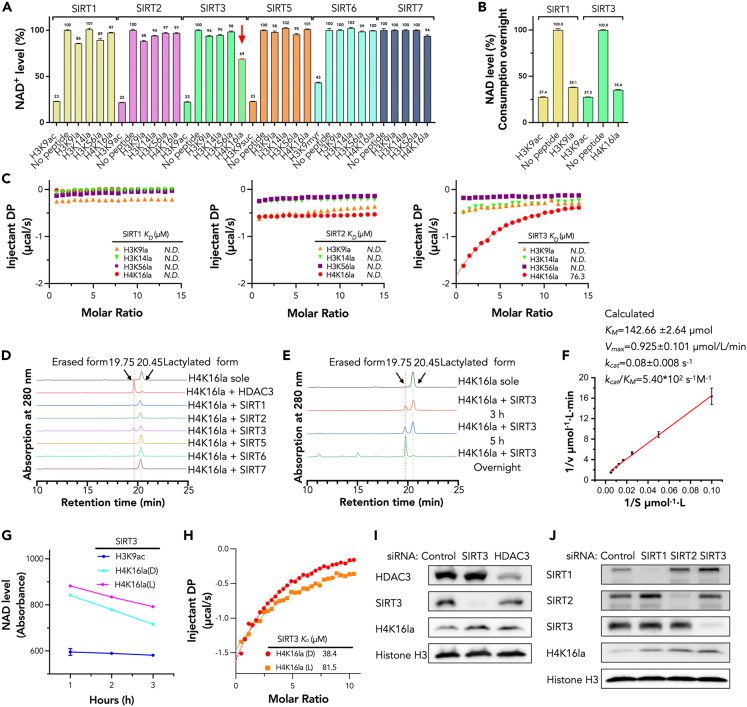
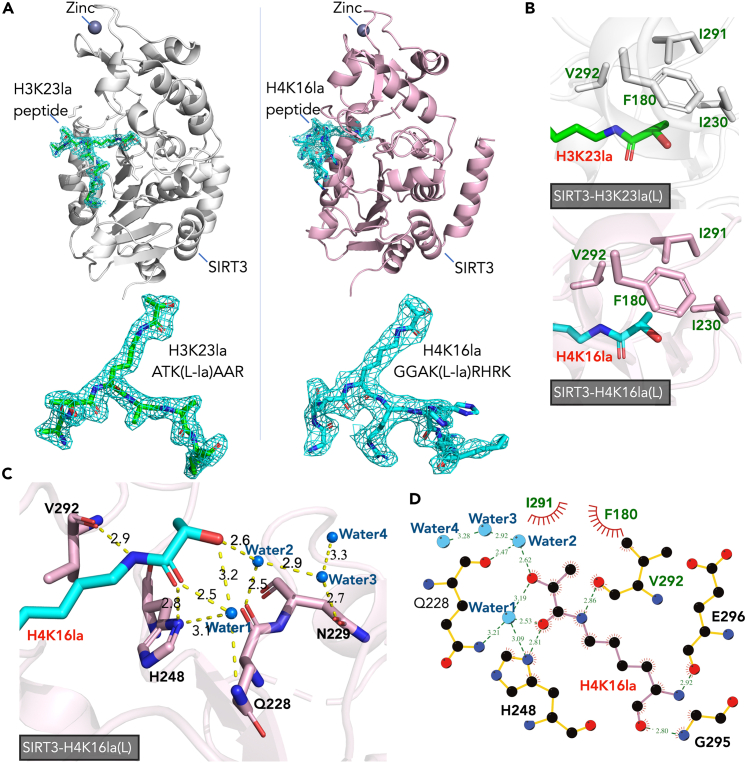
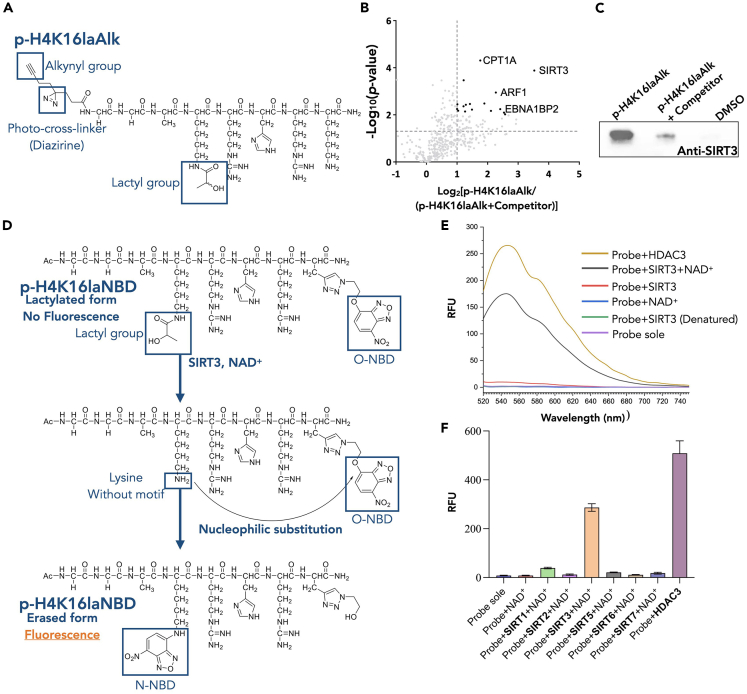
Lysine lactylation (Kla) is a novel histone post-translational modification discovered in late 2019. Later, HDAC1-3, were identified as the robust Kla erasers. While the Sirtuin family proteins showed weak eraser activities toward Kla, as reported. However, the catalytic mechanisms and physiological functions of HDACs and Sirtuins are not identical. In this study, we observed that SIRT3 exhibits a higher eraser activity against the H4K16la site than the other human Sirtuins. Crystal structures revealed the detailed binding mechanisms between lactyl-lysine peptides and SIRT3. Furthermore, a chemical probe, p-H4K16laAlk, was developed to capture potential Kla erasers from cell lysates. SIRT3 was captured by this probe and detected via proteomic analysis. And another chemical probe, p-H4K16la-NBD, was developed to detect the eraser-Kla delactylation processes directly via fluorescence indication. Our findings and chemical probes provide new directions for further investigating Kla and its roles in gene transcription regulation.
Keywords: Enzymology; Molecular interaction; Protein; Structural biology.
© 2023 The Authors.
Conflict of interest statement
The authors declare no competing financial interest.
Figures
Similar articles
-
Sirtuin 1/sirtuin 3 are robust lysine delactylases and sirtuin 1-mediated delactylation regulates glycolysis.iScience. 2024 Sep 10;27(10):110911. doi: 10.1016/j.isci.2024.110911. eCollection 2024 Oct 18. iScience. 2024. PMID: 39351192 Free PMC article.
-
SIRT3 Functions as an Eraser of Histone H3K9 Lactylation to Modulate Transcription for Inhibiting the Progression of Esophageal Cancer.Mol Cell Proteomics. 2025 May;24(5):100973. doi: 10.1016/j.mcpro.2025.100973. Epub 2025 Apr 17. Mol Cell Proteomics. 2025. PMID: 40252727 Free PMC article.
-
SIRT3-dependent delactylation of cyclin E2 prevents hepatocellular carcinoma growth.EMBO Rep. 2023 May 4;24(5):e56052. doi: 10.15252/embr.202256052. Epub 2023 Mar 10. EMBO Rep. 2023. PMID: 36896611 Free PMC article.
-
Histone and non-histone lactylation: molecular mechanisms, biological functions, diseases, and therapeutic targets.Mol Biomed. 2025 Jun 9;6(1):38. doi: 10.1186/s43556-025-00275-6. Mol Biomed. 2025. PMID: 40484921 Free PMC article. Review.
-
Comprehensive review of histone lactylation: Structure, function, and therapeutic targets.Biochem Pharmacol. 2024 Jul;225:116331. doi: 10.1016/j.bcp.2024.116331. Epub 2024 May 29. Biochem Pharmacol. 2024. PMID: 38821374 Review.
Cited by
-
SIRT3 Activation a Promise in Drug Development? New Insights into SIRT3 Biology and Its Implications on the Drug Discovery Process.J Med Chem. 2024 Feb 8;67(3):1662-1689. doi: 10.1021/acs.jmedchem.3c01979. Epub 2024 Jan 23. J Med Chem. 2024. PMID: 38261767 Free PMC article. Review.
-
Histone lactylation: from tumor lactate metabolism to epigenetic regulation.Int J Biol Sci. 2024 Mar 3;20(5):1833-1854. doi: 10.7150/ijbs.91492. eCollection 2024. Int J Biol Sci. 2024. PMID: 38481814 Free PMC article. Review.
-
Non-histone lactylation: unveiling its functional significance.Front Cell Dev Biol. 2025 Jan 24;13:1535611. doi: 10.3389/fcell.2025.1535611. eCollection 2025. Front Cell Dev Biol. 2025. PMID: 39925738 Free PMC article. Review.
-
Recent advances of lysine lactylation in prokaryotes and eukaryotes.Front Mol Biosci. 2025 Jan 9;11:1510975. doi: 10.3389/fmolb.2024.1510975. eCollection 2024. Front Mol Biosci. 2025. PMID: 39850757 Free PMC article. Review.
-
The TRIM33 Bromodomain Recognizes Histone Lysine Lactylation.ACS Chem Biol. 2024 Dec 20;19(12):2418-2428. doi: 10.1021/acschembio.4c00248. Epub 2024 Nov 18. ACS Chem Biol. 2024. PMID: 39556662
References
LinkOut - more resources
Full Text Sources
Miscellaneous
