. 2023 Aug 25;26(10):107726.
doi: 10.1016/j.isci.2023.107726. eCollection 2023 Oct 20.

The human leukemic oncogene MLL-AF4 promotes hyperplastic growth of hematopoietic tissues in Drosophila larvae

Affiliations

The human leukemic oncogene MLL-AF4 promotes hyperplastic growth of hematopoietic tissues in Drosophila larvae

Julie A Johannessen et al. iScience. .

Abstract

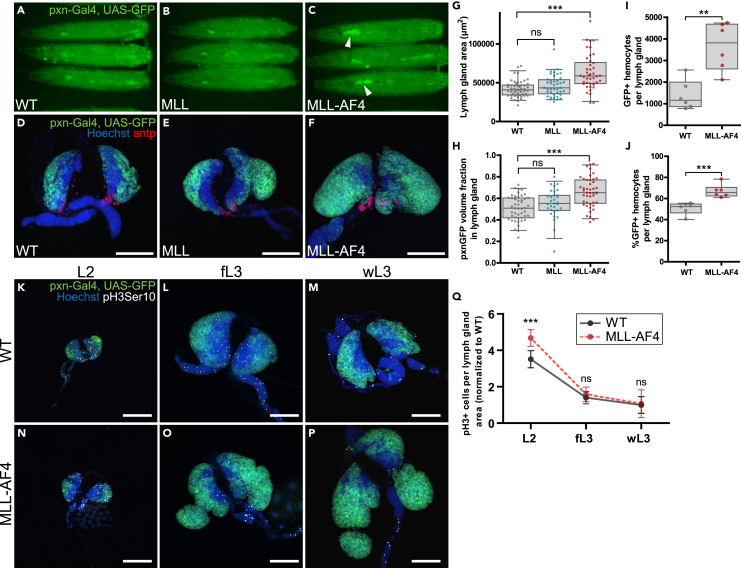
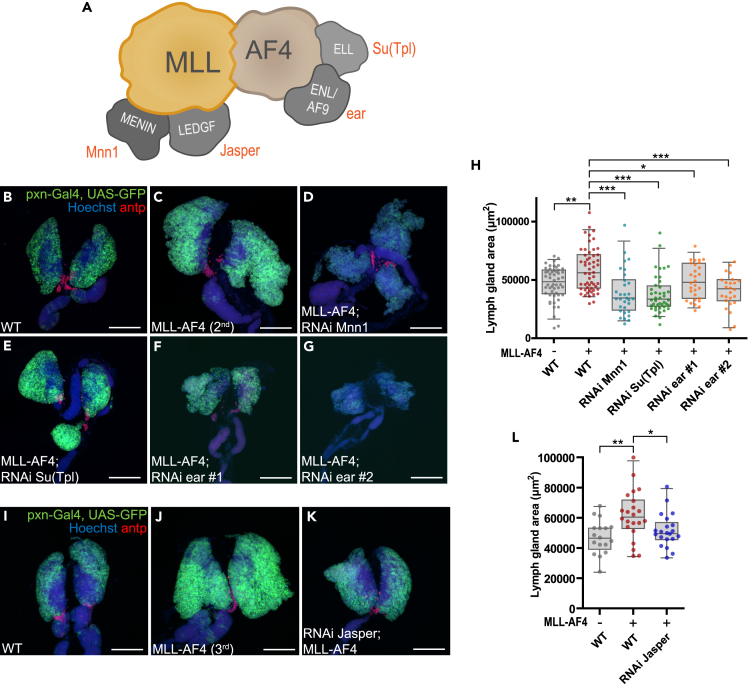
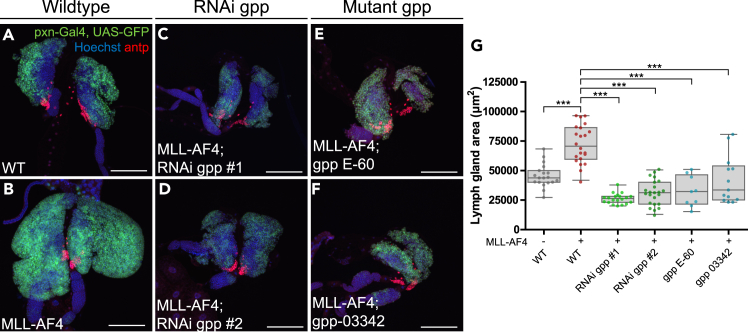
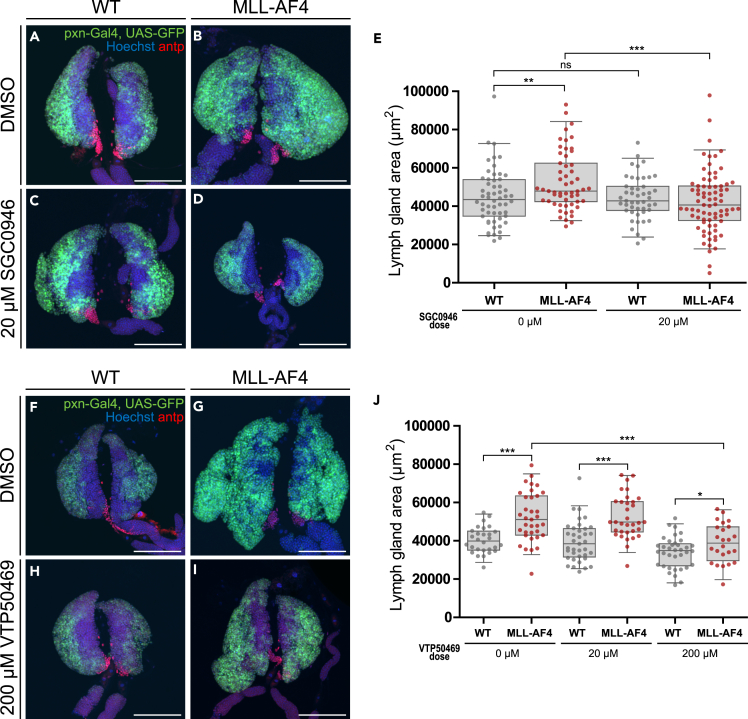
MLL-rearranged (MLL-r) leukemias are among the leukemic subtypes with poorest survival, and treatment options have barely improved over the last decades. Despite increasing molecular understanding of the mechanisms behind these hematopoietic malignancies, this knowledge has had poor translation into the clinic. Here, we report a Drosophila melanogaster model system to explore the pathways affected in MLL-r leukemia. We show that expression of the human leukemic oncogene MLL-AF4 in the Drosophila hematopoietic system resulted in increased levels of circulating hemocytes and an enlargement of the larval hematopoietic organ, the lymph gland. Strikingly, depletion of Drosophila orthologs of known interactors of MLL-AF4, such as DOT1L, rescued the leukemic phenotype. In agreement, treatment with small-molecule inhibitors of DOT1L also prevented the MLL-AF4-induced leukemia-like phenotype. Taken together, this model provides an in vivo system to unravel the genetic interactors involved in leukemogenesis and offers a system for improved biological understanding of MLL-r leukemia.

Keywords: Cell biology; Molecular biology; Oncology.


Conflict of interest statement

The authors declare no competing interests.

Figures

None
Graphical abstract
Figure 1
Figure 1
Expression of the human oncogene MLL-AF4 in the hematopoietic system of D. melanogaster induces a leukemia-like phenotype in the lymph gland (A–C) Representative images of wandering third-instar larvae expressing full-length human MLL or human MLL-AF4 driven by pxn-Gal4 and imaged by widefield fluorescence microscopy. The hematopoietic system is marked by GFP expression driven by pxn-Gal4. Arrowheads indicate enlarged lymph glands. (D–F) Immunofluorescence confocal images of lymph glands that are WT or expressing MLL or MLL-AF4 driven by pxn-Gal4. The cortical zone is marked by GFP, and the posterior signaling center (PSC) is detected by immunostaining against antp (in red). Images are maximum intensity projection of z stacks. Scale bars 100 μm. (G) Quantification of lymph gland area (μm2) from immunofluorescence confocal images. (H) Quantification of GFP-positive lymph gland volume presented as ratio of total lymph gland volume based on immunofluorescence confocal stacks. G, H: Each data point represents one animal. Boxplots show the mean ± the 95th percentile as error bars. Statistical significance was determined by one-way ANOVA with Bonferroni post-test to assess significant differences from WT. ns: not significant, ∗∗∗: p < 0.001. (I) Quantification of GFP-positive hemocytes per lymph gland by flow cytometry. (J) Quantification of percentage of GFP-positive cells in larval lymph glands measured by flow cytometry. I, J: Data points are mean values from around 15 lymph glands per genotype from 6 independent experiments. Boxplots show the mean ± the 95th percentile as error bars. Statistical significance was determined by two-sided Student’s t test to assess significant differences from WT. ∗∗: p < 0.01, ∗∗∗: p < 0.001. (K–P) Immunofluorescence confocal images of lymph glands from larvae that are WT or expressing MLL-AF4 driven by pxn-Gal4, in 2nd instar larva (L2), feeding 3rd instar larva (fL3) and wandering 3rd instar larva (wL3), respectively. Cortical zone is marked by GFP expression and phospho-histone 3 Ser10 (pH3Ser10)-positive cells are shown in grayscale. Images are maximum intensity projection of z stacks. Scale bars 100 μm. (Q) Quantification of phospho-histone 3 Ser10-positive cells per lymph gland area for L2, fL3, and wL3 larval stages. All values are normalized to WT mean of wL3 larval stage. Values are shown as mean and error bars show 95th percentile. Two-sided Student’s t test was performed to assess significant differences between WT and MLL-AF4 for each larval stage. ns: not significant, ∗∗∗: p < 0.001. Genotypes: A, D, G–J, K–M, Q: pxn-Gal4, UAS-GFP/+ (WT) B, E, G–J: pxn-Gal4, UAS-GFP/UAS-MLL C, F, G–J, N–P, Q: pxn-Gal4, UAS-GFP/UAS-MLL-AF4. See also Figures S1 and S2.
Figure 2
Figure 2
Expression of the human oncogene MLL-AF4 in the hematopoietic system of D. melanogaster induces a leukemia-like phenotype in circulating hemocytes (A–C) Immunofluorescence confocal images of circulating hemocytes from wL3 larvae that are WT or expressing MLL or MLL-AF4 driven by hml-Gal4. Images are maximum intensity projection of z stacks. Scale bars 100 μm. A′-C’: GFP+ cells marked by the driver hml-Gal4, UAS-GFP. A″-C’’: Phalloidin (F-actin) staining to visualize cytoskeleton and lamellocytes. Arrowheads indicate examples of differentiated lamellocytes. (D) Quantification of number of circulating hemocytes expressing GFP. Values are per larva across 4 larvae in 3 replicates. Boxplots show the mean ± the 95th percentile as error bars. (E) Quantification of lamellocytes in circulating hemocytes from A–C. Note that the x axis is split between 100 and 300 to enable visualization of all values. D,E: One-way ANOVA with Bonferroni post-test was performed to assess significant differences. ns: not significant, ∗: p < 0.05, ∗∗: p < 0.01. Genotypes: A, D, E: hml-Gal4, UAS-GFP/+ (WT) B, D, E: hml-Gal4, UAS-GFP/UAS-MLL C, D, E: hml-Gal4, UAS-GFP/UAS-MLL-AF4. See also Figure S3.
Figure 3
Figure 3
MLL-AF4-driven lymph gland enlargement depends on Drosophila homologs of known MLL-AF4 interaction partners (A) Schematic overview of some of the known direct interactors with the fusion protein MLL-AF4 in humans based on current literature. The corresponding D. melanogaster homologs are indicated in red. (B–G) and (I–K) Representative immunofluorescence confocal images of lymph glands with pxn-Gal4-driven expression of MLL-AF4 and concurrent depletion of indicated target genes (B–G: MLL-AF4 on the 2nd chromosome, I–K: MLL-AF4 on the 3rd chromosome). The cortical zone is marked by GFP expression and PSC is detected by immunostaining for antp (in red). Images are maximum intensity projection of z stacks. Scale bar 100 μm. (H and L) Quantification of lymph gland area from immunofluorescence images with MLL-AF4 expression driven by pxn-Gal4 combined with RNAi (H: MLL-AF4 on the 2nd chromosome, M: MLL-AF4 on the 3rd chromosome). H, L: Each data point represents one animal. Boxplots show the mean ± the 95th percentile as error bars. One-way ANOVA with Bonferroni post-test was performed to assess significant differences from MLL-AF4. ∗: p < 0.05, ∗∗: p < 0.01, ∗∗∗: p < 0.001. Genotypes: B, H, I, L: pxn-Gal4, UAS-GFP/+ (WT) C, H: pxn-Gal4, UAS-GFP/UAS-MLL-AF4 D, H: pxn-Gal4, UAS-GFP/UAS-MLL-AF4; UAS-RNAi Mnn1 GL00018/+ E, H: pxn-Gal4, UAS-GFP/UAS-MLL-AF4; UAS-RNAi Su(Tpl) HMS00277/+ F, H: pxn-Gal4, UAS-GFP/UAS-MLL-AF4; UAS-RNAi ear HMS00107/+ G, H: pxn-Gal4, UAS-GFP/UAS-MLL-AF4; UAS-RNAi ear JF02905/+ J, L: pxn-Gal4, UAS-GFP/+; UAS-MLL-AF4/+ K, L: pxn-Gal4, UAS-GFP/UAS-RNAi Jasper HMC03961; UAS-MLL-AF4/+. See also Figure S4.
Figure 4
Figure 4
MLL-AF4-driven lymph gland enlargement depends on the Drosophila homolog of DOT1L, gpp (A–F) Representative immunofluorescence confocal images of lymph glands depleted of gpp in combination with MLL-AF4 expression driven by pxn-Gal4. The cortical zone is marked by GFP expression and PSC is detected by immunostaining for antp (in red). Images are maximum intensity projection of z stacks. Scale bars 100 μm. A, B: WT lymph gland and UAS-MLL-AF4-expressing lymph gland. C, D: MLL-AF4-expressing lymph glands combined with expression of dsRNA against gpp. E, F: MLL-AF4-expressing lymph glands from a heterozygous genetic background containing gpp mutants E−60 or 03342. (G) Quantification of lymph gland area (μm2) from immunofluorescence confocal images. Each data point represents one animal. Boxplots show the mean ± the 95th percentile as error bars. One-way ANOVA with Bonferroni post-test was performed to assess significant differences from MLL-AF4. ∗∗∗: p < 0.001. Genotypes: A, G: pxn-Gal4, UAS-GFP/+ (WT) B, G: pxn-Gal4, UAS-GFP/UAS-MLL-AF4 C, G: pxn-Gal4, UAS-GFP/UAS-MLL-AF4; UAS-RNAi gpp HMS00160/+ D, G: pxn-Gal4, UAS-GFP/UAS-MLL-AF4; UAS-RNAi gpp JF1283/+ E, G: pxn-Gal4, UAS-GFP/UAS-MLL-AF4; UAS-gpp E-60/+ F, G: pxn-Gal4, UAS-GFP/UAS-MLL-AF4; UAS-gpp 03342/+. See also Figure S5.
Figure 5
Figure 5
The MLL-AF4 Drosophila model is sensitive to drug treatment targeting DOT1L and the MLL-Menin interaction (A–D) and (F–I) Lymph glands from wandering 3rd instar larvae. Cortical zone is marked by GFP expression and PSC is detected by immunostaining for antp (in red). Images are maximum intensity projection of z stacks. Scale bars 100 μm. A, B: WT and MLL-AF4-expressing lymph glands treated with DMSO only. C, D: WT and MLL-AF4-expressing lymph glands treated with 20 μM SGC0946. F, G: WT and MLL-AF4-expressing lymph glands treated with DMSO only. H, I: WT and MLL-AF4-expressing lymph glands treated with 200 μM VTP50469. (E) Quantification of lymph gland area (μm2) from immunofluorescence confocal images from drug treated larvae with either DMSO or the DOT1L inhibitor SGC0946. (J) Quantification of lymph gland area (μm2) from immunofluorescence confocal images from drug treated larvae with either DMSO or the MLL-Menin interaction inhibitor VTP50469. E, J: Each data point represents one animal. Boxplots show the mean ± the 95th percentile as error bars. Statistical significance was determined by two-sided Student’s t test to assess significant differences between drug-treated larvae and DMSO control for each genotype. ns: not significant, ∗: p < 0.05, ∗∗: p < 0.01, ∗∗∗: p < 0.001.Genotypes: A, C, E, F, H, J: pxn-Gal4, UAS-GFP/+ (WT) B, D, E, G, I, J: pxn-Gal4, UAS-GFP/UAS-MLL-AF4. See also Figure S6.
Figure 6
Figure 6
hth and exd, the Drosophila orthologs of MEIS1 and PBX, are crucial for the MLL-AF4 lymph gland enlargement phenotype (A–D) Lymph glands from wandering 3rd instar larvae. Cortical zone is marked by GFP expression and PSC is detected by immunostaining for antp (in red). Images are maximum intensity projection of z stacks. Scale bars 100 μm. (E) Quantification of lymph gland area (μm2) from immunofluorescence confocal images. (F–H) Immunofluorescence confocal images of lymph glands stained for hth (red in merge, grayscale alone). (I) Quantification of hth-positive area in the lymph gland. (J) Quantification of the hth positive fraction of the cortical zone. E, I, J: Each data point represents one animal. Boxplots show the mean ± the 95th percentile as error bars. One-way ANOVA with Bonferroni post-test was performed to assess significant differences from MLL-AF4. ∗∗: p < 0.01, ∗∗∗: p < 0.001. Genotypes: A, E, F, I, J: pxn-Gal4, UAS-GFP/+ (WT) B, E: pxn-Gal4, UAS-GFP/+; UAS-MLL-AF4/+ C, E: pxn-Gal4, UAS-GFP/UAS-RNAi hth KK108831; UAS-MLL-AF4/+ D, E: pxn-Gal4, UAS-GFP/UAS-RNAi exd KK107300; UAS-MLL-AF4/+ G, I, J: pxn-Gal4, UAS-GFP/UAS-MLL-AF4 H, I, J: pxn-Gal4, UAS-GFP/UAS-MLL-AF4; UAS-RNAi gpp HMS00160/+. See also Figure S7.

Similar articles

References

    1. Richard-Carpentier G., Kantarjian H.M., Tang G., Yin C.C., Khoury J.D., Issa G.C., Haddad F., Jain N., Ravandi F., Short N.J., et al. Outcomes of acute lymphoblastic leukemia with KMT2A (MLL) rearrangement: the MD Anderson experience. Blood Adv. 2021;5:5415–5419. doi: 10.1182/bloodadvances.2021004580. - DOI - PMC - PubMed
    1. Issa G.C., Zarka J., Sasaki K., Qiao W., Pak D., Ning J., Short N.J., Haddad F., Tang Z., Patel K.P., et al. Predictors of outcomes in adults with acute myeloid leukemia and KMT2A rearrangements. Blood Cancer J. 2021;11:162. doi: 10.1038/s41408-021-00557-6. - DOI - PMC - PubMed
    1. Tkachuk D.C., Kohler S., Cleary M.L. Involvement of a homolog of Drosophila trithorax by 11q23 chromosomal translocations in acute leukemias. Cell. 1992;71:691–700. doi: 10.1016/0092-8674(92)90602-9. - DOI - PubMed
    1. Gu Y., Nakamura T., Alder H., Prasad R., Canaani O., Cimino G., Croce C.M., Canaani E. The t(4;11) chromosome translocation of human acute leukemias fuses the ALL-1 gene, related to Drosophila trithorax, to the AF-4 gene. Cell. 1992;71:701–708. doi: 10.1016/0092-8674(92)90603-a. - DOI - PubMed
    1. Ziemin-van der Poel S., McCabe N.R., Gill H.J., Espinosa R., 3rd, Patel Y., Harden A., Rubinelli P., Smith S.D., LeBeau M.M., Rowley J.D., et al. Identification of a gene, MLL, that spans the breakpoint in 11q23 translocations associated with human leukemias. Proc. Natl. Acad. Sci. USA. 1991;88:10735–10739. doi: 10.1073/pnas.88.23.10735. - DOI - PMC - PubMed

LinkOut - more resources