

Role of caveolin-1 in metabolic programming of fetal brain
- PMID: 37720105
- PMCID: PMC10500482
- DOI: 10.1016/j.isci.2023.107710
Role of caveolin-1 in metabolic programming of fetal brain
Abstract
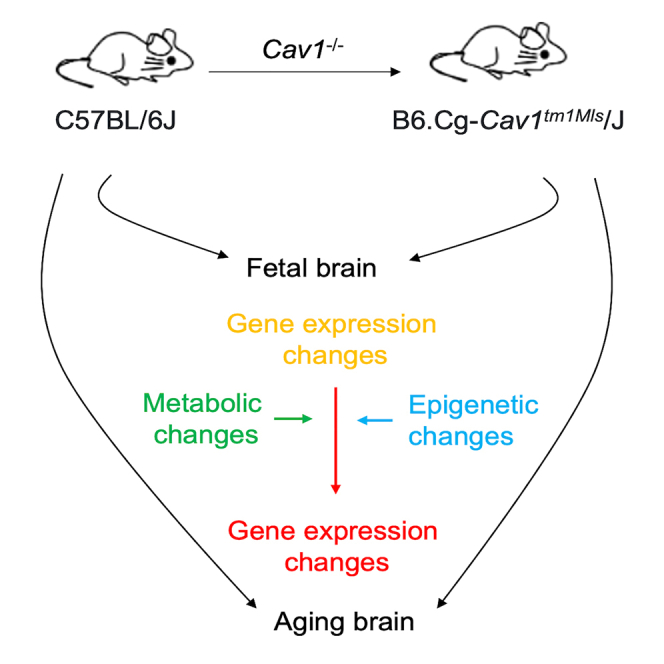
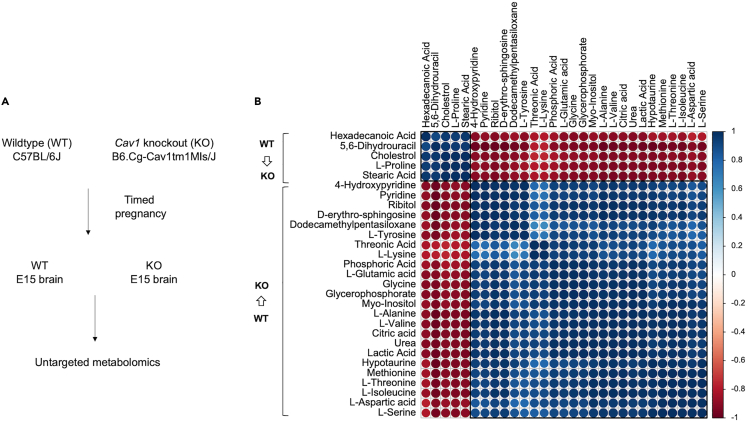
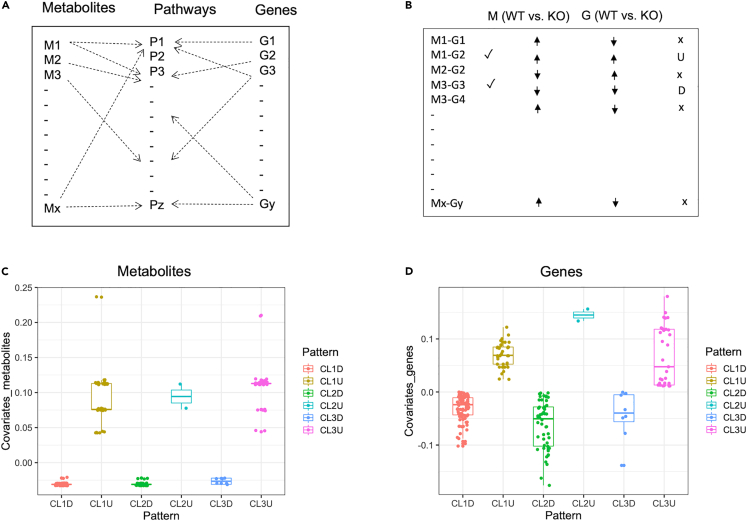
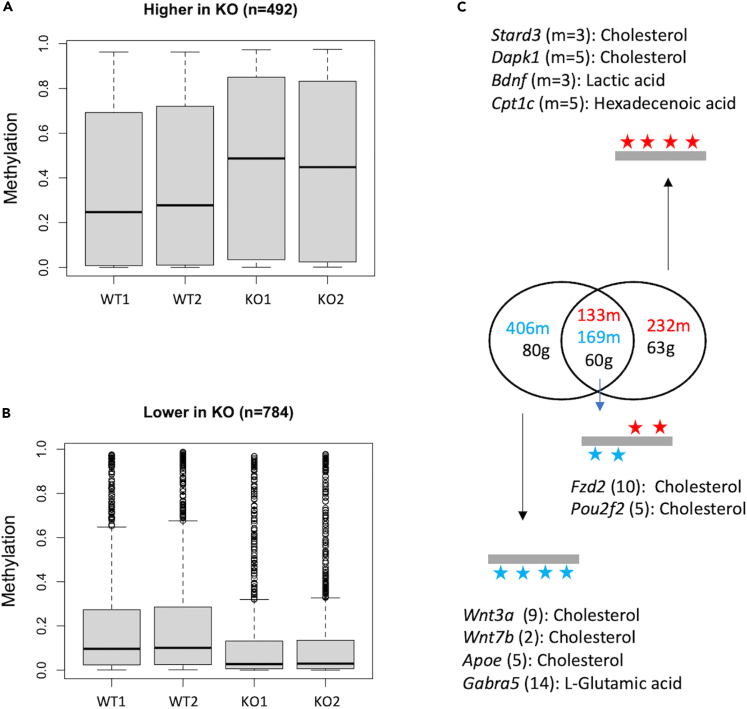
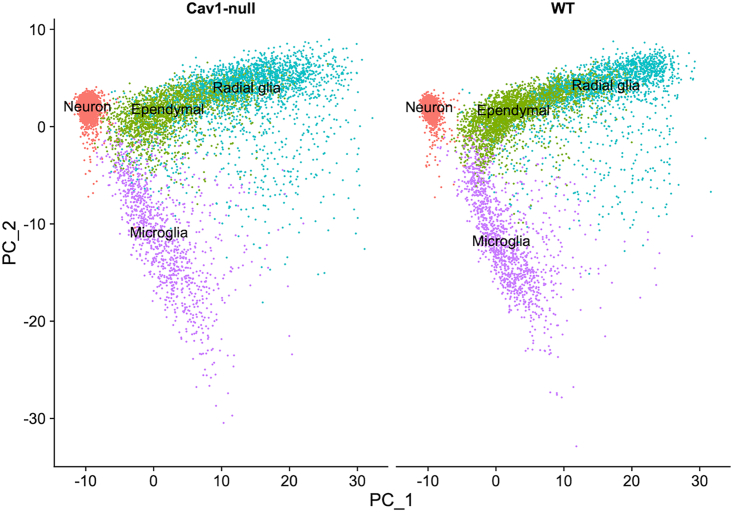
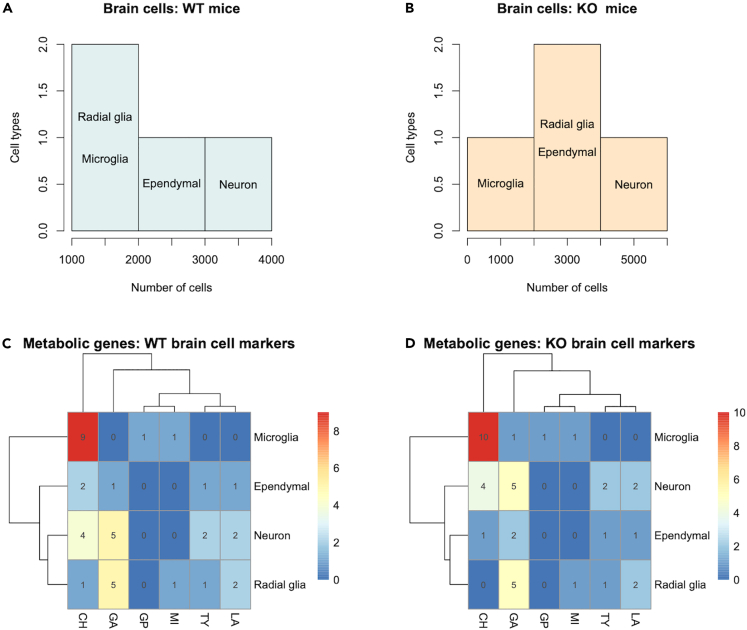
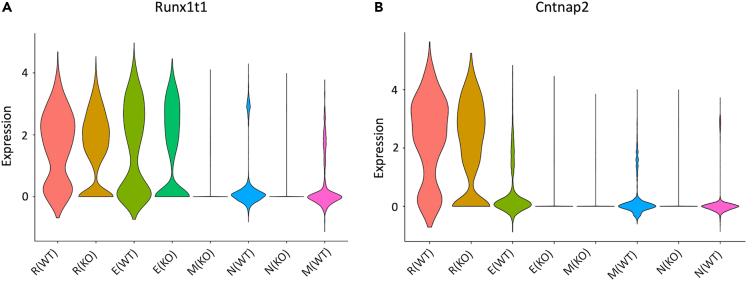
Mice lacking caveolin-1 (Cav1), a key protein of plasma membrane, exhibit brain aging at an early adult stage. Here, integrative analyses of metabolomics, transcriptomics, epigenetics, and single-cell data were performed to test the hypothesis that metabolic deregulation of fetal brain due to the ablation of Cav1 is linked to brain aging in these mice. The results of this study show that lack of Cav1 caused deregulation in the lipid and amino acid metabolism in the fetal brain, and genes associated with these deregulated metabolites were significantly altered in the brain upon aging. Moreover, ablation of Cav1 deregulated several metabolic genes in specific cell types of the fetal brain and impacted DNA methylation of those genes in coordination with mouse epigenetic clock. The findings of this study suggest that the aging program of brain is confounded by metabolic abnormalities in the fetal stage due to the absence of Cav1.
Keywords: Bioinformatics; Metabolomics; Neuroscience; Omics; Transcriptomics.
© 2023 The Author(s).
Conflict of interest statement
The authors declare that they have no competing interests in this research.
Figures
Similar articles
-
Single-Cell Transcriptional Response of the Placenta to the Ablation of Caveolin-1: Insights into the Adaptive Regulation of Brain-Placental Axis in Mice.Cells. 2024 Jan 24;13(3):215. doi: 10.3390/cells13030215. Cells. 2024. PMID: 38334607 Free PMC article.
-
Caveolin-1 is necessary for hepatic oxidative lipid metabolism: evidence for crosstalk between caveolin-1 and bile acid signaling.Cell Rep. 2013 Jul 25;4(2):238-47. doi: 10.1016/j.celrep.2013.06.017. Epub 2013 Jul 11. Cell Rep. 2013. PMID: 23850288
-
Caveolin-1 Impacts on TGF-β Regulation of Metabolic Gene Signatures in Hepatocytes.Front Physiol. 2020 Jan 31;10:1606. doi: 10.3389/fphys.2019.01606. eCollection 2019. Front Physiol. 2020. PMID: 32082178 Free PMC article.
-
Caveolin-1 in the regulation of cell metabolism: a cancer perspective.Mol Cancer. 2016 Nov 16;15(1):71. doi: 10.1186/s12943-016-0558-7. Mol Cancer. 2016. PMID: 27852311 Free PMC article. Review.
-
Caveolin-1 function at the plasma membrane and in intracellular compartments in cancer.Cancer Metastasis Rev. 2020 Jun;39(2):435-453. doi: 10.1007/s10555-020-09890-x. Cancer Metastasis Rev. 2020. PMID: 32458269 Free PMC article. Review.
Cited by
-
Single-Cell Transcriptional Response of the Placenta to the Ablation of Caveolin-1: Insights into the Adaptive Regulation of Brain-Placental Axis in Mice.Cells. 2024 Jan 24;13(3):215. doi: 10.3390/cells13030215. Cells. 2024. PMID: 38334607 Free PMC article.
-
Caveolae: Metabolic Platforms at the Crossroads of Health and Disease.Int J Mol Sci. 2025 Mar 24;26(7):2918. doi: 10.3390/ijms26072918. Int J Mol Sci. 2025. PMID: 40243482 Free PMC article. Review.
-
Molecular Regulation of Fetal Brain Development in Inbred and Congenic Mouse Strains Differing in Longevity.Genes (Basel). 2024 May 9;15(5):604. doi: 10.3390/genes15050604. Genes (Basel). 2024. PMID: 38790233 Free PMC article.
References
-
- Matcovitch-Natan O., Winter D.R., Giladi A., Vargas Aguilar S., Spinrad A., Sarrazin S., Ben-Yehuda H., David E., Zelada González F., Perrin P., et al. Microglia development follows a stepwise program to regulate brain homeostasis. Science. 2016;353:aad8670. doi: 10.1126/science.aad8670. - DOI - PubMed
LinkOut - more resources
Full Text Sources
Molecular Biology Databases
