. 2023 Aug 31:14:1255971.
doi: 10.3389/fmicb.2023.1255971. eCollection 2023.

Sigma-1 receptor knockout disturbs gut microbiota, remodels serum metabolome, and exacerbates isoprenaline-induced heart failure

Affiliations

Sigma-1 receptor knockout disturbs gut microbiota, remodels serum metabolome, and exacerbates isoprenaline-induced heart failure

Jian-Zheng Yang et al. Front Microbiol. .

Abstract

Introduction: Heart failure (HF) is usually the end stage of the continuum of various cardiovascular diseases. However, the mechanism underlying the progression and development of HF remains poorly understood. The sigma-1 receptor (Sigmar1) is a non-opioid transmembrane receptor implicated in many diseases, including HF. However, the role of Sigmar1 in HF has not been fully elucidated.

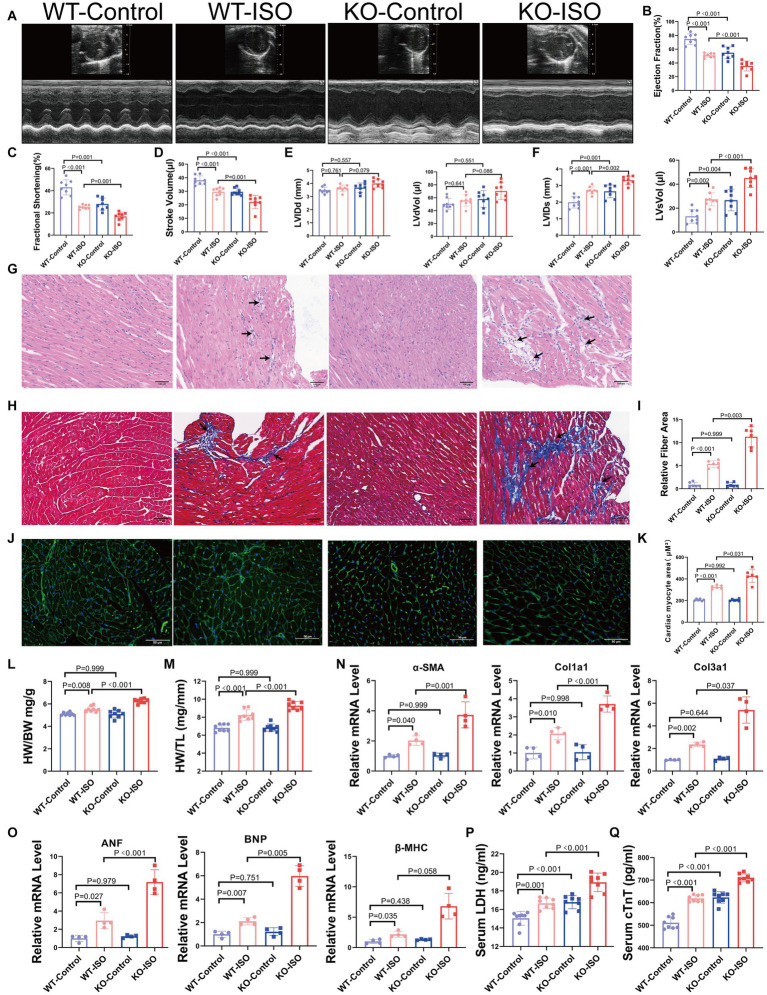
Methods: In this study, we used isoproterenol (ISO) to induce HF in wild-type (WT) and Sigmar1 knockout (Sigmar1-/-) mice. Multi-omic analysis, including microbiomics, metabolomics and transcriptomics, was employed to comprehensively evaluate the role of Sigmar1 in HF.

Results: Compared with the WT-ISO group, Sigmar1-/- aggravated ISO-induced HF, including left ventricular systolic dysfunction and ventricular remodeling. Moreover, Sigmar1-/- exacerbated ISO-induced gut microbiota dysbiosis, which was demonstrated by the lower abundance of probiotics g_Akkermansia and g_norank_f_Muribaculaceae, and higher abundance of pathogenic g_norank_f_Oscillospiraceae and Allobaculum. Furthermore, differential metabolites among WT-Control, WT-ISO and Sigmar-/--ISO groups were mainly enriched in bile secretion, tryptophan metabolism and phenylalanine metabolism, which presented a close association with microbial dysbiosis. Corresponding with the exacerbation of the microbiome, the inflammation-related NOD-like receptor signaling pathway, NF-kappa B signaling pathway and TNF signaling pathway were activated in the heart tissues.

Conclusion: Taken together, this study provides evidence that a Sigmar1 knockout disturbs the gut microbiota and remodels the serum metabolome, which may exacerbate HF by stimulating heart inflammation.

Keywords: gut microbiota; heart failure; inflammation; sigma-1 receptor; transcriptomics; untargeted metabolomics.


Conflict of interest statement

The authors declare that the research was conducted in the absence of any commercial or financial relationships that could be construed as a potential conflict of interest.

Figures

Figure 1
Figure 1
Transcriptome analysis between WT-Control and WT-ISO group. (A) Principal component analysis (PCA). n = 4 mice per group. (B) Volcano plot of RNA-seq indicating the DEGs in heart samples from WT mice with or without ISO treatment. (C) Kyoto Encyclopedia of Genes and Genomes (KEGG) annotation analysis. (D) The KEGG enrichment analysis revealed the top 30 pathways. (E) The heatmap shows the DEGs of five enriched pathways in WT-Control and WT-ISO groups.
Figure 2
Figure 2
Gut microbiota and metabolic alteration between the WT-Control and WT-ISO groups. (A,B) The Chao and Simpson index were examined to assess alpha diversity in indicated groups. (C) Bray_curtis principal coordinates analysis (PCoA) was used to indicate the β-diversity of gut microbiota. (D) A stacked bar graph of both groups showed differential bacteria at the phylum level. (E–H) Analysis of the relative abundance of the four major bacterial groups at the phylum level. (I) The increased Firmicutes/Bacteroidota ratio indicated ISO-induced bacterial dysbiosis. (J) Relative abundance of gut microbiota genera in each group. (K–M) The abundance of representative bacteria genera. n = 6 mice per group. (N) Spearman correlation analysis for 19 altered genera and nine cardiac-related measures. (O,P) The PLS-DA analysis and the corresponding coefficient of loading plots indicated significant metabolite changes between the WT-Control and WT-ISO groups. n = 8 mice per group. (Q) KEGG enrichment analysis of 182 differential metabolites in both groups. (R) Spearman correlation analysis between 14 metabolites from the top three enriched pathways and nine cardiac-related measures.
Figure 3
Figure 3
Sigmar1 knockout aggravated ISO-induced HF. (A) Representative echocardiographic images in each group. (B–D) Measurements of EF, FS, and SV from M-mode images for each group. (E,F) Analysis of LVIDd, LVdVol, LVIDs, and LVsVol among the four groups. n = 8 mice per group. (G) Representative HE staining of heart sections (scale bars, 100 μm). (H,I) Masson staining and quantitative analysis of fibrotic (blue) areas (scale bars, 100 μm). n = 3 mice per group. (J,K) WGA staining and quantitative analysis of cardiomyocyte areas (scale bars, 50 μm). n = 3 mice per group. (L,M) HW/BW and HW/TL were measured in each group to assess myocardial hypertrophy. n = 8 mice per group. (N) Relative mRNA levels of cardiac fibrosis marker genes (α-SMA, Col1a1, Col3a1) for each group. (O) The mRNA levels of heart failure markers (ANF and BNP) and the cardiac hypertrophy marker (β-MHC) among the four groups. n = 4 mice per group. (P,Q) Serum levels of myocardial injury markers LDH and cTnT in the four groups. n = 8 mice per group.
Figure 4
Figure 4
At baseline, Sigmar1−/− mice had different gut microbiota, metabolites and transcriptomes compared with WT mice. (A,B) The Chao and Simpson diversity index was examined by 16S-rRNA sequencing. (C) PCoA analysis showed that the gut microbial composition clustered separately in both groups. (D,E) Analysis of species composition at the phylum level and the ratio of F/B showed gut microbiota dysbiosis between WT-Con and KO-Con groups. (F,G) Analysis of species composition at the genus level and the relative abundance of representative genus-level bacteria. (H) Linear discriminant analysis (LDA) histograms reflected significant differences in gut microbial abundance in the WT-Con and KO-Con groups. n = 6 mice per group. (I,J) PLS-DA analysis and the corresponding coefficient of loading plots indicated significant metabolite changes between the WT-Con and KO-Con groups. (K) A total of 217 differential metabolites are shown in the heatmap between the WT-Con and KO-Con groups. (L) KEGG enrichment analysis of differential metabolites in both groups. n = 8 mice per group. (M,N) Volcano plot showing 66 DEGs, and KEGG showing the top 30 enriched pathways. (O) The heatmap shows the gene levels of partial pathways in WT-Con and KO-Con groups. n = 4 mice per group. Con: Control.
Figure 5
Figure 5
Sigmar1 knockout further aggravated ISO-induced gut microbiota dysbiosis. (A) The Chao index showed that the species richness of the microbiota was abnormally increased in the KO-ISO group. (B) The Simpson index showed that the diversity of species was further increased in the KO-ISO group when compared with the WT-ISO group. (C) PCoA (Bray_curtis) showed that the microbial composition of the KO-ISO group was clearly separated from that of the other two groups. (D) The stacked bar chart shows differences in species composition at phylum level. (E,F) The relative abundance of Verrucomicrobiota and Firmicutes/Bacteroidota. n = 6 mice per group. (G) The stacked bar chart shows differences in species composition at genus level. (H–J) Relative abundance analysis of a representative gut bacterial genus in the three groups. n = 6 mice per group. (K) Heatmap analysis for 20 altered genera in the three groups. (L) Spearman correlation analysis for 20 altered genera and nine cardiac-related indices.
Figure 6
Figure 6
Metabolome and transcriptome alterations among the WT-Control, WT-ISO and KO-ISO groups. (A,B) The PLS-DA models indicated significant metabolic variations among the WT-Con, WT-ISO and KO-ISO groups. n = 8 mice per group. (C) Venn diagram of differential metabolites between WT-Con and WT-ISO mice and between WT-ISO and KO-ISO mice. (D) The heatmap shows 74 differential metabolites and HMDB classification. (E) KEGG enrichment analysis of 74 differential metabolites. (F) Spearman correlation analysis for 12 altered metabolites from the first six enriched pathways and nine cardiac-related measures. (G) Venn diagram of DEGs between WT-Con and WT-ISO mice and between WT-ISO and KO-ISO mice. (H,I) KEGG annotation analysis and enrichment analysis of 74 DEGs.

Similar articles

Cited by

References

    1. Abdullah C. S., Aishwarya R., Alam S., Remex N. S., Morshed M., Nitu S., et al. (2022). The molecular role of sigmar1 in regulating mitochondrial function through mitochondrial localization in cardiomyocytes. Mitochondrion 62, 159–175. doi: 10.1016/j.mito.2021.12.002 - DOI - PMC - PubMed
    1. Almási N., Török S., Dvorácskó S., Tömböly C., Csonka Á., Baráth Z., et al. (2020). Lessons on the sigma-1 receptor in tnbs-induced rat colitis: modulation of the uchl-1, il-6 pathway. Int. J. Mol. Sci. 21:4046. doi: 10.3390/ijms21114046 - DOI - PMC - PubMed
    1. An L., Wuri J., Zheng Z., Li W., Yan T. (2021). Microbiota modulate doxorubicin induced cardiotoxicity. Eur. J. Pharm. Sci. 166:105977. doi: 10.1016/j.ejps.2021.105977 - DOI - PubMed
    1. Bai Y., Shen Y., Xu X. Y., Bai Y., Fang Y., Zhang M., et al. (2018). Growth arrest and dna damage inducible 45-beta activates pro-inflammatory cytokines and phagocytosis in the grass carp (ctenopharyngodon idella) after aeromonas hydrophila infection. Dev. Comp. Immunol. 87, 176–181. doi: 10.1016/j.dci.2018.06.010 - DOI - PubMed
    1. Bavineni M., Wassenaar T. M., Agnihotri K., Ussery D. W., Lüscher T. F., Mehta J. L. (2019). Mechanisms linking preterm birth to onset of cardiovascular disease later in adulthood. Eur. Heart J. 40, 1107–1112. doi: 10.1093/eurheartj/ehz025 - DOI - PMC - PubMed