. 2023 Sep;28(9):096005.
doi: 10.1117/1.JBO.28.9.096005. Epub 2023 Sep 14.

Integration of cellular-resolution optical coherence tomography and Raman spectroscopy for discrimination of skin cancer cells with machine learning

Affiliations

Integration of cellular-resolution optical coherence tomography and Raman spectroscopy for discrimination of skin cancer cells with machine learning

Cian You et al. J Biomed Opt. 2023 Sep.

Abstract

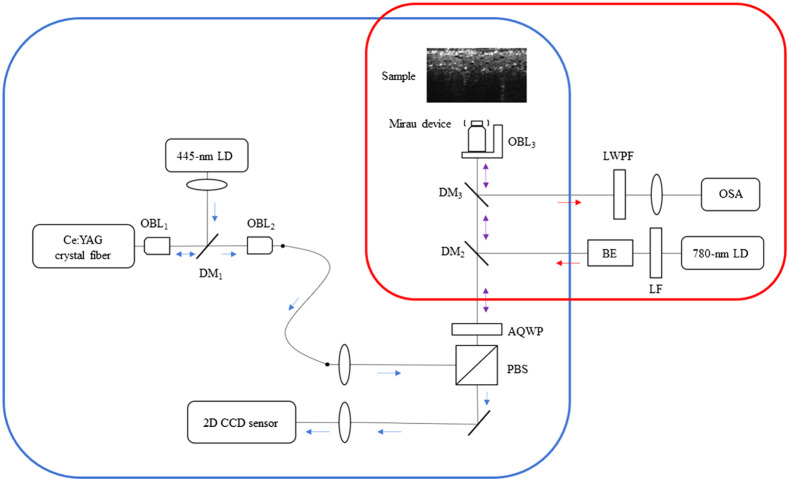
Significance: An integrated cellular-resolution optical coherence tomography (OCT) module with near-infrared Raman spectroscopy was developed on the discrimination of various skin cancer cells and normal cells. Micron-level three-dimensional (3D) spatial resolution and the spectroscopic capability on chemical component determination can be obtained simultaneously.

Aim: We experimentally verified the effectiveness of morphology, intensity, and spectroscopy features for discriminating skin cells.

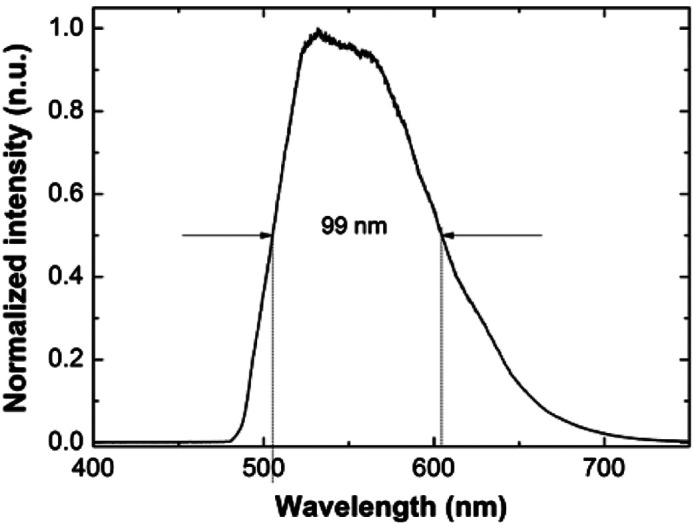
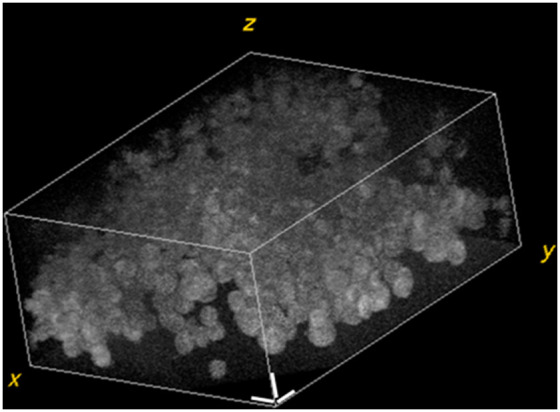
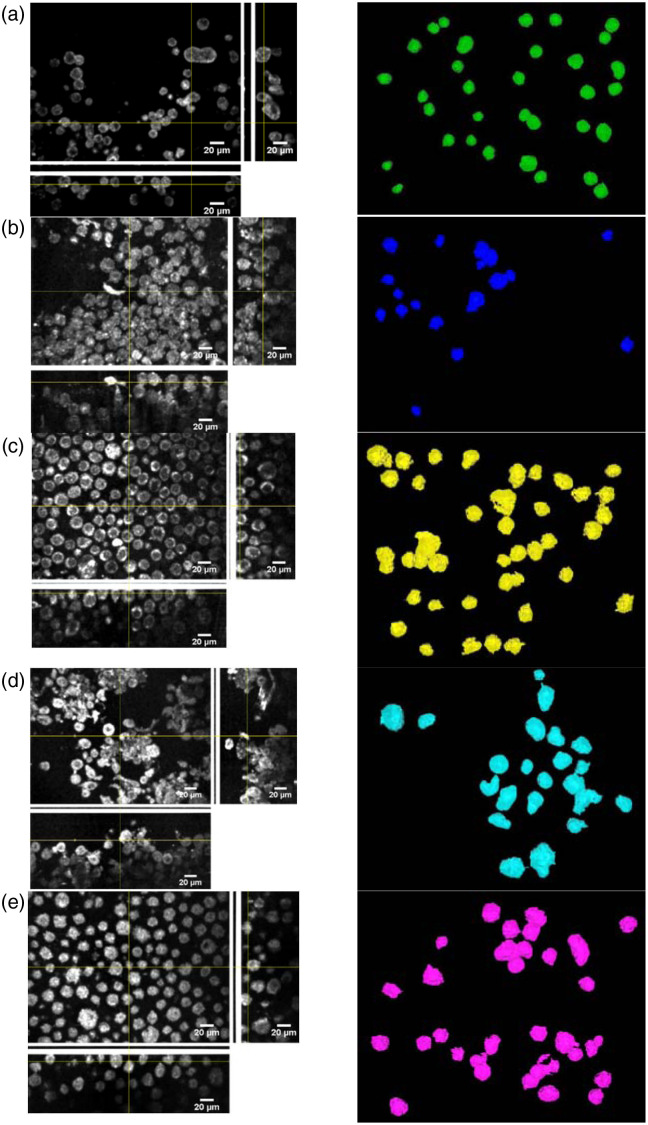
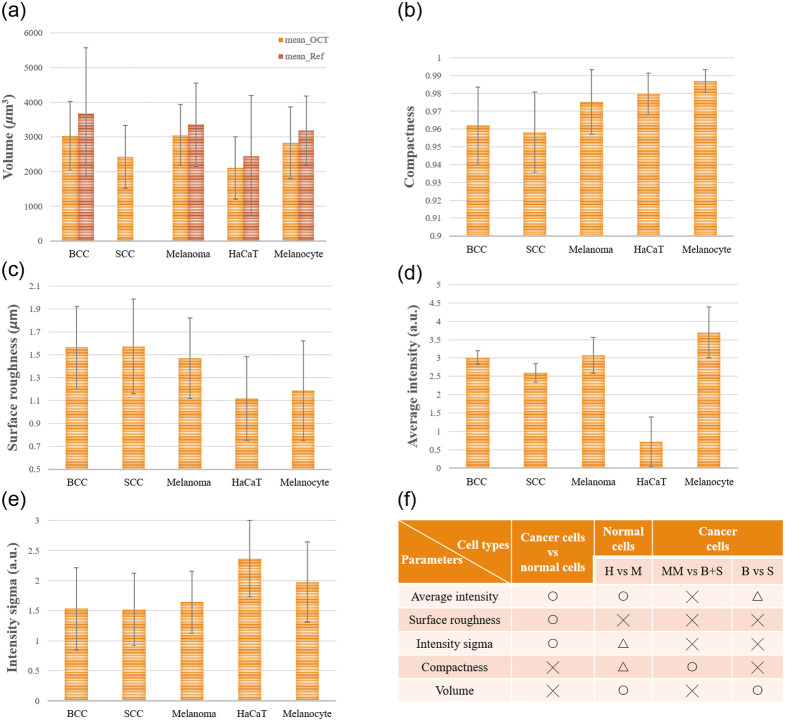
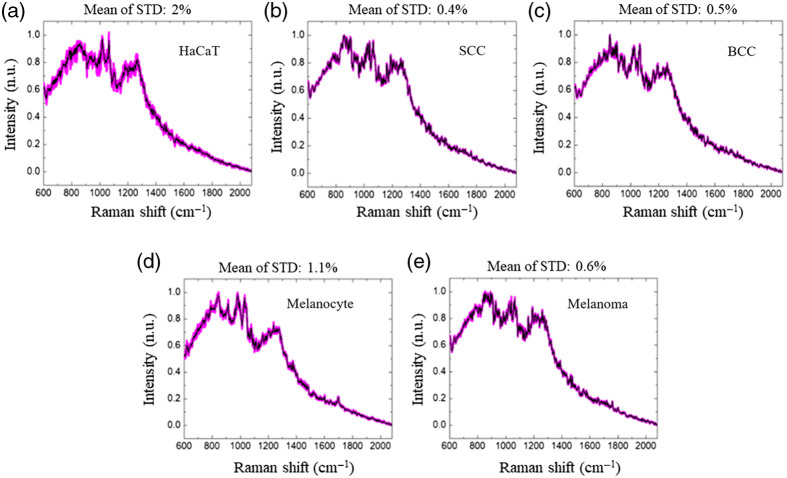
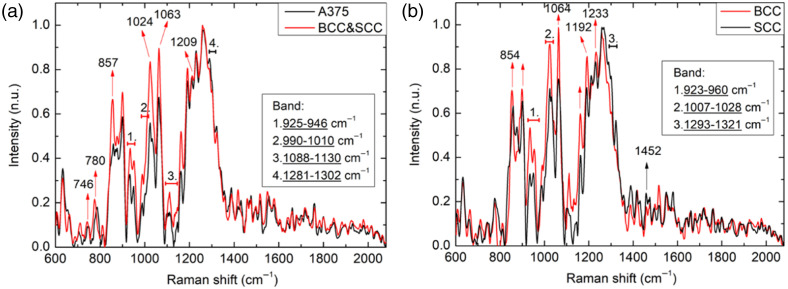
Approach: Both spatial and spectroscopic features were employed for the discrimination of five types of skin cells, including keratinocytes (HaCaT), the cell line of squamous cell carcinoma (A431), the cell line of basal cell carcinoma (BCC-1/KMC), primary melanocytes, and the cell line of melanoma (A375). The cell volume, compactness, surface roughness, average intensity, and internal intensity standard deviation were extracted from the 3D OCT images. After removing the fluorescence components from the acquired Raman spectra, the entire spectra (600 to 2100 cm-1) were used.

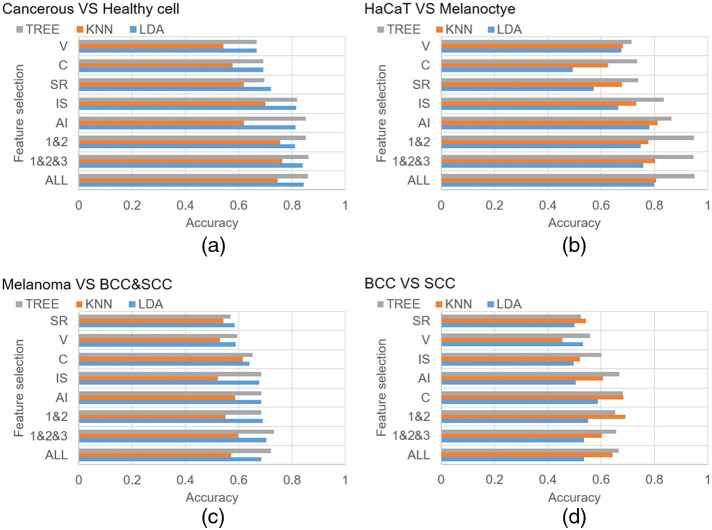
Results: An accuracy of 85% in classifying five types of skin cells was achieved. The cellular-resolution OCT images effectively differentiate cancer and normal cells, whereas Raman spectroscopy can distinguish the cancer cells with nearly 100% accuracy.

Conclusions: Among the OCT image features, cell surface roughness, internal average intensity, and standard deviation of internal intensity distribution effectively differentiate the cancerous and normal cells. The three features also worked well in sorting the keratinocyte and melanocyte. Using the full Raman spectra, the melanoma and keratinocyte-based cell carcinoma cancer cells can be discriminated effectively.

Keywords: Raman spectroscopy; machine learning; optical coherence tomography; skin cancer cells.


Figures

Fig. 1
Fig. 1
Schematic of the integrated OCT (blue box) and Raman (red box) system. The OCT comprises the Ce:YAG crystal fiber light source, a Mirau-type interferometer, and a 2D CCD sensor for fast image acquisition. The Raman system includes an NIR narrow-band laser, a long-wavelength-pass filter, and an OSA. The optics in the Mirau module has AR coatings around the 780 nm wavelength. OBL, objective lens; PBS, polarizing beam splitter; AQWP, achromatic quarter-wave plate; DM, dichroic mirror; LF, line filter; BE, beam expander; LWPF, long-wavelength-pass filter.
Fig. 2
Fig. 2
Output spectrum of Ce3+:YAG crystal fiber.
Fig. 3
Fig. 3
A 3D OCT image of the melanoma cell line. The scale bar is 20  μm.
Fig. 4
Fig. 4
3D views (left column) and ImageJ processed images (right column) of (a) HaCaT, (b) A431, (c) BCC-1/KMC, (d) melanocyte, and (e) A375. The thick vertical and horizontal white lines in (a), (c), (d), and (e) of the left column represent the reflections from the glass slide in the Mirau module. The ImageJ delineates the boundary of the cells.
Fig. 5
Fig. 5
(a) Chart of skin cells’ volume compared with literature. Charts of skin cells’ comparison on (b) compactness, (c) surface roughness, (d) average intensity, and (e) intensity standard deviation. (f) Summary of the effectiveness of the five features on the classification of five cells (H, HaCaT; M, melanocyte; MM, melanoma; B, BCC; S, SCC; O, △, and X represent significant difference (p<0.001), slight difference (p<0.05), and almost no difference (p>0.05), respectively.
Fig. 6
Fig. 6
Raman spectra of (a) HaCaT (keratinocyte cell line), (b) SCC (SCC cell line), (c) BCC (BCC cell line), (d) primary melanocytes, and (e) melanoma cell line. Black lines and pink lines represent the average value and the standard deviation, respectively.
Fig. 7
Fig. 7
Comparison of Raman spectra. (a) Melanoma cell line (A375) versus keratinocyte-based skin cancer cell lines (BCC and SCC) and (b) keratinocyte-based skin cancer cell lines (BCC versus SCC).
Fig. 8
Fig. 8
Discrimination accuracies using 3D OCT cell image features by machine learning algorithms (TREE, decision tree; KNN, K-nearest neighbors; LDA, linear discriminant analysis) on (a) cancerous versus normal cell lines, (b) keratinocyte cell line (HaCaT) versus melanocyte, (c) melanoma versus keratinocyte-based skin cancer cell lines, (d) BCC versus SCC. (V, volume; C, compactness; SR, surface roughness; IS, intensity sigma; AI, average intensity; 1&2, first two top discriminant features; 1&2&3, first three top discriminant features; ALL, all features.).

Similar articles

Cited by

References

    1. Housman T. S., et al. , “Skin cancer is among the most costly of all cancers to treat for the medicare population,” J. Am. Acad. Dermatol. 48, 425–429 (2003).JAADDB10.1067/mjd.2003.186 - DOI - PubMed
    1. Rogers H. W., et al. , “Incidence estimate of nonmelanoma skin cancer in the United States, 2006,” Arch. Dermatol. 146(3), 283–287 (2010).10.1001/archdermatol.2010.19 - DOI - PubMed
    1. Hoey S. E. H., et al. , “Skin cancer trends in Northern Ireland and consequences for provision of dermatology services,” Br. J. Dermatol. 156(6), 1301–1307 (2007).BJDEAZ10.1111/j.1365-2133.2007.07936.x - DOI - PubMed
    1. Donaldson M. R., Coldiron B. M., “No end in sight: the skin cancer epidemic continues,” Semin. Cutan. Med. Surg. 30(1), 3–5 (2011).10.1016/j.sder.2011.01.002 - DOI - PubMed
    1. Sng J., et al. , “Skin cancer trends among Asians living in Singapore from 1968 to 2006,” J. Am. Acad. Dermatol. 61(3), 426–432 (2009).JAADDB10.1016/j.jaad.2009.03.031 - DOI - PubMed

Publication types

MeSH terms