. 2023 Sep 1:14:1240419.
doi: 10.3389/fimmu.2023.1240419. eCollection 2023.

Co-infection of mice with SARS-CoV-2 and Mycobacterium tuberculosis limits early viral replication but does not affect mycobacterial loads

Affiliations

Co-infection of mice with SARS-CoV-2 and Mycobacterium tuberculosis limits early viral replication but does not affect mycobacterial loads

Paul J Baker et al. Front Immunol. .

Abstract

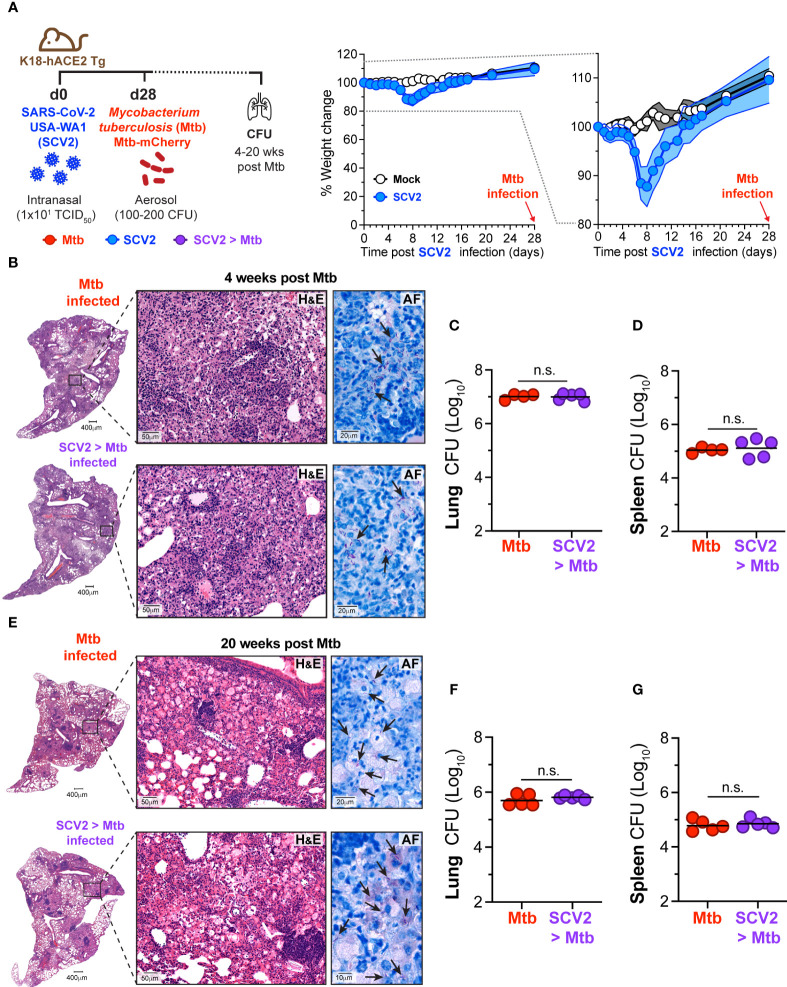
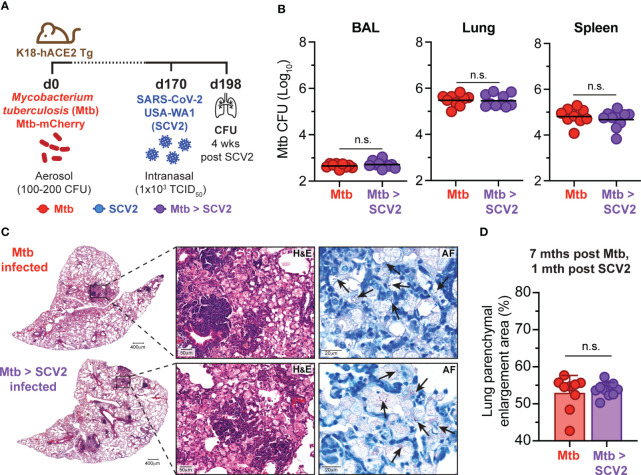
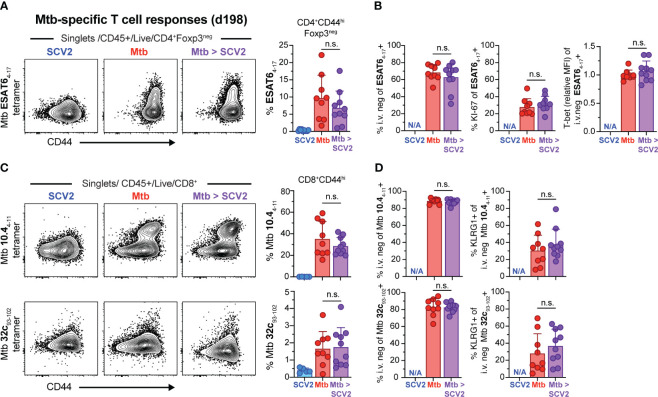
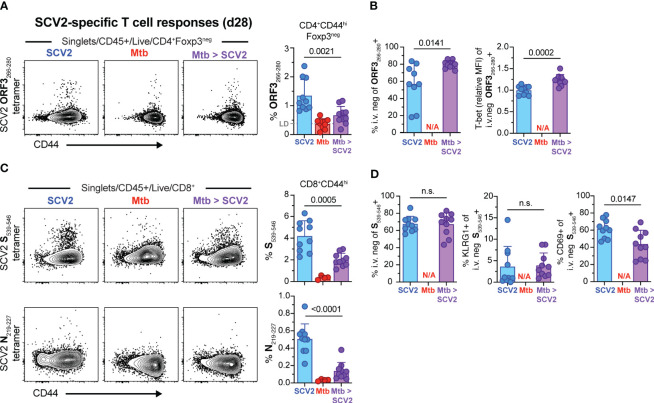
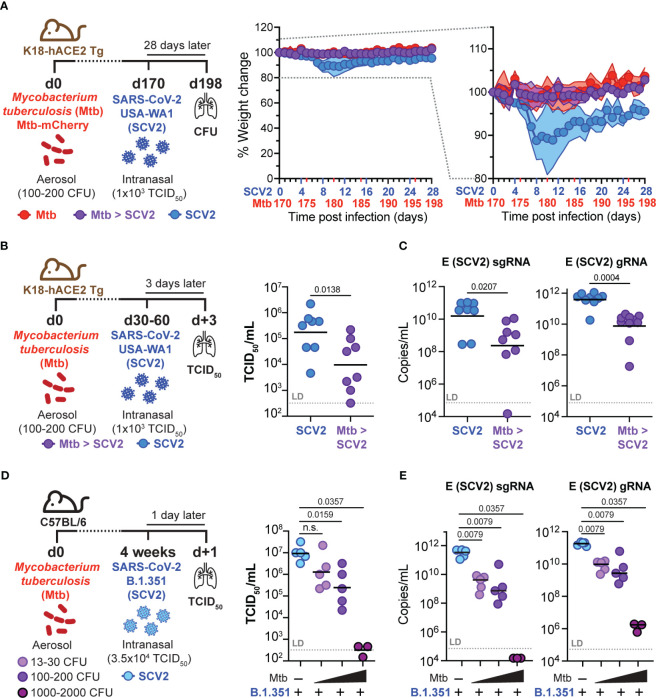
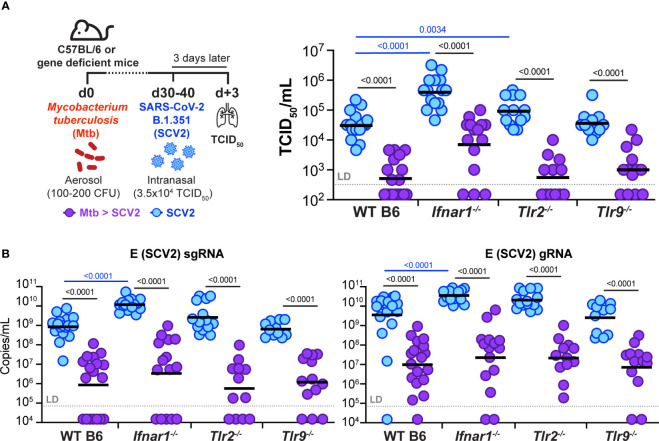
Viral co-infections have been implicated in worsening tuberculosis (TB) and during the COVID-19 pandemic, the global rate of TB-related deaths has increased for the first time in over a decade. We and others have previously shown that a resolved prior or concurrent influenza A virus infection in Mycobacterium tuberculosis (Mtb)-infected mice resulted in increased pulmonary bacterial burden, partly through type I interferon (IFN-I)-dependent mechanisms. Here we investigated whether SARS-CoV-2 (SCV2) co-infection could also negatively affect bacterial control of Mtb. Importantly, we found that K18-hACE2 transgenic mice infected with SCV2 one month before, or months after aerosol Mtb exposure did not display exacerbated Mtb infection-associated pathology, weight loss, nor did they have increased pulmonary bacterial loads. However, pre-existing Mtb infection at the time of exposure to the ancestral SCV2 strain in infected K18-hACE2 transgenic mice or the beta variant (B.1.351) in WT C57Bl/6 mice significantly limited early SCV2 replication in the lung. Mtb-driven protection against SCV2 increased with higher bacterial doses and did not require IFN-I, TLR2 or TLR9 signaling. These data suggest that SCV2 co-infection does not exacerbate Mtb infection in mice, but rather the inflammatory response generated by Mtb infection in the lungs at the time of SCV2 exposure restricts viral replication.

Keywords: COVID-19; SARS-CoV-2; Type-I interferon; co-infection; lung; mycobacterium tuberculosis; tuberculosis.


Conflict of interest statement

The authors declare that the research was conducted in the absence of any commercial or financial relationships that could be construed as a potential conflict of interest.

Figures

Figure 1
Figure 1
SCV2 infection one month before Mtb infection does not exacerbate Mtb disease. (A) Left: Schematic of experimental set-up where K18-hACE2 Tg mice were infected intranasally with 10 TCID50 SCV2 (USA-WA1/2020) or mock supernatant 28 days before aerosol infection with 100 – 200 CFU Mtb and mice were euthanized either 4 or 20 weeks after Mtb infection. Middle: Weight loss of K18-hACE2 Tg mice after SCV2 infection and before Mtb infection Right: Selected range of weight change curve to highlight differences in weight loss between SCV2 and Mock infected groups (n= 4-5 per group from one experiment representative of two independent experiments, mean ± SD as traveling error bars). (B) Representative hematoxylin and eosin (H&E) and acid-fast AF staining of lung tissue from mice at 4 weeks post Mtb infection, with or without prior SCV2 infection (arrows indicate examples of Mtb bacteria, scale bars indicate magnification). (C, D) Mtb CFU in (C) lungs and (D) spleens of mice at 4 weeks post Mtb infection. (E) Representative H&E and AF staining of lung tissue 20 weeks post Mtb infection with and without prior SCV2 infection (arrows indicate examples of Mtb bacteria, scale bars indicate magnification). (F, G) Mtb CFU in (F) lungs and (G) spleens of mice at 20 weeks post Mtb infection (n= 4-5 per group from one independent experiment per timepoint, geometric mean, two-tailed Mann Whitney test). n.s. = not significant.
Figure 2
Figure 2
SCV2 co-infection does not exacerbate Mtb disease. (A) Schematic of experimental set-up where K18-hACE2 Tg mice were aerosol infected with 100 – 200 CFU Mtb (H37Rv-mCherry) 170 days before being intranasally infected with 1x10³ TCID50 SCV2 (USA-WA1/2020) or mock supernatant, mice were euthanized 1 month after SCV2 infection. (B) Mtb CFU in BALs, lungs and spleens (n= 9-10 per group, data combined from two independent experiments, geometric mean). (C) Representative H&E and AF staining of lung tissue from mice as described in (A) (arrows indicate examples of Mtb bacteria, scale bars indicate magnification) (D) Quantification of percentage of parenchymal enlargement from H&E shown in C) (n= 9-10 per group from two independent experiments, mean ± S.D., two-tailed Mann Whitney test). n.s. = not significant.
Figure 3
Figure 3
SCV2 co-infection does not negatively affect Mtb-specific CD4+ or CD8+ T cells. Example FACS plots and summary data from the lungs of mice described in Figure 2A . (A) Example FACS plots of ESAT64-17 MHC-II tetramer staining of CD4+ Foxp3- cells and proportion of ESAT64-17-specific cells within activated CD44hiCD4+Foxp3- T cells (B) Quantification of ESAT64-17 tetramer-positive cells that are recruited into the lung parenchyma (CD45 i.v.neg), positive for Ki-67 and relative expression intensity (geometric mean fluorescent intensity, MFI) of T-bet in lung resident ESAT64-17 tetramer-positive CD4+ T cells. (C) Example FACS plots of Mtb TB10.44-11 (top) and Mtb 32c93-102 (bottom) MHC-I tetramer staining of CD8+ T cells and proportion of Mtb TB10.44-11 or Mtb 32c93-102 -specific CD8+ T cells gated on activated CD44hiCD8+ T cells (D) Quantification of Mtb TB10.44-11 (top) and Mtb 32c93-102 (bottom) tetramer-positive cells recruited into the lung parenchyma (CD45 i.v.neg) and their expression of KLRG1 (N/A= not applicable, n= 9-10 per group, data combined from 2 independent experiments, mean ± S.D., two-tailed Mann Whitney test). n.s. = not significant.
Figure 4
Figure 4
SCV2 co-infection of Mtb infected mice results in decreased SCV2-specific CD4+ and CD8+ T cells in the lungs 4 weeks later. Example FACS plots and summary data from the lungs of mice described in Figure 2A . (A) Example FACS plots of SCV2 ORF3266-280 MHC-II tetramer staining of CD4+ Foxp3- cells and proportion of ORF3266-28-specific cells within activated CD44hiCD4+Foxp3- T cells 4 weeks after SCV2 infection of naïve (blue) or 7-month Mtb-infected mice (purple). LD = Limit of Detection is indicated based on non-specific tetramer binding in Mtb only infected groups (red) (B) Quantification of ORF3266-280 tetramer-positive cells residing in lung parenchyma (CD45 i.v.neg) and relative expression intensity (geometric mean fluorescent intensity, MFI) of T-bet in lung resident ORF3266-280 tetramer-positive CD4+ T cells. (C) Example FACS plots of SCV2 S539-546 (top) and SCV2 N219-227 (bottom) MHC-I tetramer staining of CD8+ T cells and proportion of S539-546- or N219-227- specific CD8+ T cells gated on activated CD44hiCD8+ T cells (D) Quantification of SCV2 S539-546 tetramer-positive cells recruited into the lung parenchyma (CD45 i.v.neg) and their expression of KLRG1 and CD69. (N/A= not applicable, n= 9-10 per group, data combined from 2 independent experiments, mean ± S.D., two-tailed Mann Whitney test). n.s. = not significant.
Figure 5
Figure 5
Pre-existing Mtb infection lowers early SCV2 viral burden in an Mtb dose-dependent manner. (A) Left: Schematic of experimental set-up where K18-hACE2 Tg mice were infected with Mtb 170 days before being intranasally infected with 1x10³ TCID50 SCV2 (USA-WA1/2020) or mock supernatant, mice were euthanized 28 days after SCV2 infection. Middle: Weight loss of SCV2 infected K18-hACE2 Tg mice with (purple) or without (blue) underlying Mtb infection Right: Selected range of weight change curve to highlight differences in weight loss between SCV2 only and co-infected groups (n= 9-10 per group pooled from 2 independent experiments, mean ± SD as traveling error bars). (B) Left: Schematic of experimental set-up where K18-hACE2 Tg mice were infected with Mtb by aerosol exposure 1-2 months before infection with 1x10³ TCID50 SCV2 (USA-WA1/2020), mice were euthanized 3 days after SCV2 infection. Right: SCV2 viral load in lungs as measured by TCID50 and (C) qPCR for the sub-genomic (sg) or genomic (g) SCV2 E gene (n= 8 per group, data combined from two independent experiments, geometric mean, two-tailed Mann Whitney test, LD= limit of detection). (D) Left: Schematic of experimental set-up where C57Bl/6 WT mice were infected with various doses of Mtb (H37Rv-mCherry) by aerosol exposure 4 weeks before being intranasally infected with 3.5x10⁴ TCID50 SCV2 (B.1.351), mice were euthanized 1 day later. Right: Viral loads in lung as measured by TCID50 on Vero E6 cells and (E) qPCR for the SCV2 E gene sgRNA and gRNA (right) (n= 3 – 5 per group from one experiment representative of two independent experiments, geometric mean, statistical significance calculated by two-tailed Mann Whitney test, LD= limit of detection). n.s. = not significant.
Figure 6
Figure 6
Underlying Mtb infection reduces SCV2 viral burden independent of IFNAR1, TLR2, or TLR9. (A) Left: Schematic of experimental set-up where C57Bl/6 WT, Ifnar1 -/-, Tlr2 -/- or Tlr9 -/- mice were infected with Mtb 30-40 days prior to being intranasally infected with 3.5x10⁴ TCID50 SCV2 (B.1.351), mice were euthanized 3 days after SCV2 infection. Right: SCV2 viral load in lungs as measured by TCID50 on Vero E6 cells. (B) SCV2 viral loads in lungs as measured by qPCR for the SCV2 E sgRNA (left) or gRNA (right) (n= 11-19 per group, data combined from four independent experiments, geometric mean, two-tailed Mann Whitney test (only significant p values shown), LD= limit of detection; significant differences are indicated by blue comparisons between SCV2 only groups (blue), significant differences are indicated by black comparisons between SCV2 (blue) and coinfected groups (purple).

Similar articles

Cited by

References

    1. Brundage JF. Interactions between influenza and bacterial respiratory pathogens: implications for pandemic preparedness. Lancet Infect Dis (2006) 6:303–12. doi: 10.1016/S1473-3099(06)70466-2 - DOI - PMC - PubMed
    1. Morris DE, Cleary DW, Clarke SC. Secondary bacterial infections associated with influenza pandemics. Front Microbiol (2017) 8:1041. doi: 10.3389/fmicb.2017.01041 - DOI - PMC - PubMed
    1. Bakaletz LO. Viral potentiation of bacterial superinfection of the respiratory tract. Trends Microbiol (1995) 3:110–4. doi: 10.1016/S0966-842X(00)88892-7 - DOI - PubMed
    1. Bakaletz LO. Viral–bacterial co-infections in the respiratory tract. Curr Opin Microbiol (2017) 35:30–5. doi: 10.1016/j.mib.2016.11.003 - DOI - PMC - PubMed
    1. Obar JJ, Shepardson KM. Coinfections in the lung: How viral infection creates a favorable environment for bacterial and fungal infections. PloS Pathog (2023) 19:e1011334. doi: 10.1371/journal.ppat.1011334 - DOI - PMC - PubMed

Publication types

Supplementary concepts