

Evaluating progress in automatic chest X-ray radiology report generation
- PMID: 37720336
- PMCID: PMC10499844
- DOI: 10.1016/j.patter.2023.100802
Evaluating progress in automatic chest X-ray radiology report generation
Abstract
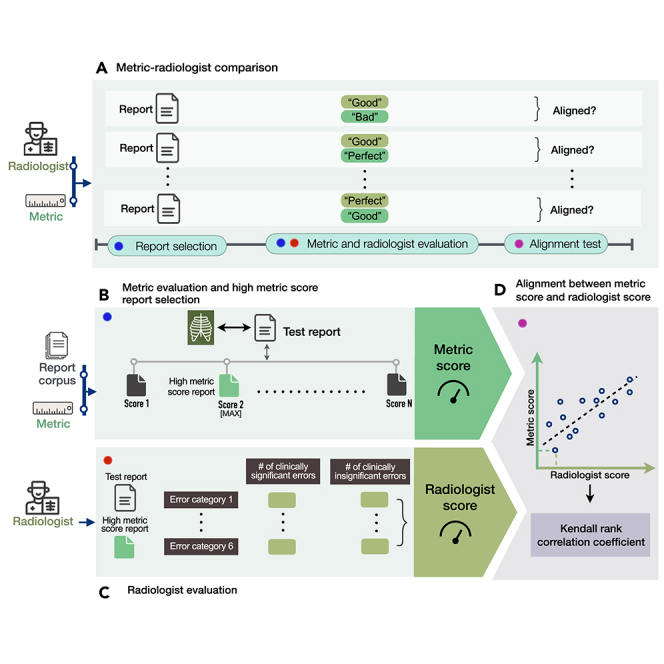
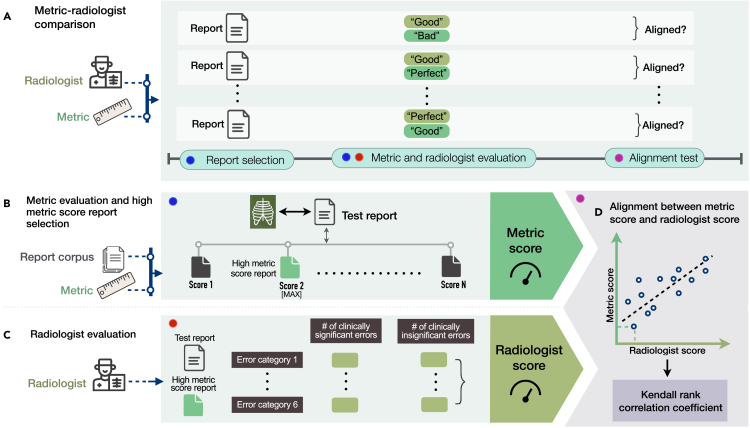
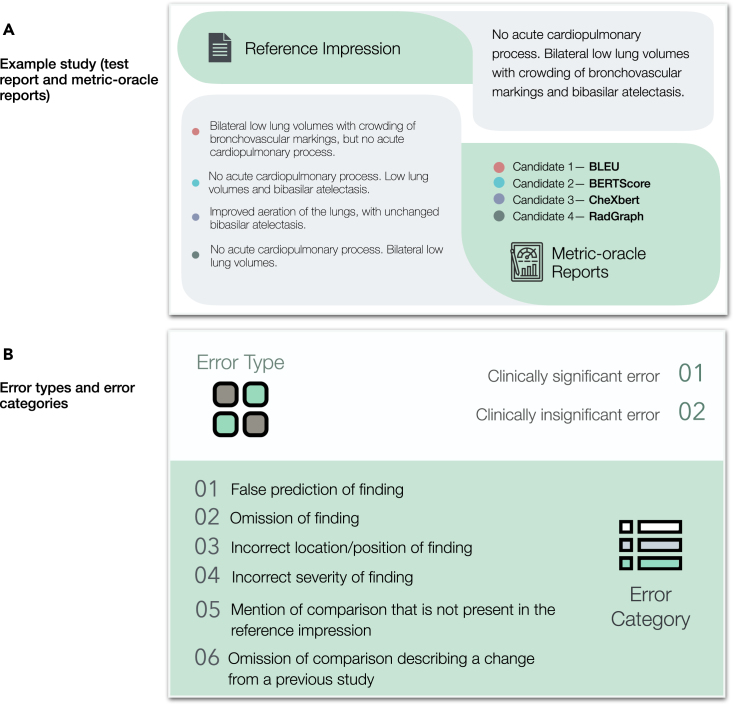
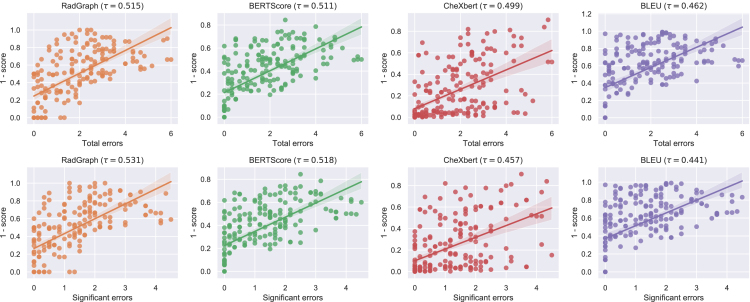
Artificial intelligence (AI) models for automatic generation of narrative radiology reports from images have the potential to enhance efficiency and reduce the workload of radiologists. However, evaluating the correctness of these reports requires metrics that can capture clinically pertinent differences. In this study, we investigate the alignment between automated metrics and radiologists' scoring of errors in report generation. We address the limitations of existing metrics by proposing new metrics, RadGraph F1 and RadCliQ, which demonstrate stronger correlation with radiologists' evaluations. In addition, we analyze the failure modes of the metrics to understand their limitations and provide guidance for metric selection and interpretation. This study establishes RadGraph F1 and RadCliQ as meaningful metrics for guiding future research in radiology report generation.
Keywords: alignment with radiologists; automatic metrics; chest X-ray radiology report generation.
© 2023.
Conflict of interest statement
The authors declare no competing non-financial interests but the following competing financial interests: I.P. is a consultant for MD.ai and Diagnosticos da America (Dasa). C.P.L. serves on the board of directors and is a shareholder of Bunkerhill Health. He is an advisor and option holder for GalileoCDS, Sirona Medical, Adra, and Kheiron. He is an advisor to Sixth Street and an option holder in whiterabbit.ai. His research program has received grant or gift support from Carestream, Clairity, GE Healthcare, Google Cloud, IBM, IDEXX, Hospital Israelita Albert Einstein, Kheiron, Lambda, Lunit, Microsoft, Nightingale Open Science, Nines, Philips, Subtle Medical, VinBrain, Whiterabbit.ai, the Paustenbach Fund, the Lowenstein Foundation, and the Gordon and Betty Moore Foundation.
Figures
References
-
- Rajpurkar P., Chen E., Banerjee O., Topol E.J. AI in health and medicine. Nat. Med. 2022;28:31–38. - PubMed
-
- Rajpurkar P., Joshi A., Pareek A., Ng A.Y., Lungren M.P. Proceedings of the Conference on Health, Inference, and Learning. Association for Computing Machinery; 2021. CheXternal: Generalization of Deep Learning Models for Chest X-ray Interpretation to Photos of Chest X-rays and External Clinical Settings; pp. 125–132.
-
- Rajpurkar P., Lungren M.P. The Current and Future State of AI Interpretation of Medical Images. N. Engl. J. Med. Overseas. Ed. 2023;388:1981–1990. - PubMed
Grants and funding
LinkOut - more resources
Full Text Sources
Other Literature Sources
