

NKX3.1 Expression Contributes to Epithelial-Mesenchymal Transition of Prostate Cancer Cells
- PMID: 37720744
- PMCID: PMC10500679
- DOI: 10.1021/acsomega.3c03127
NKX3.1 Expression Contributes to Epithelial-Mesenchymal Transition of Prostate Cancer Cells
Abstract
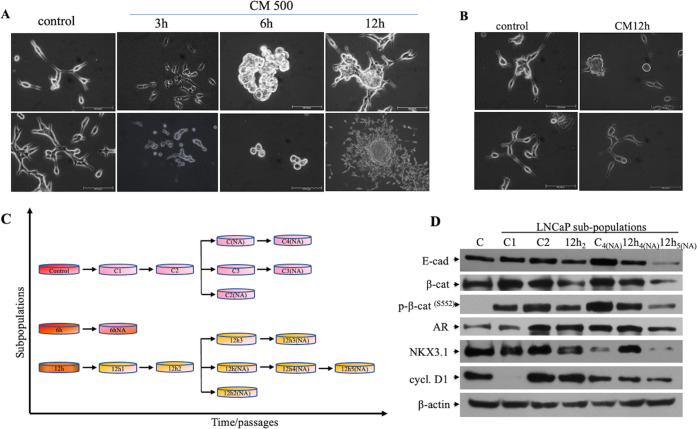
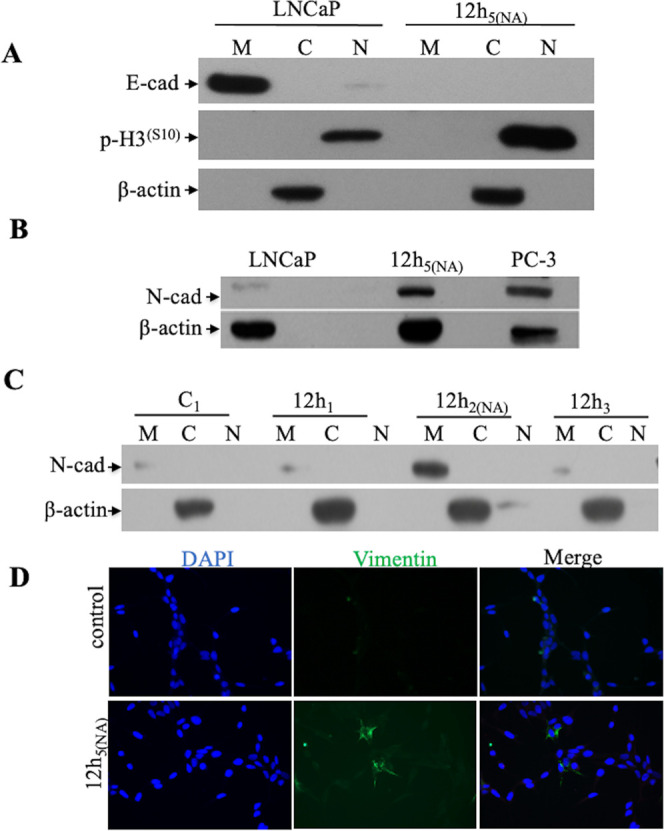
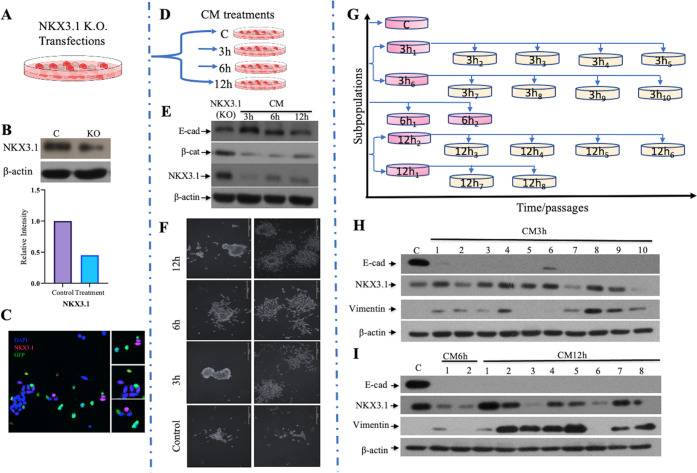
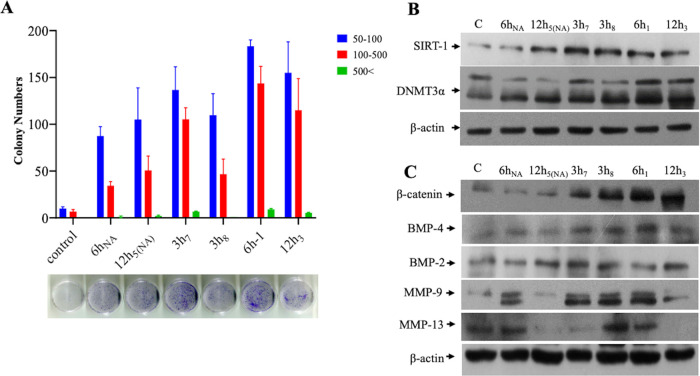
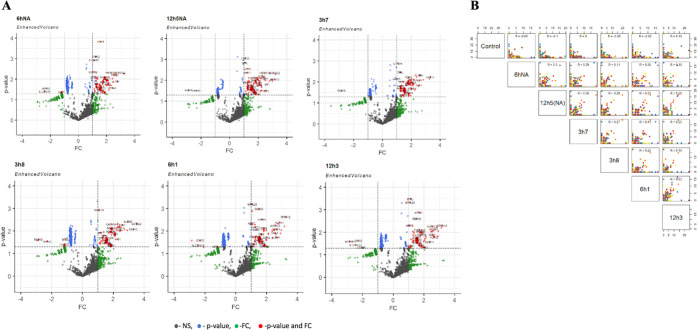
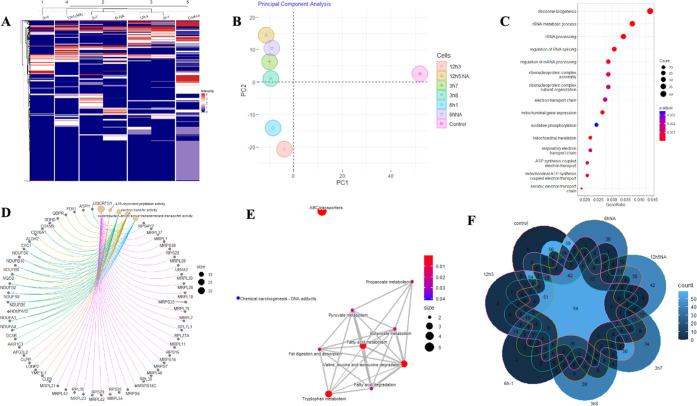
Studies demonstrate that inflammation synergizes with high-grade aggressive prostate tumor development and ultimately metastatic spread, in which a lot of work has been done in recent years. However, the clear mechanism of inflammation inciting prostate cancer remains largely uncharacterized. Our previous study has shown that the conditioned media (CM)-mediated LNCaP cell migration is partially correlated with the loss of expression of the tumor suppressor NKX3.1. Here, we continue to investigate the inflammation-mediated migration of prostate cancer cells, and the role of NKX3.1 in this process to gain insights into cell migration-related changes comprehensively. Earlier, the model of inflammation in the tumor microenvironment have been optimized by our research group; here, we continue to investigate the time-dependent effect of CM exposure together with NKX3.1 changes, in which we observed that these changes play important roles in gaining heterogeneous epithelial-to-mesenchymal transition (EMT) phenotype. Hence, this is an important parameter of tumor progression; we depleted NKX3.1 expression using the CRISPR/Cas9 system and examined the migrating cell clusters after exposure to inflammatory cytokines. We found that the migrated cells clearly demonstrate reversible loss of E-cadherin expression, which is consistent with subsequent vimentin expression alterations in comparison to control cells. Moreover, the data suggest that the AR-mediated transcriptional program also contributes to mesenchymal-to-epithelial transition (MET) in prostate cancer progression. Furthermore, the quantitative proteomic analysis showed that migrated subpopulations from the same cell line presented different phenotypes in which the proteins overexpressed are involved in cell metabolism and RNA processing. According to KEGG pathway analysis, the ABC transporters were found to be the most significant. Thus, the dynamic process of cellular migration favors diverse genetic compositions under changing tumor microenvironments. The different levels of invasiveness are supported by shifting the cells in between these EMT and MET phenotypes.
© 2023 The Authors. Published by American Chemical Society.
Conflict of interest statement
The authors declare no competing financial interest.
Figures
Similar articles
-
TNFα-mediated loss of β-catenin/E-cadherin association and subsequent increase in cell migration is partially restored by NKX3.1 expression in prostate cells.PLoS One. 2014 Oct 31;9(10):e109868. doi: 10.1371/journal.pone.0109868. eCollection 2014. PLoS One. 2014. PMID: 25360740 Free PMC article.
-
SCAND1 Reverses Epithelial-to-Mesenchymal Transition (EMT) and Suppresses Prostate Cancer Growth and Migration.Cells. 2022 Dec 10;11(24):3993. doi: 10.3390/cells11243993. Cells. 2022. PMID: 36552758 Free PMC article.
-
Anti-metastatic effect of GV1001 on prostate cancer cells; roles of GnRHR-mediated Gαs-cAMP pathway and AR-YAP1 axis.Cell Biosci. 2021 Nov 7;11(1):191. doi: 10.1186/s13578-021-00704-3. Cell Biosci. 2021. PMID: 34743733 Free PMC article.
-
Mesenchymal-Epithelial Transition and Circulating Tumor Cells in Small Cell Lung Cancer.Adv Exp Med Biol. 2017;994:229-245. doi: 10.1007/978-3-319-55947-6_12. Adv Exp Med Biol. 2017. PMID: 28560677 Review.
-
The matrix environmental and cell mechanical properties regulate cell migration and contribute to the invasive phenotype of cancer cells.Rep Prog Phys. 2019 Jun;82(6):064602. doi: 10.1088/1361-6633/ab1628. Epub 2019 Apr 4. Rep Prog Phys. 2019. PMID: 30947151 Review.
References
-
- Panigrahi G. K.; Praharaj P. P.; Kittaka H.; Mridha A. R.; Black O. M.; Singh R.; Mercer R.; van Bokhoven A.; Torkko K. C.; Agarwal C.; Agarwal R.; Abd Elmageed Z. Y.; Yadav H.; Mishra S. K.; Deep G. Exosome Proteomic Analyses Identify Inflammatory Phenotype and Novel Biomarkers in African American Prostate Cancer Patients. Cancer Med. 2019, 8, 1110–1123. 10.1002/cam4.1885. - DOI - PMC - PubMed
LinkOut - more resources
Full Text Sources
Research Materials
Miscellaneous
