Cognitive control subprocess deficits and compensatory modulation mechanisms in patients with frontal lobe injury revealed by EEG markers: a basic study to guide brain stimulation
- PMID: 37720910
- PMCID: PMC10503333
- DOI: 10.1136/gpsych-2023-101144
Cognitive control subprocess deficits and compensatory modulation mechanisms in patients with frontal lobe injury revealed by EEG markers: a basic study to guide brain stimulation
Abstract
Background: Frontal lobe injury (FLI) is related to cognitive control impairments, but the influences of FLI on the internal subprocesses of cognitive control remain unclear.
Aims: We sought to identify specific biomarkers for long-term dysfunction or compensatory modulation in different cognitive control subprocesses.
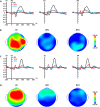
Methods: A retrospective case-control study was conducted. Event-related potentials (ERP), oscillations and functional connectivity were used to analyse electroencephalography (EEG) data from 12 patients with unilateral frontal lobe injury (UFLI), 12 patients with bilateral frontal lobe injury (BFLI) and 26 healthy controls (HCs) during a Go/NoGo task, which included several subprocesses: perceptual processing, anticipatory preparation, conflict monitoring and response decision.
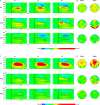
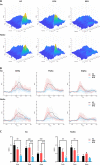
Results: Compared with the HC group, N2 (the second negative peak in the averaged ERP waveform) latency, and frontal and parietal oscillations were decreased only in the BFLI group, whereas P3 (the third positive peak in the averaged ERP waveform) amplitudes and sensorimotor oscillations were decreased in both patient groups. The functional connectivity of the four subprocesses was as follows: alpha connections of posterior networks in the BFLI group were lower than in the HC and UFLI groups, and these alpha connections were negatively correlated with neuropsychological tests. Theta connections of the dorsal frontoparietal network in the bilateral hemispheres of the BFLI group were lower than in the HC and UFLI groups, and these connections in the uninjured hemisphere of the UFLI group were higher than in the HC group, which were negatively correlated with behavioural performances. Delta and theta connections of the midfrontal-related networks in the BFLI group were lower than in the HC group. Theta across-network connections in the HC group were higher than in the BFLI group but lower than in the UFLI group.
Conclusions: The enhancement of low-frequency connections reflects compensatory mechanisms. In contrast, alpha connections are the opposite, therefore revealing more abnormal neural activity and less compensatory connectivity as the severity of injury increases. The nodes of the above networks may serve as stimulating targets for early treatment to restore corresponding functions. EEG biomarkers can measure neuromodulation effects in heterogeneous patients.
Keywords: Cerebral Cortex; Cognitive Dysfunction; Executive Function; Prefrontal Cortex; Trauma and Stressor Related Disorders.
© Author(s) (or their employer(s)) 2023. Re-use permitted under CC BY-NC. No commercial re-use. See rights and permissions. Published by BMJ.
Conflict of interest statement
Competing interests: None declared.
Figures


Similar articles
-
Cognitive deficits and rehabilitation mechanisms in mild traumatic brain injury patients revealed by EEG connectivity markers.Clin Neurophysiol. 2021 Feb;132(2):554-567. doi: 10.1016/j.clinph.2020.11.034. Epub 2020 Dec 25. Clin Neurophysiol. 2021. PMID: 33453686
-
Connectivity and local activity within the fronto-posterior brain network in schizophrenia.Suppl Clin Neurophysiol. 2013;62:181-96. doi: 10.1016/b978-0-7020-5307-8.00012-0. Suppl Clin Neurophysiol. 2013. PMID: 24053040
-
Reduced Frontal Nogo-N2 With Uncompromised Response Inhibition During Transcutaneous Vagus Nerve Stimulation-More Efficient Cognitive Control?Front Hum Neurosci. 2020 Oct 6;14:561780. doi: 10.3389/fnhum.2020.561780. eCollection 2020. Front Hum Neurosci. 2020. PMID: 33132877 Free PMC article.
-
[Hypofrontality and negative symptoms in schizophrenia: synthesis of anatomic and neuropsychological knowledge and ecological perspectives].Encephale. 2001 Sep-Oct;27(5):405-15. Encephale. 2001. PMID: 11760690 Review. French.
-
The neural mechanism of non-phase-locked EEG activity in task switching.Neurosci Lett. 2023 Jan 1;792:136957. doi: 10.1016/j.neulet.2022.136957. Epub 2022 Nov 5. Neurosci Lett. 2023. PMID: 36347341 Review.
Cited by
-
Association between the frontoparietal network, clinical symptoms and treatment response in individuals with untreated anorexia nervosa.Gen Psychiatr. 2024 May 27;37(3):e101389. doi: 10.1136/gpsych-2023-101389. eCollection 2024. Gen Psychiatr. 2024. PMID: 38808176 Free PMC article.
-
Neuroimaging Insights into the Public Health Burden of Neuropsychiatric Disorders: A Systematic Review of Electroencephalography-Based Cognitive Biomarkers.Medicina (Kaunas). 2025 May 28;61(6):1003. doi: 10.3390/medicina61061003. Medicina (Kaunas). 2025. PMID: 40572691 Free PMC article.
-
Functional and structural brain remodeling in patients with degenerative cervical myelopathy following cervical decompression surgery.Commun Med (Lond). 2025 May 22;5(1):191. doi: 10.1038/s43856-025-00909-4. Commun Med (Lond). 2025. PMID: 40404780 Free PMC article.
-
Consensus on rapid screening for prodromal Alzheimer's disease in China.Gen Psychiatr. 2024 Feb 1;37(1):e101310. doi: 10.1136/gpsych-2023-101310. eCollection 2024. Gen Psychiatr. 2024. PMID: 38313393 Free PMC article. Review.
-
Resting-state electroencephalography delta and theta bands as compensatory oscillations in chronic neuropathic pain: a secondary data analysis.Brain Netw Modul. 2024 Apr-Jun;3(2):52-60. doi: 10.4103/bnm.bnm_17_24. Epub 2024 Jun 27. Brain Netw Modul. 2024. PMID: 39119588 Free PMC article.
References
LinkOut - more resources
Full Text Sources
