. 2023 Nov 14;148(20):1582-1592.
doi: 10.1161/CIRCULATIONAHA.123.066002. Epub 2023 Sep 18.

DNA Damage and Nuclear Morphological Changes in Cardiac Hypertrophy Are Mediated by SNRK Through Actin Depolymerization

Affiliations

DNA Damage and Nuclear Morphological Changes in Cardiac Hypertrophy Are Mediated by SNRK Through Actin Depolymerization

Paulina J Stanczyk et al. Circulation. .

Abstract

Background: Proper nuclear organization is critical for cardiomyocyte function, because global structural remodeling of nuclear morphology and chromatin structure underpins the development and progression of cardiovascular disease. Previous reports have implicated a role for DNA damage in cardiac hypertrophy; however, the mechanism for this process is not well delineated. AMPK (AMP-activated protein kinase) family of proteins regulates metabolism and DNA damage response (DDR). Here, we examine whether a member of this family, SNRK (SNF1-related kinase), which plays a role in cardiac metabolism, is also involved in hypertrophic remodeling through changes in DDR and structural properties of the nucleus.

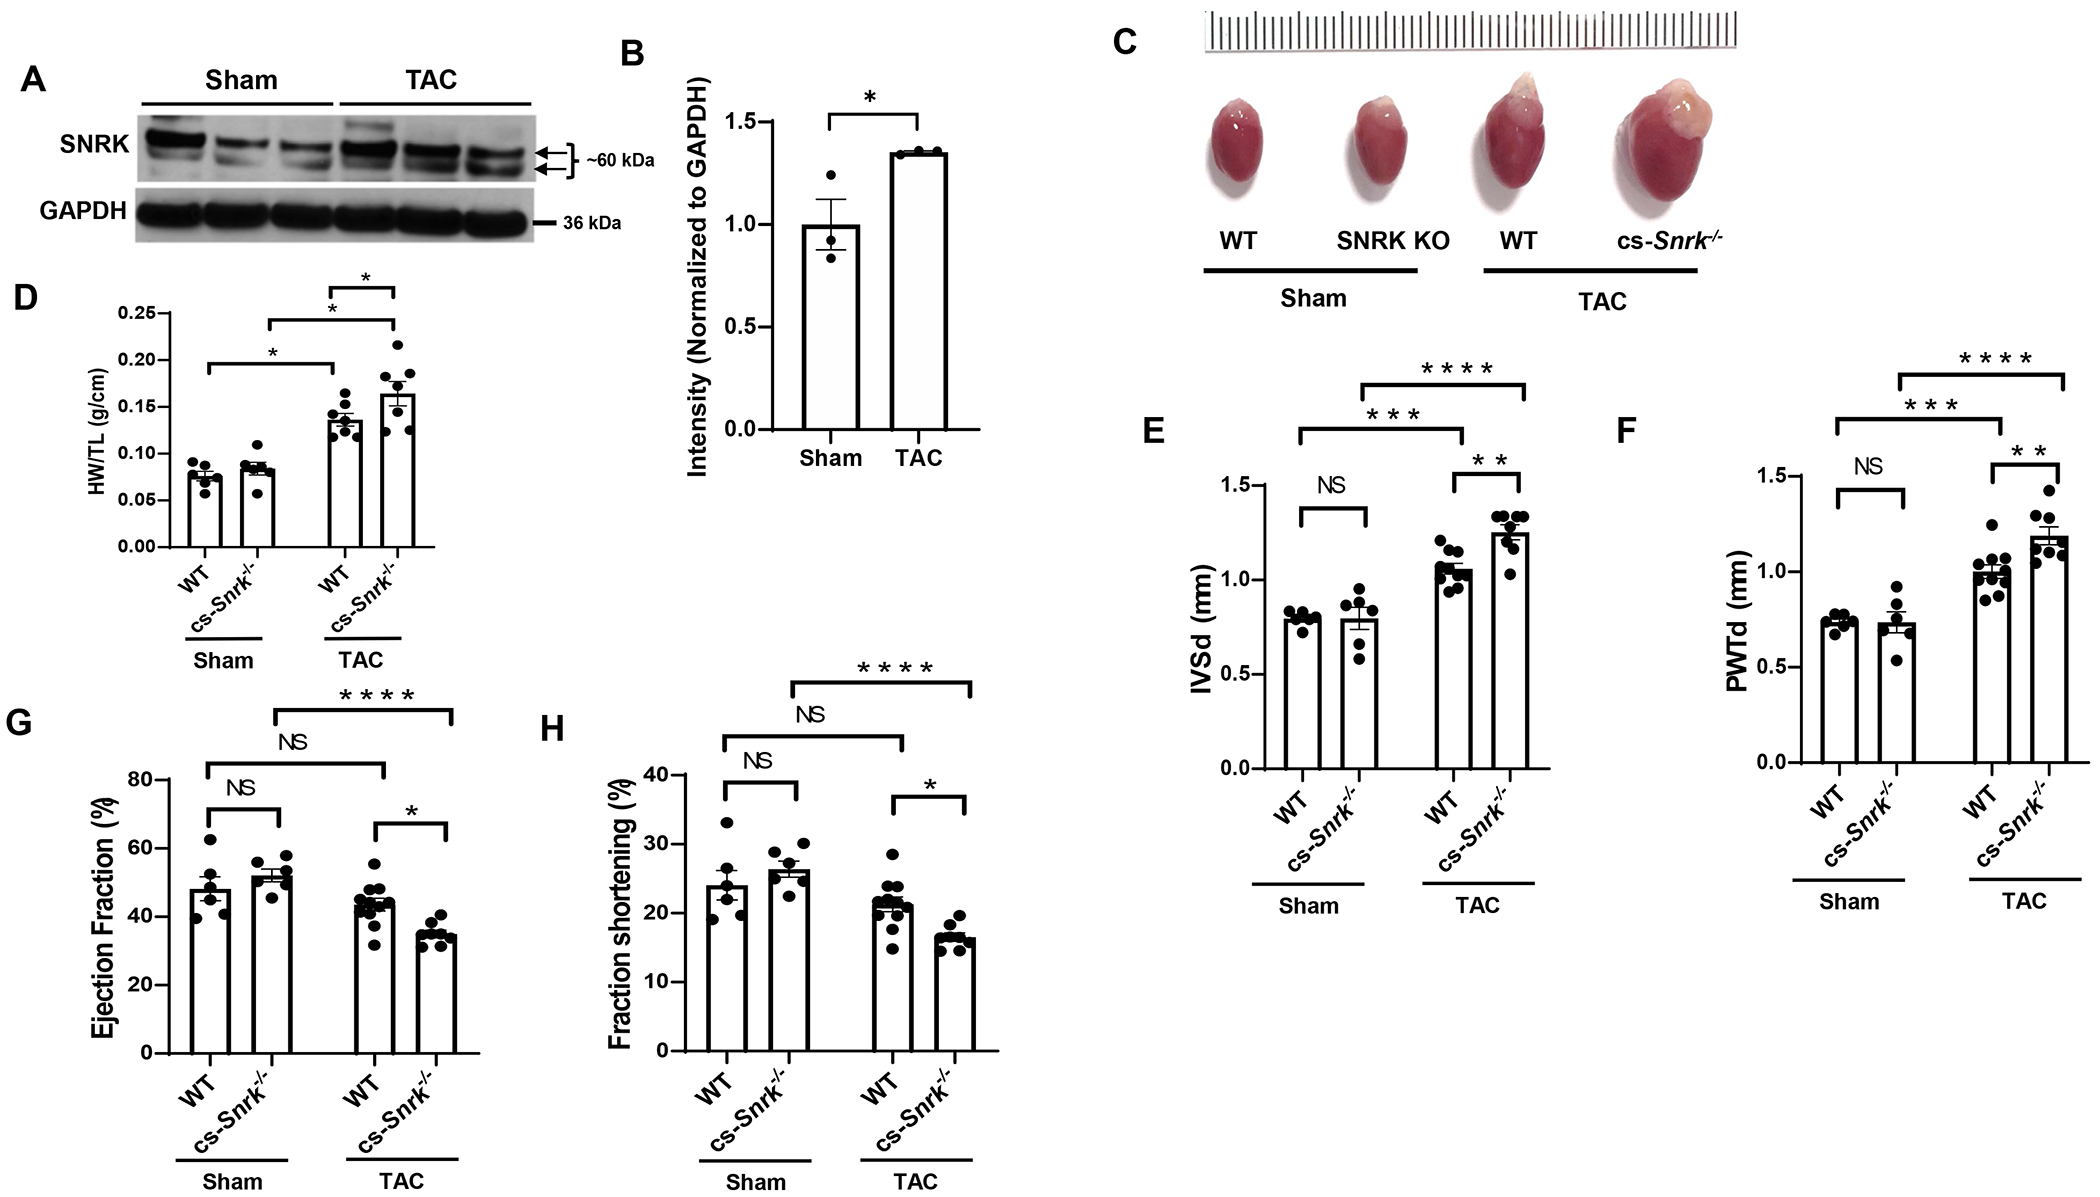
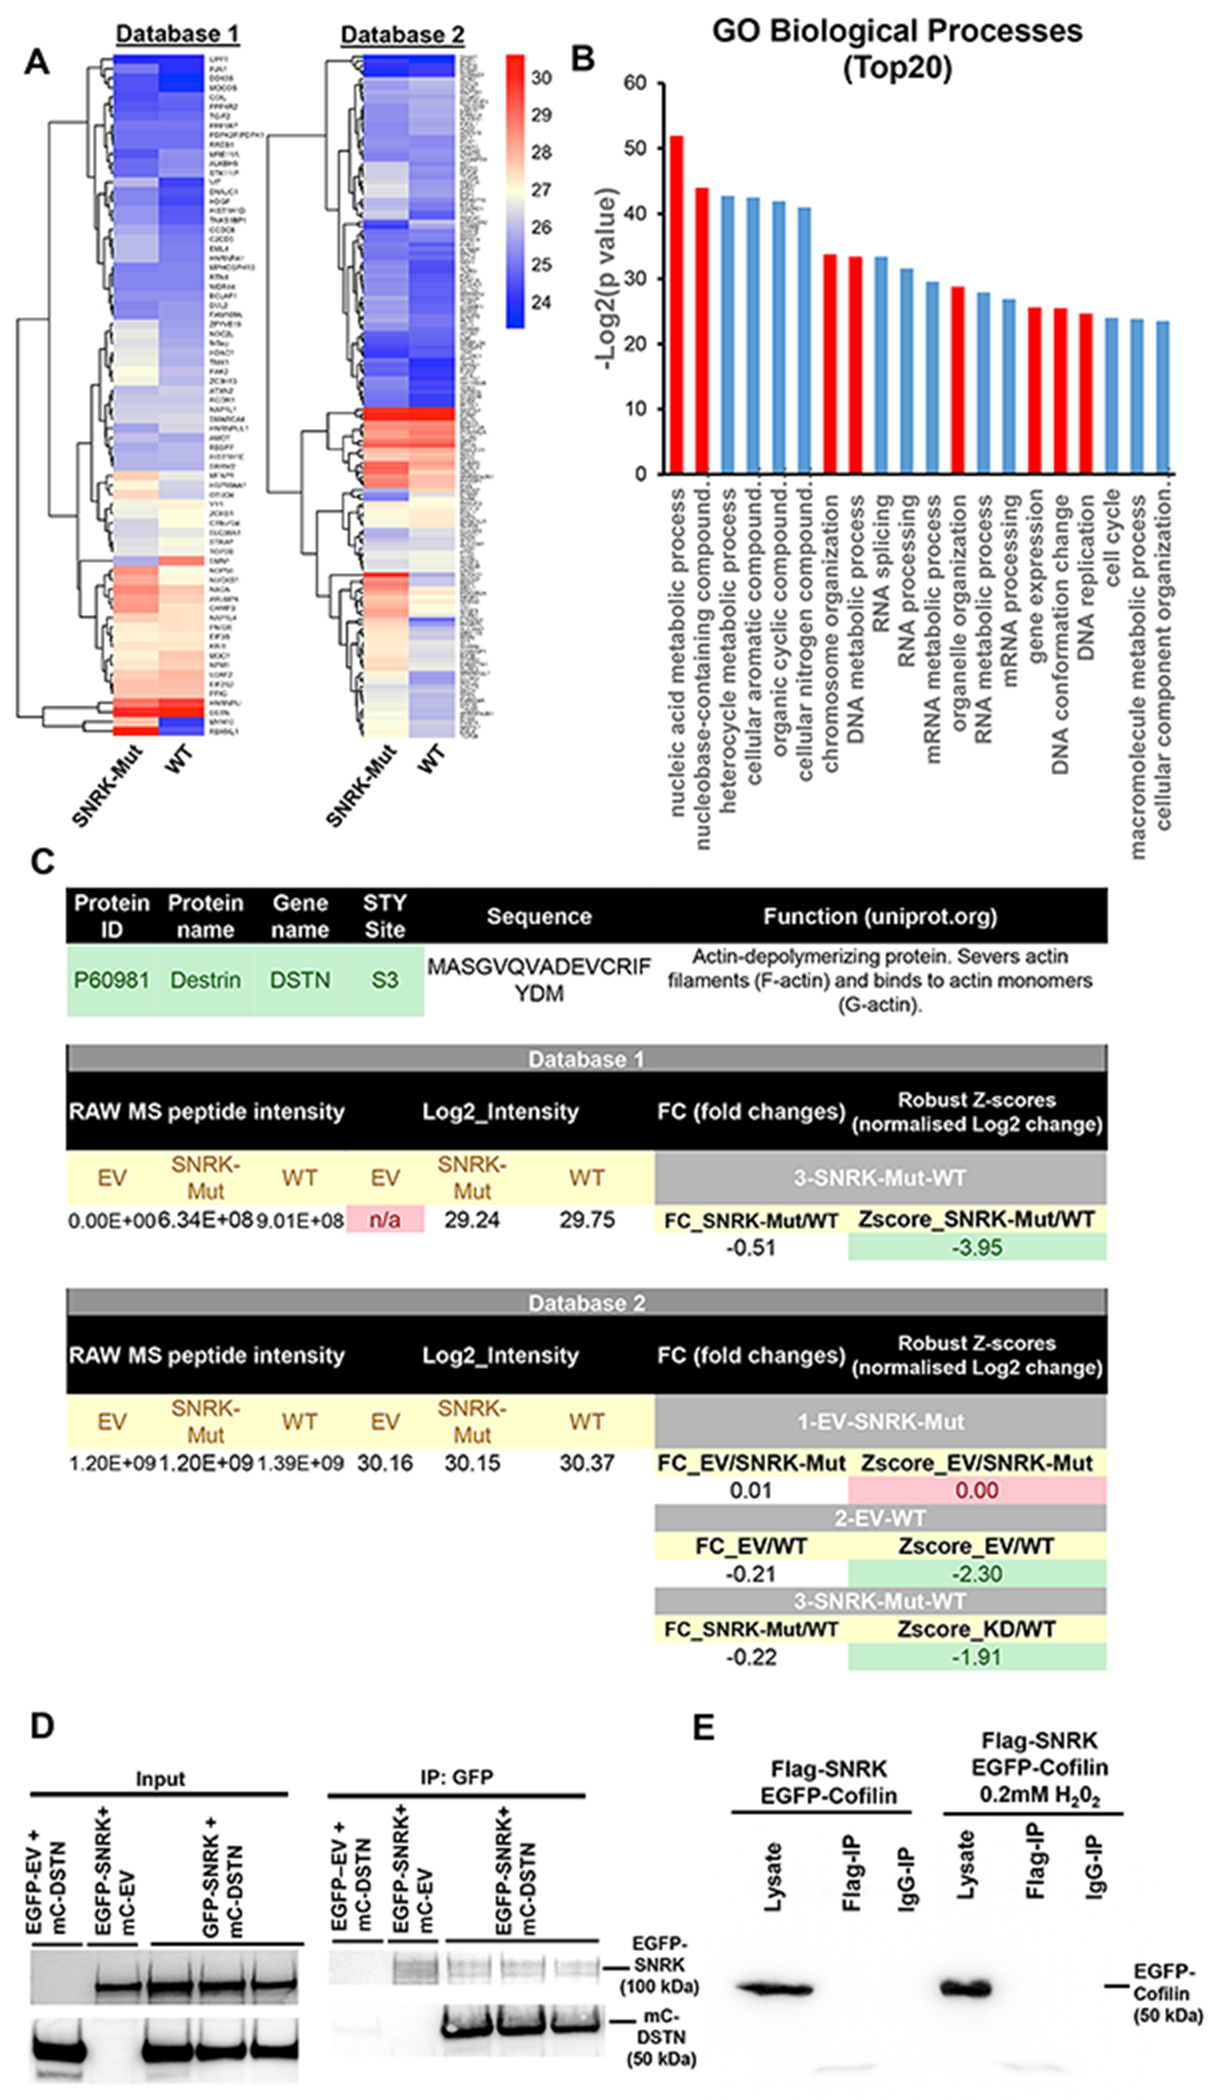
Methods: We subjected cardiac-specific Snrk-/- mice to transaortic banding to assess the effect on cardiac function and DDR. In parallel, we modulated SNRK in vitro and assessed its effects on DDR and nuclear parameters. We also used phosphoproteomics to identify novel proteins that are phosphorylated by SNRK. Last, coimmunoprecipitation was used to verify Destrin (DSTN) as the binding partner of SNRK that modulates its effects on the nucleus and DDR.

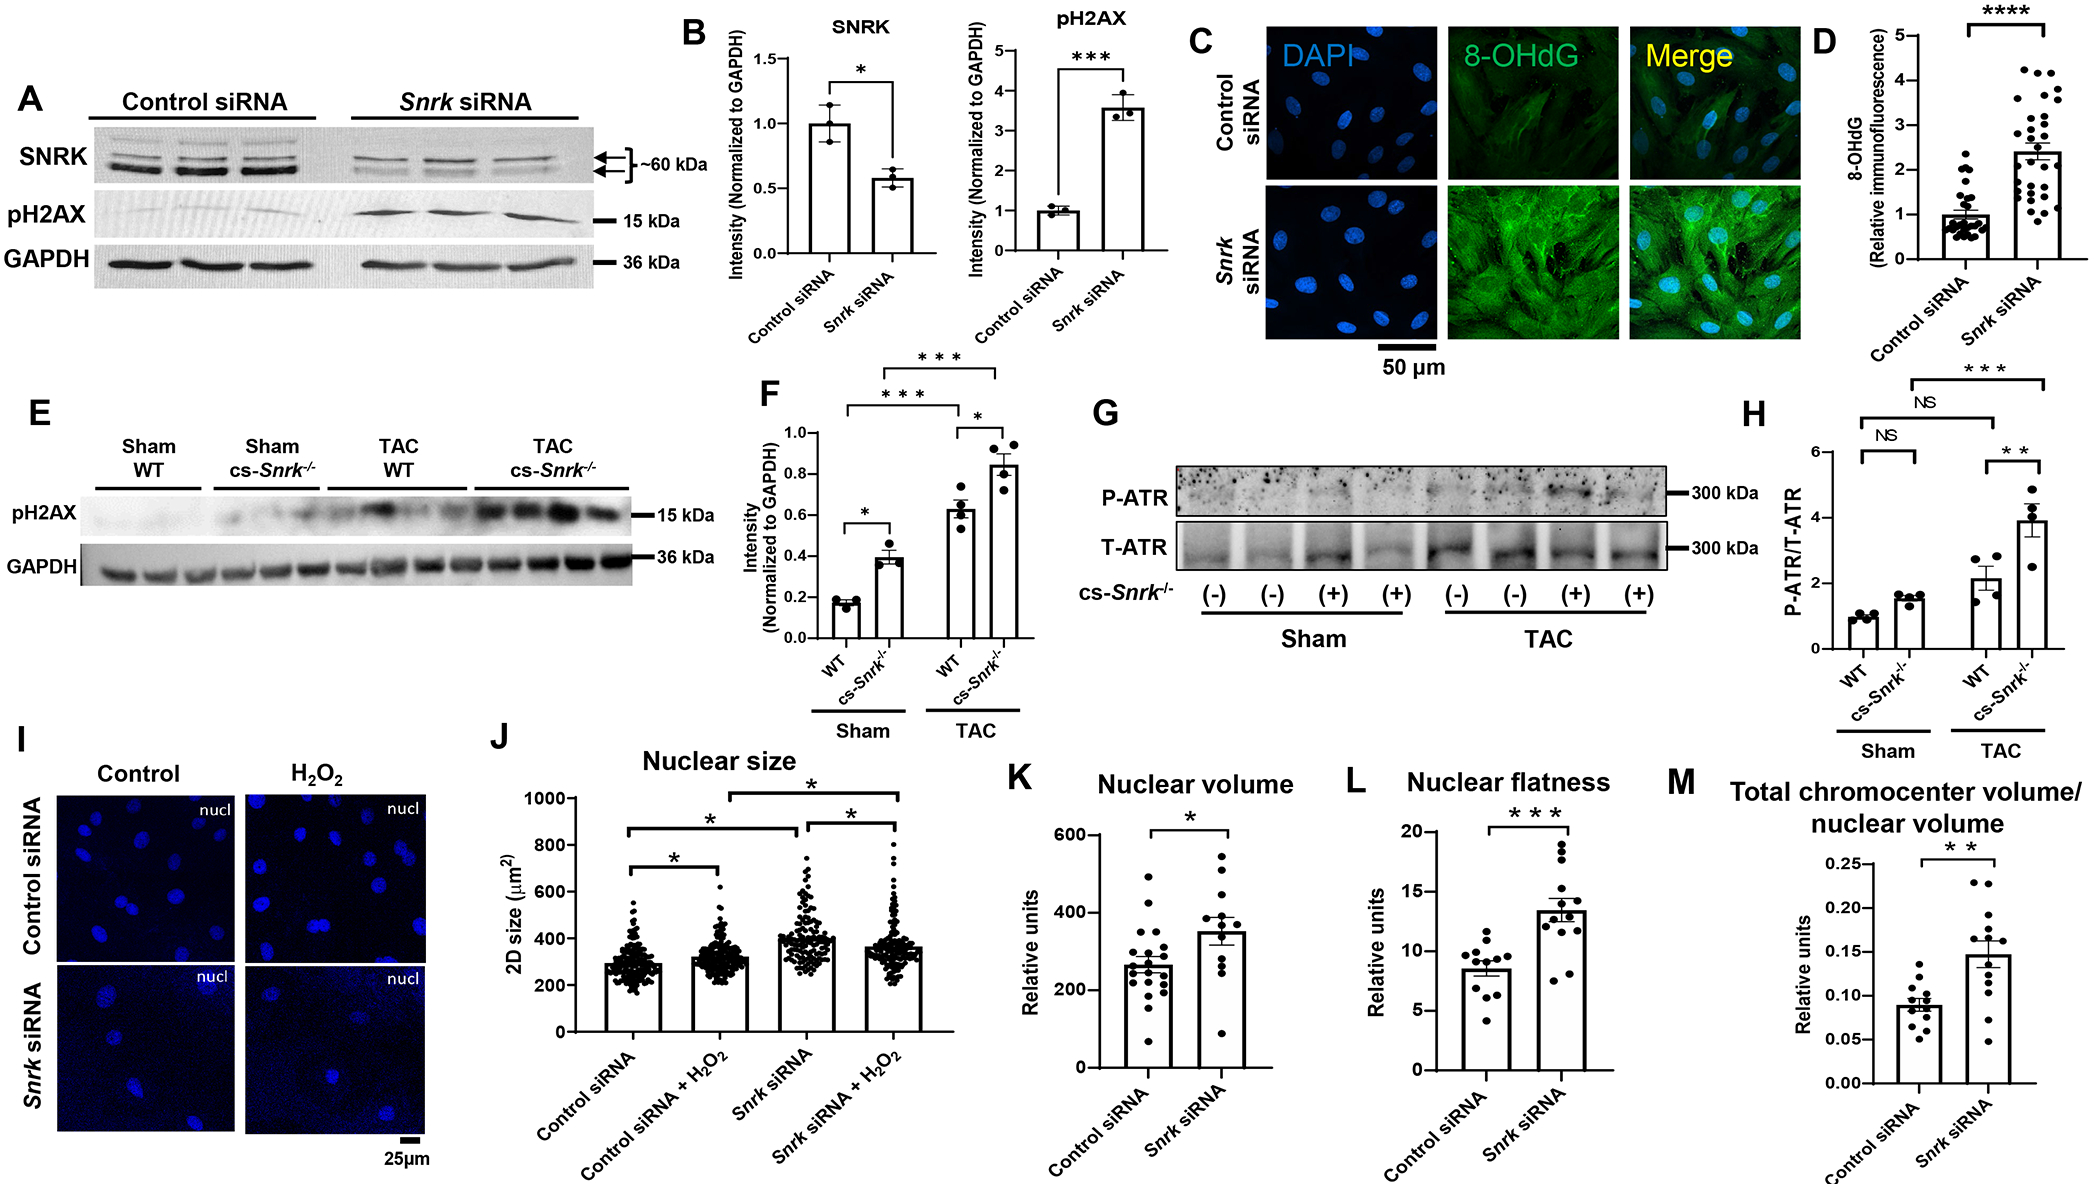
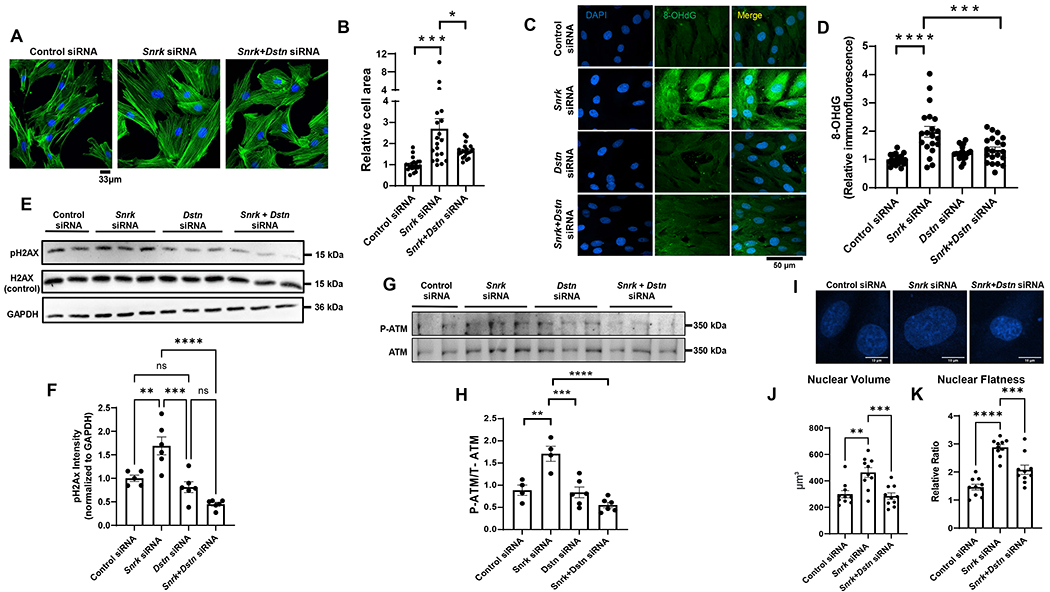
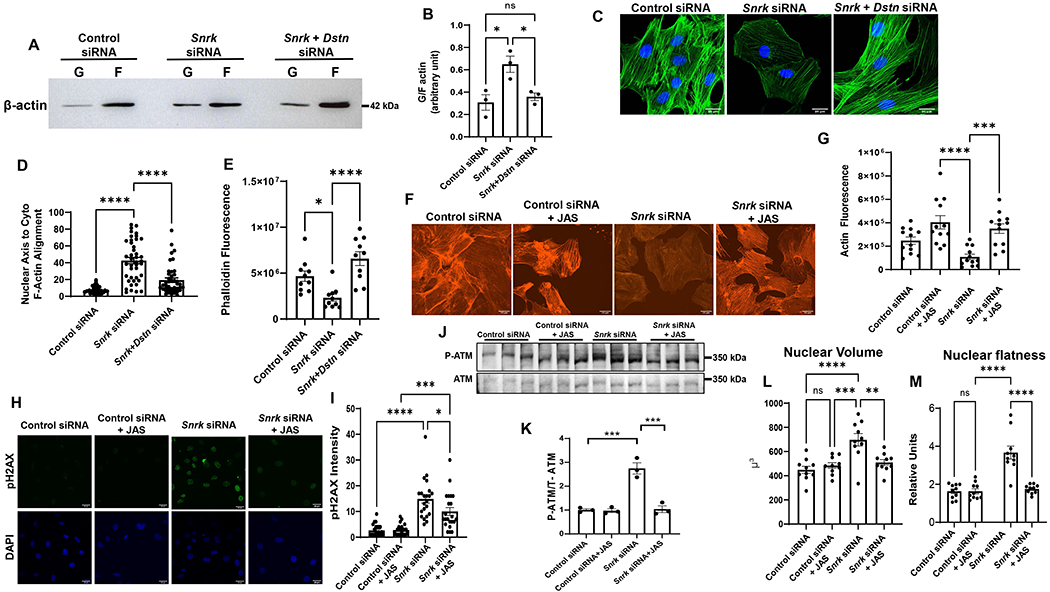
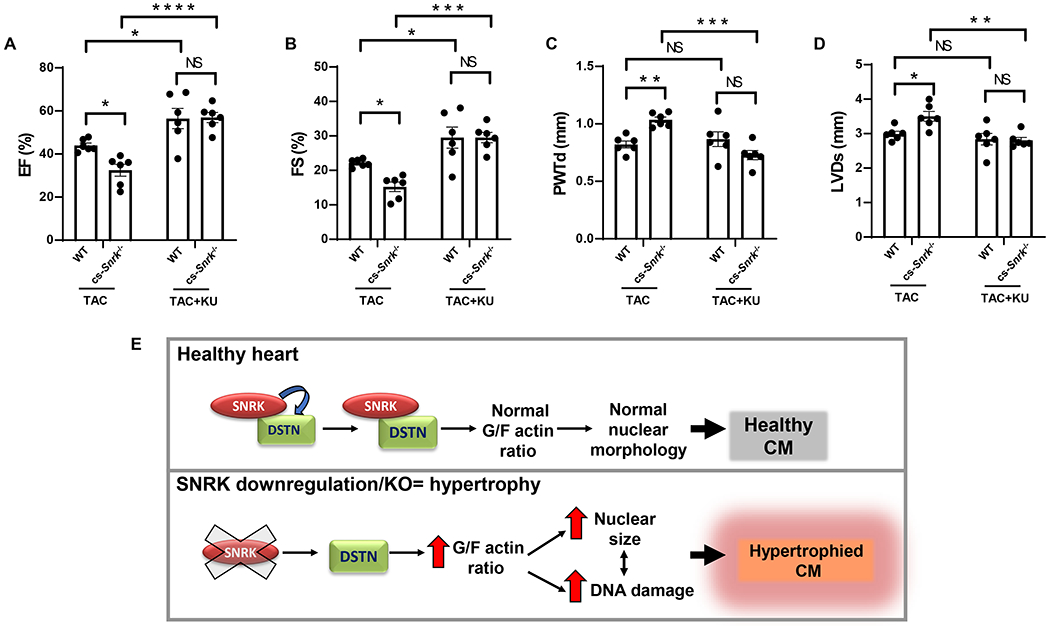
Results: Cardiac-specific Snrk-/- mice display worse cardiac function and cardiac hypertrophy in response to transaortic banding, and an increase in DDR marker pH2AX (phospho-histone 2AX) in their hearts. In addition, in vitro Snrk knockdown results in increased DNA damage and chromatin compaction, along with alterations in nuclear flatness and 3-dimensional volume. Phosphoproteomic studies identified a novel SNRK target, DSTN, a member of F-actin depolymerizing factor proteins that directly bind to and depolymerize F-actin. SNRK binds to DSTN, and DSTN downregulation reverses excess DNA damage and changes in nuclear parameters, in addition to cellular hypertrophy, with SNRK knockdown. We also demonstrate that SNRK knockdown promotes excessive actin depolymerization, measured by the increased ratio of G-actin to F-actin. Last, jasplakinolide, a pharmacological stabilizer of F-actin, rescues the increased DNA damage and aberrant nuclear morphology in SNRK-downregulated cells.

Conclusions: These results indicate that SNRK is a key player in cardiac hypertrophy and DNA damage through its interaction with DSTN. This interaction fine-tunes actin polymerization to reduce DDR and maintain proper cardiomyocyte nuclear shape and morphology.

Keywords: AMP-activated protein kinases; Destrin; actins; hypertrophy, left ventricular; myocytes, cardiac.


Conflict of interest statement

Disclosures Dr Ardehali serves as a consultant for Pharmacosmos and as an expert witness (not related to the topic of this article).

Figures

Figure 1.
Figure 1.. SNRK is increased in cardiac hypertrophy and its deletion leads to exaggerated hypertrophy
A, SNRK protein levels in heart tissue from mice subjected to sham or 4-weeks after TAC operation. B, Summary bar graph summary of Panel A (n=3 animals per condition, unpaired t-test, *P<0.05). C, Image of freshly extracted hearts from WT and cs-Snrk−/− mice 4-weeks after sham operation or TAC. Scale bar = 0.1 cm. D, HW/TL in WT and cs-Snrk−/− mice 4-weeks after sham operation or TAC (n>6 animals per condition, two-way ANOVA with Tukey’s test, *P<0.05). E-F, IVSd (E) and PWTd (F) in WT and cs-Snrk−/− mice 4-weeks after sham operation or TAC (n=6-10, two-way ANOVA with Tukey’s multiple comparisons test). G-H, EF (G) and FS (H) in WT and cs-Snrk−/− mice 3-weeks after sham operation or TAC (n=3-11, two-way ANOVA with Sidak’s multiple comparisons test, *P<0.05, **P<0.01, ***P<0.001, ****P<0.0001.
Figure 2.
Figure 2.. SNRK modulates DDR and nuclear morphology.
A, Western blot of SNRK and pH2AX in H9c2 cells treated with control or Snrk siRNA. B, Summary bar graph of Panel A (n=3, Student’s t-test). C, Representative IF images of 8-OHdG stain of H9c2 cells treated with control or Snrk siRNA. Scale bar = 50 μm. D, Results of the 8-OHdG fluorescence from Panel C (n≥30 cells measured for each condition, Student’s t-test). E, Western blot of pH2AX in the hearts of WT and cs-Snrk−/− mice treated with sham or after TAC. F, Summary bar graph of the results in Panel E (n=3-4, two-way ANOVA with Tukey’s test). G, Western blot of p-ATR and total ATR in H9c2 cells treated with control or Snrk siRNA. H, Summary bar graph of Panel G (n=4, two-way ANOVA with Tukey’s test). I, Representative IF images of DAPI stain of H9c2 cells treated with control or Snrk siRNA. Scale bar = 25 μM. J, Results of the nucleus size measurements from Panel I (n=3 independent experiments, with ≥42 cells measured for each condition per replicate, Student’s t-test). K-M, Nuclear volume (K), nuclear flatness (L), and total chromocenter volume/nuclear volume (M) measurements in H9c2 cells treated with control or Snrk siRNA. Nuclear flatness reflects the ratio of the length of the intermediate axis of the cell to length of the shortest axis. (n ≥12 cells measured for each condition, Student’s t-test). *P<0.05, **P<0.01, ***P<0.001, ****P<0.0001.
Figure 3.
Figure 3.. SNRK interacts with DSTN.
A, Heatmap summary of all identified peptides and their corresponding log2 intensity values from the phosphoproteomic study, with the values above 1.5 and below 1.5 z-scores (normalized Log2 fold changes) for Mutant vs WT for both databases 1 and 2. B, Summary of Gene ontology (GO) analysis of top 20 pathways of all upregulated and downregulated genes identified as upregulated in WT vs Mutant and WT vs EV from both databases , performed using http://www.pantherdb.org/. Red bars represent [rocesses related to cell cycle, and organelle and chromosome organization. C, Summary of DSTN S3 raw phosphoproteomic data and corresponding log2 intensity and Z-score fold changes from both databases. D, Co-IP studies of overexpressed constructs with EGFP fusion to SNRK and DSTN fused to m-Cherry probed with GFP and mCherry antibodies. The co-IP studies demonstrated that DSTN binds to SNRK. E, Co-IP studies of overexpressed constructs with FLAG fusion with SNRK and cofilin-1 fused to GFP (probed with GFP antibody). IP experiments were done with FLAG antibody.
Figure 4.
Figure 4.. DSTN KD reverses the DDR and changes in nuclear morphology induced by SNRK KD.
A, Representative IF images of H9c2 cells treated with control or Snrk siRNA alone, or combination of Snrk and Dstn siRNA and stained with Phalloidin-iFluor 488 to assess cell surface area. B, Summary of results in Panel A (n=20 cells for each condition, one-way ANOVA with Tukey’s test). C, Representative IF images of 8-OHdG stain of H9c2 cells treated with control, Snrk, Dstn, or Snrk+Dstn siRNA. Scale bar = 50 μM. D, Results of the 8-OHdG fluorescence from Panel C (n=20 cells measured for each condition, two-way ANOVA with Tukey’s test). E, Western blot of SNRK, DSTN, pH2AX, and H2AX in H9c2 cells treated with control siRNA, Snrk siRNA, Dstn siRNA, or Snrk+Dstn siRNA. F, Summary of results in Panel E (n=3, one-way ANOVA with Tukey’s test). G, Western blot of p-ATM and total ATM in H9c2 cells treated with control, Snrk, Dstn, or Snrk+Dstn siRNA. H, Summary bar graph of Panel G (n=4-6, two-way ANOVA with Tukey’s test). I, Representative IF images of H9c2 cells treated with DAPI staining and with control, Snrk, or Snrk+Dstn siRNA. Scale bar = 10 μm. J-K, Nuclear volume (J) and nuclear flatness (K) in H9c2 cells treated with control, Snrk, or Snrk+Dstn siRNA. Nuclear flatness reflects the ratio of the length of the intermediate axis of the cell to length of the shortest axis. (n=10, one-way ANOVA with Tukey’s multiple comparisons test). *P<0.05, **P<0.01, ***P<0.001, ****P<0.0001.
Figure 5.
Figure 5.. SNRK alters DDR and nuclear morphology through actin depolymerization.
A, Representative Western blot of F and G actin in H9c2 cells treated with control, Snrk or Snrk+Dstn siRNA. B, Summary bar graph of Western blot results in A (n=3, one-way ANOVA with Tukey’s test). C, Representative IF images probing with actin staining in H9c2 cells treated with control, Snrk or Snrk+Dstn siRNA. Scale bar = 20 μm. D, Summary bar graph of nuclear-actin angle in H9c2 cells treated with control, Snrk or Snrk+Dstn siRNA (n=42, one-way ANOVA with Tukey’s Multiple Comparisons Test). E, Phalloidin fluorescence in H9c2 cells treated with control, Snrk or Snrk+Dstn siRNA (n=10, one-way ANOVA with Tukey’s test). F, Representative fluorescence actin images of H9c2 cells treated with Snrk siRNA in the presence and absence of JAS. Scale bar = 20 μm. G, Summary bar graph of actin fluorescence of H9c2 cells with Snrk siRNA and JAS (n=12, one-way ANOVA with Tukey’s Multiple Comparisons Test). H, Representative pH2AX immunohistochemistry of H9c2 cells treated with Snrk siRNA in the presence and absence of JAS. Scale bar = 25 μm. I, Summary bar graph of pH2AX staining of H9c2 cells with Snrk siRNA and JAS (n=22, one-way ANOVA with Tukey’s Multiple Comparisons Test). J, Western blot of p-ATM and total ATM in H9c2 cells treated with control or Snrk siRNA in the presence and absence of JAS. K, Summary bar graph of Panel G (n=3, two-way ANOVA with Tukey’s test). L-M, Nuclear volume (L) and nuclear flatness (M) in H9c2 cells treated with Snrk siRNA in the presence and absence of JAS. Nuclear flatness reflects the ratio of the length of the intermediate axis of the cell to length of the shortest axis. (n=10, one-way ANOVA with Tukey’s test). *P<0.05, **P<0.01, ***P<0.001, ****P<0.0001.
Figure 6.
Figure 6.. Inhibition of DDR signaling inhibits pressure overload–induced cardiomyocyte hypertrophy in cs-Snrk−/−.
A-D, EF (A), FS (B), PWTd (C), and LVDs (D) in WT and cs-Snrk−/− mice 4-weeks after sham operation or TAC with or without KU-60019 (n=6, two-way ANOVA with Holm-Sidak’s multiple comparisons test). *P<0.05, **P<0.01, ***P<0.001, ****P<0.0001. E, Schematic model for the SNRK-DSTN interaction in relation to SNRK KO hypertrophy. SNRK regulates nuclear morphology and DDR through DSTN mediated actin depolymerization, and that deletion of Snrk leads to cardiac hypertrophy through perturbation of G/F actin ratio.

Update of

References

    1. Hill JA, and Olson EN. Cardiac plasticity. N Engl J Med. 2008;358(13):1370–80. - PubMed
    1. Nakada Y, Nhi Nguyen NU, Xiao F, Savla JJ, Lam NT, Abdisalaam S, et al. DNA Damage Response Mediates Pressure Overload-Induced Cardiomyocyte Hypertrophy. Circulation. 2019;139(9):1237–9. - PMC - PubMed
    1. Young M, McNulty P, and Taegtmeyer H. Adaptation and maladaptation of the heart in diabetes: Part II: potential mechanisms. Circulation. 2002;105(15):1861–70. - PubMed
    1. Reznick RM, and Shulman GI. The role of AMP-activated protein kinase in mitochondrial biogenesis. J Physiol. 2006;574(Pt 1):33–9. - PMC - PubMed
    1. Becker W, Heukelbach J, Kentrup H, and Joost HG. Molecular cloning and characterization of a novel mammalian protein kinase harboring a homology domain that defines a subfamily of serine/threonine kinases. Eur J Biochem. 1996;235(3):736–43. - PubMed

Publication types