. 2023 Sep 18:12:e85756.
doi: 10.7554/eLife.85756.

Neural circuit mechanisms for transforming learned olfactory valences into wind-oriented movement

Affiliations

Neural circuit mechanisms for transforming learned olfactory valences into wind-oriented movement

Yoshinori Aso et al. Elife. .

Abstract

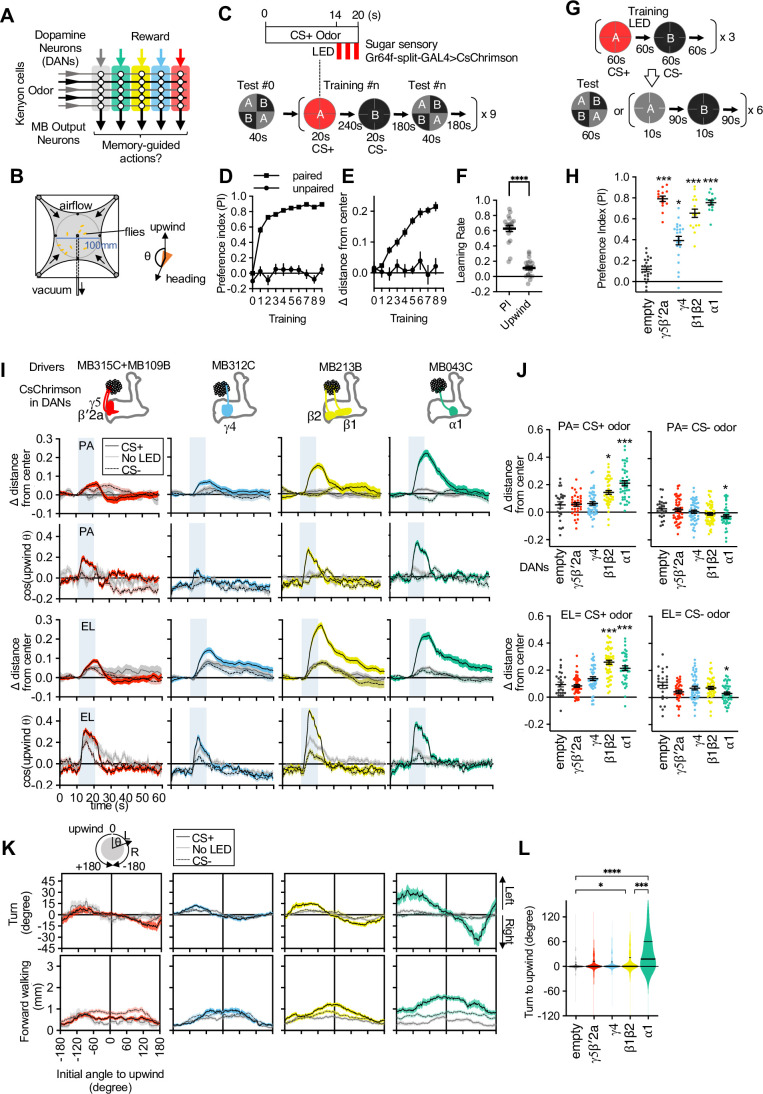
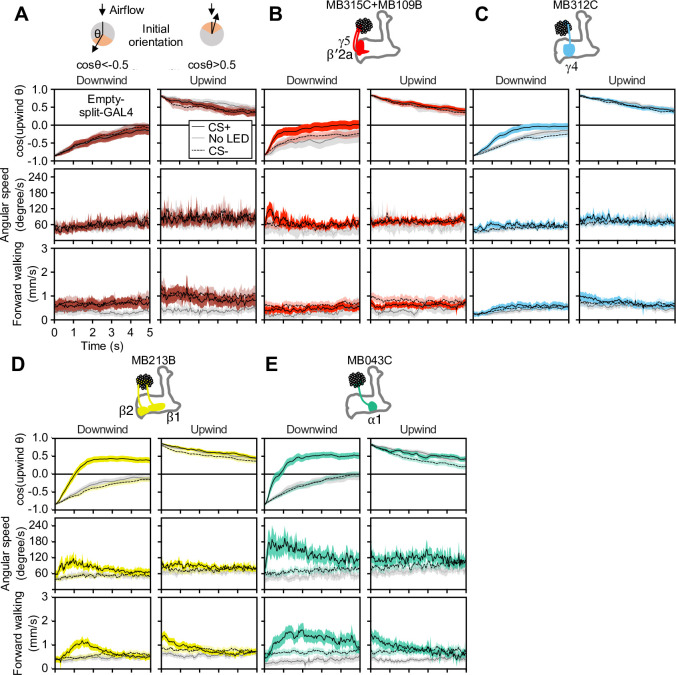
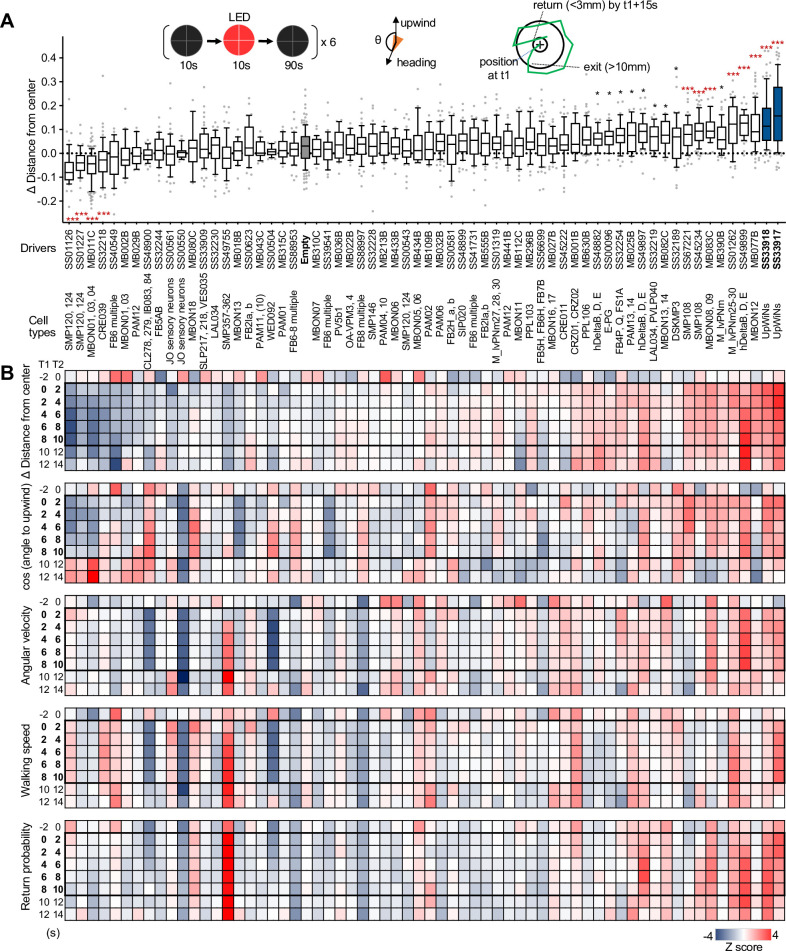
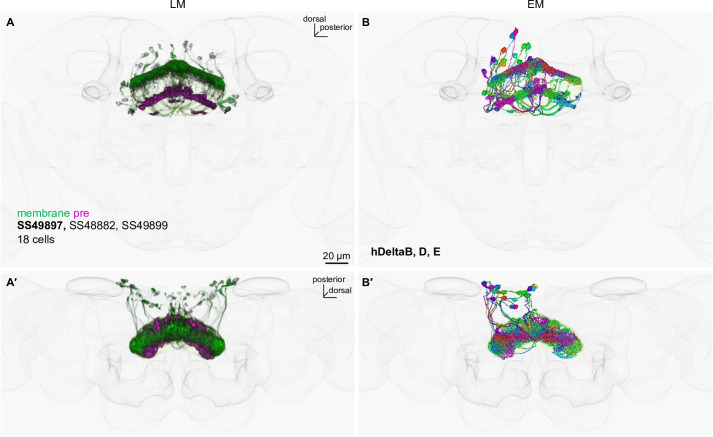
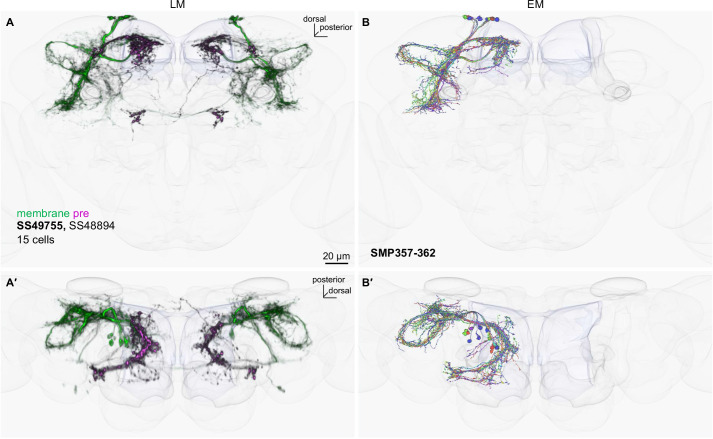
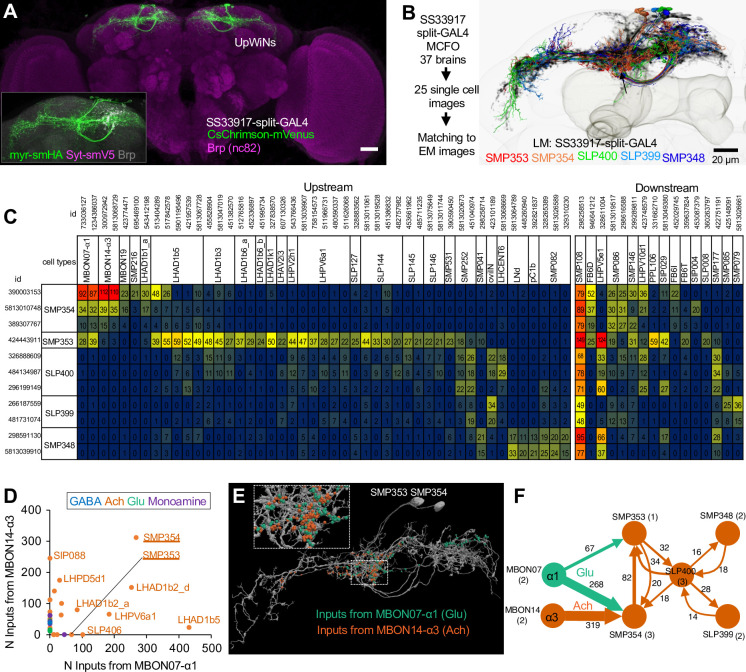
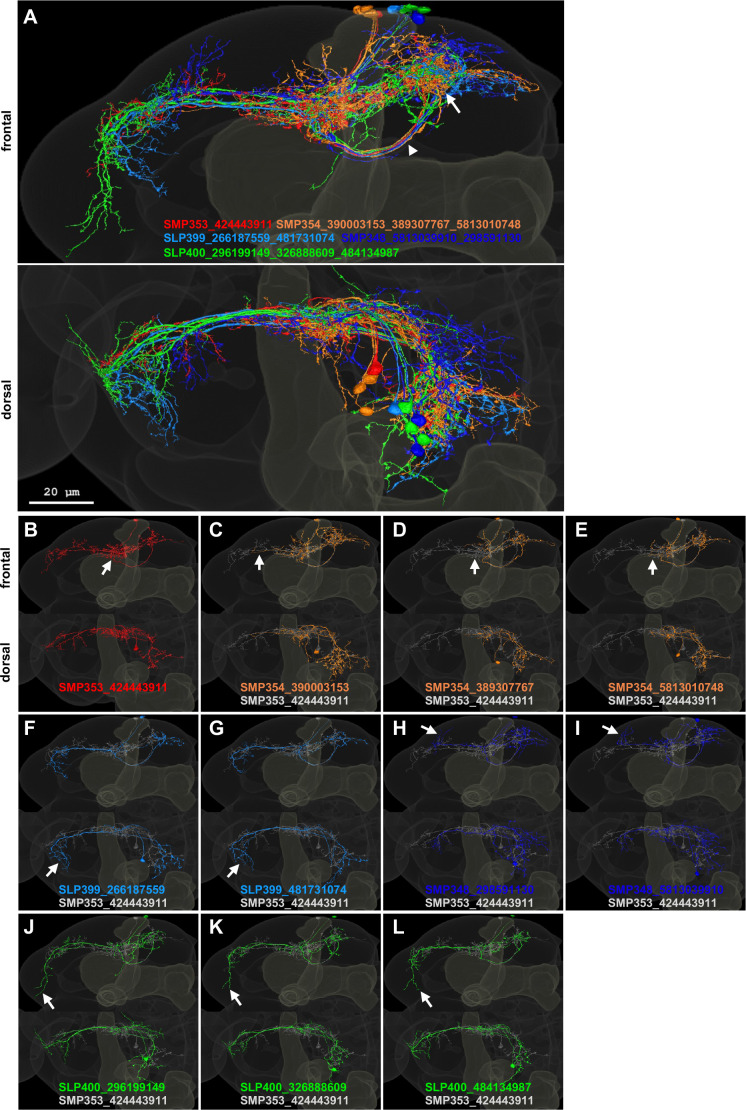
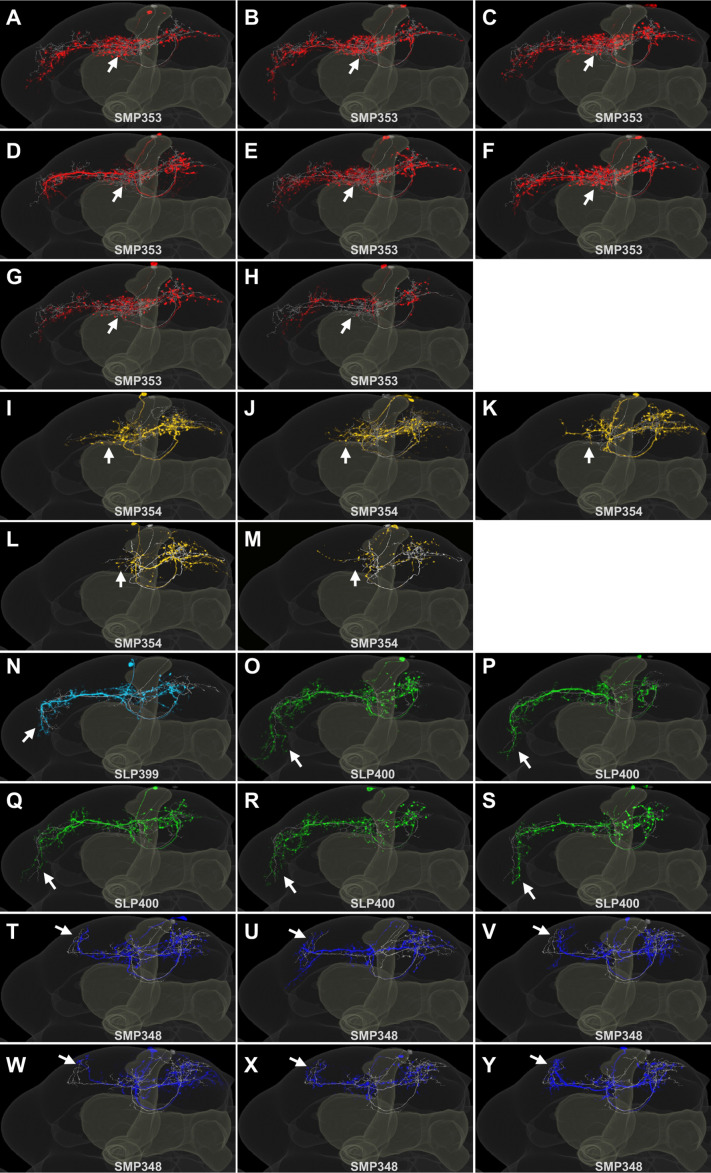
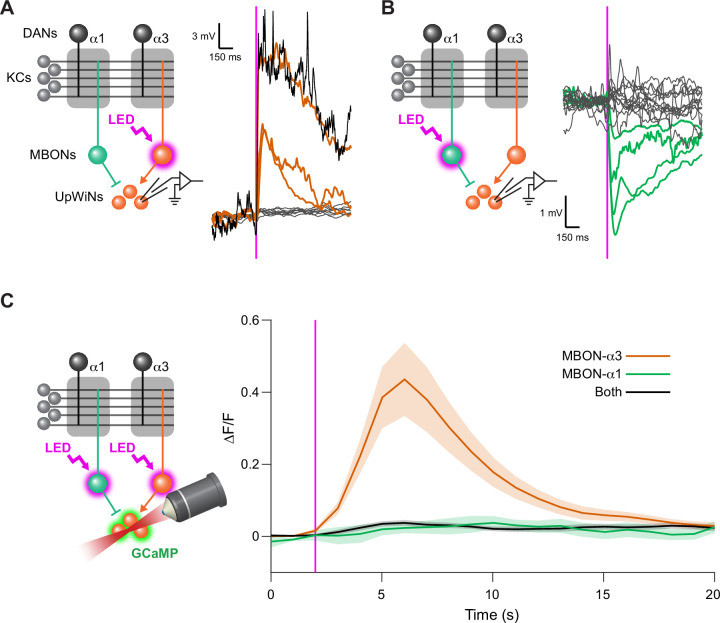
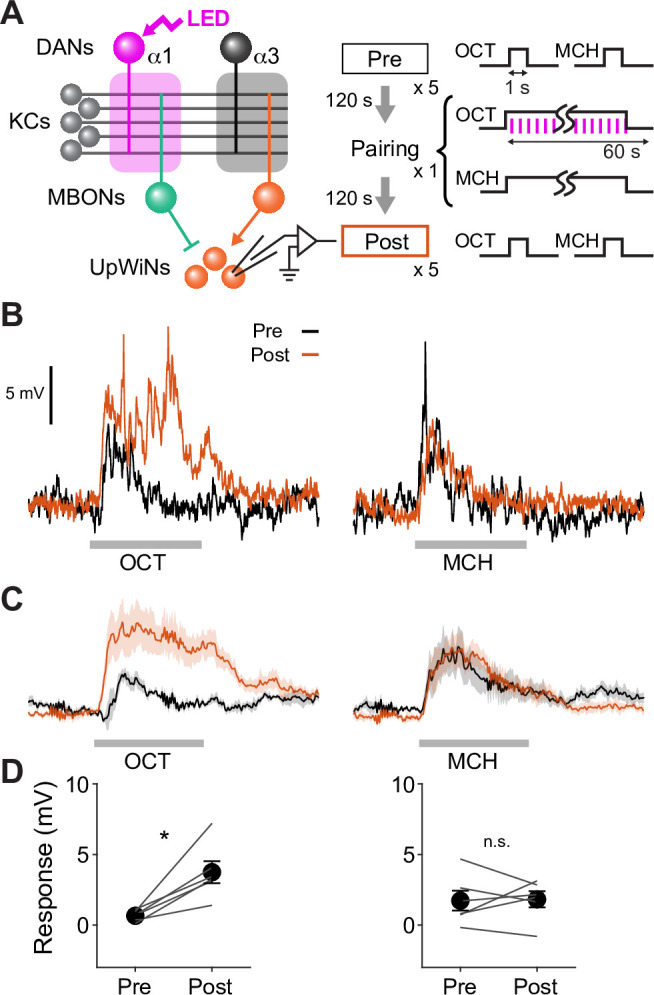
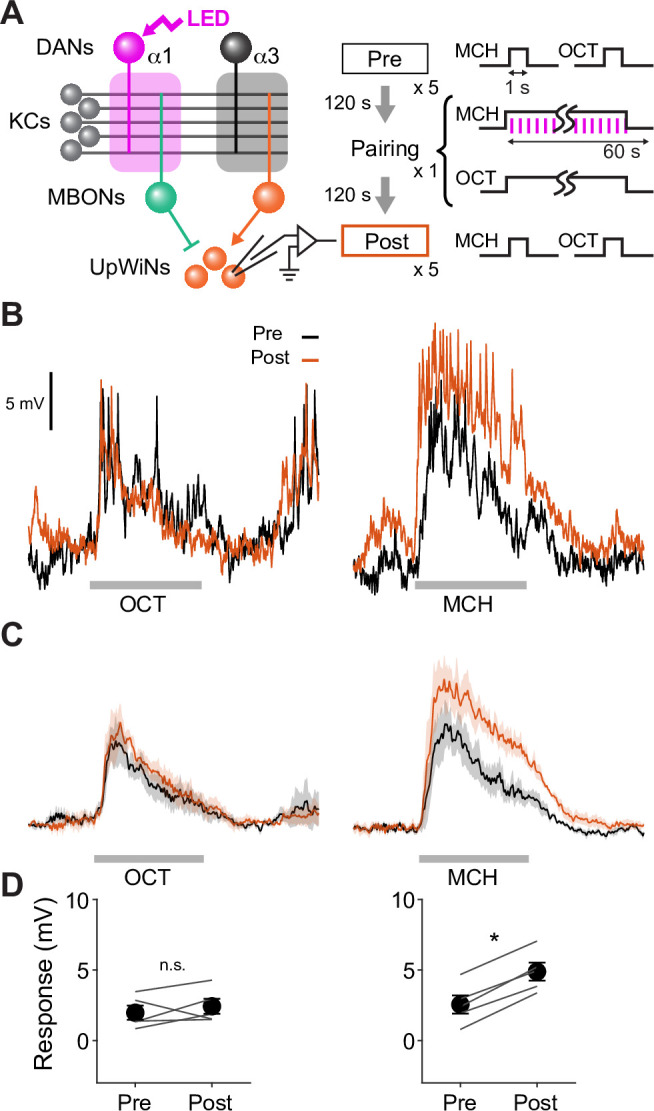
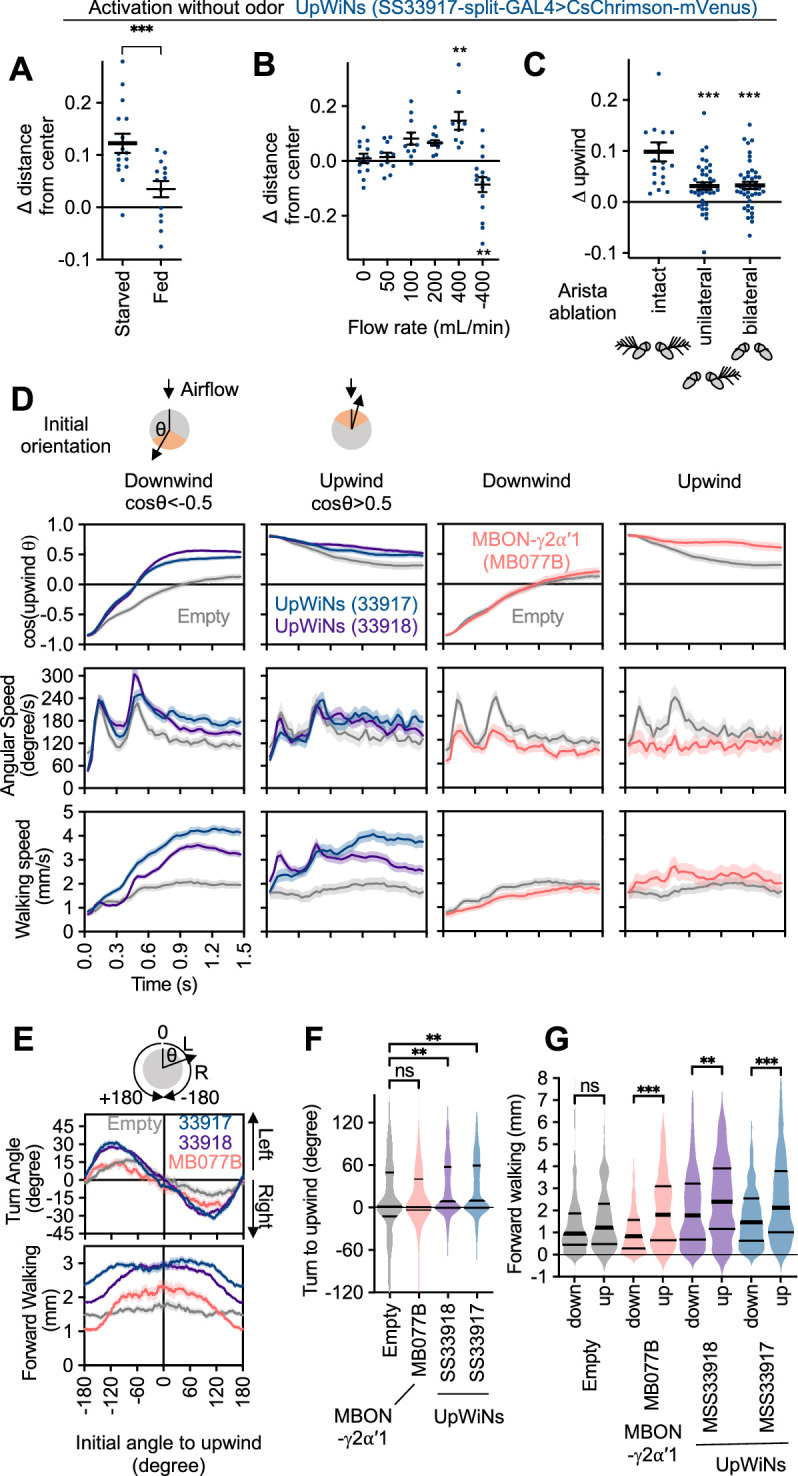
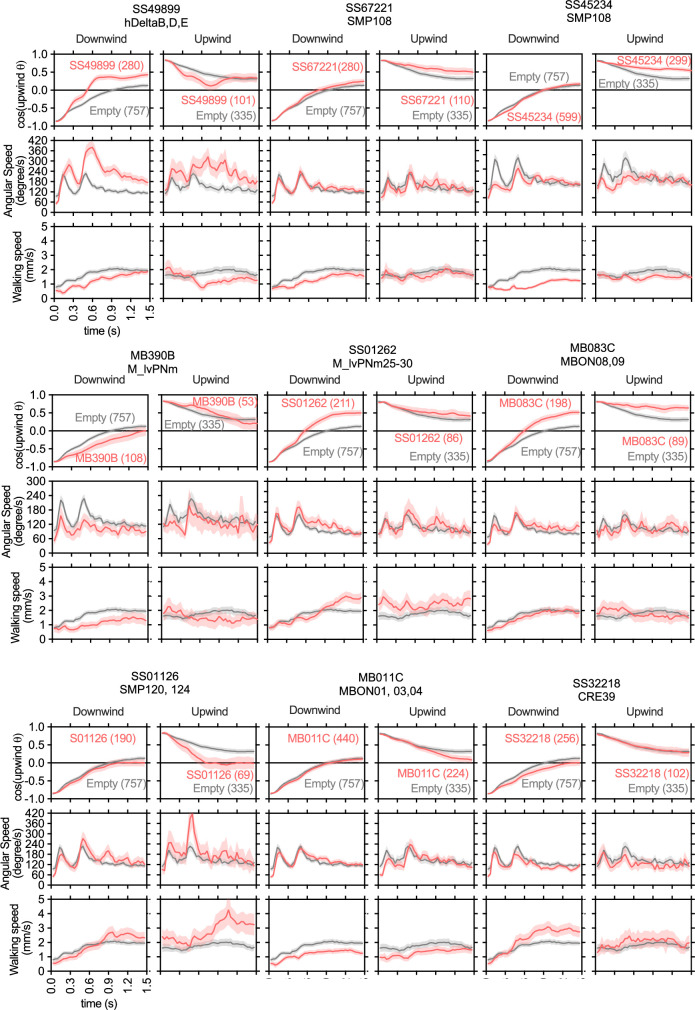
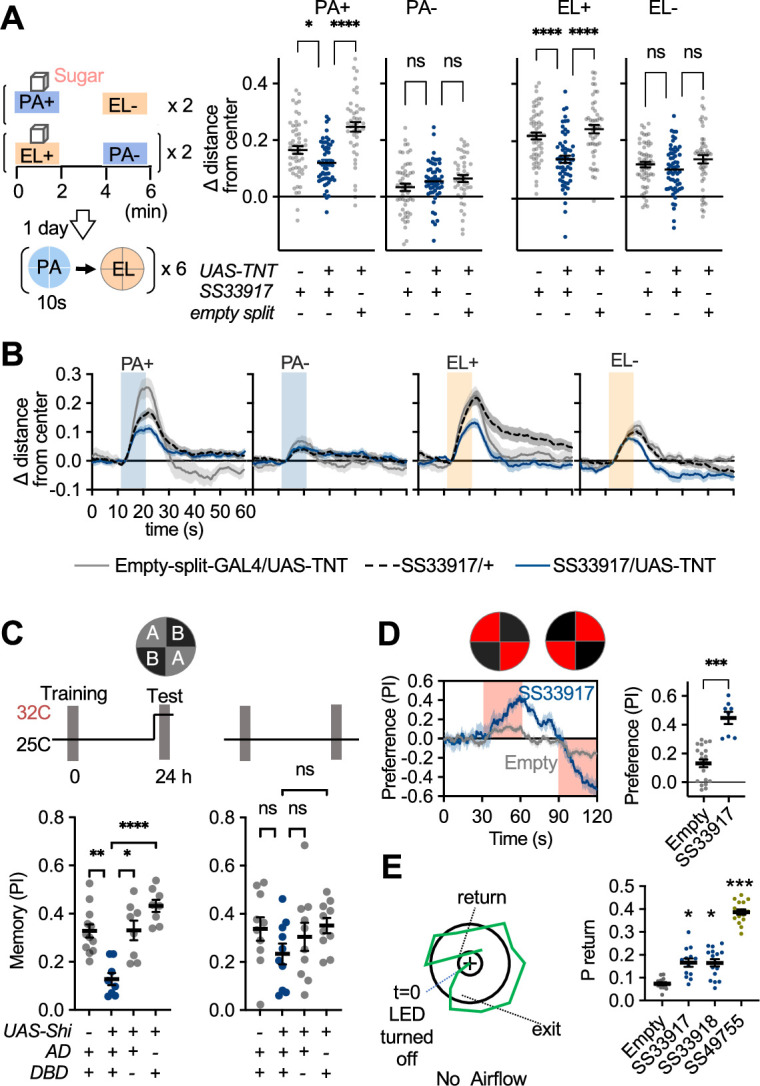
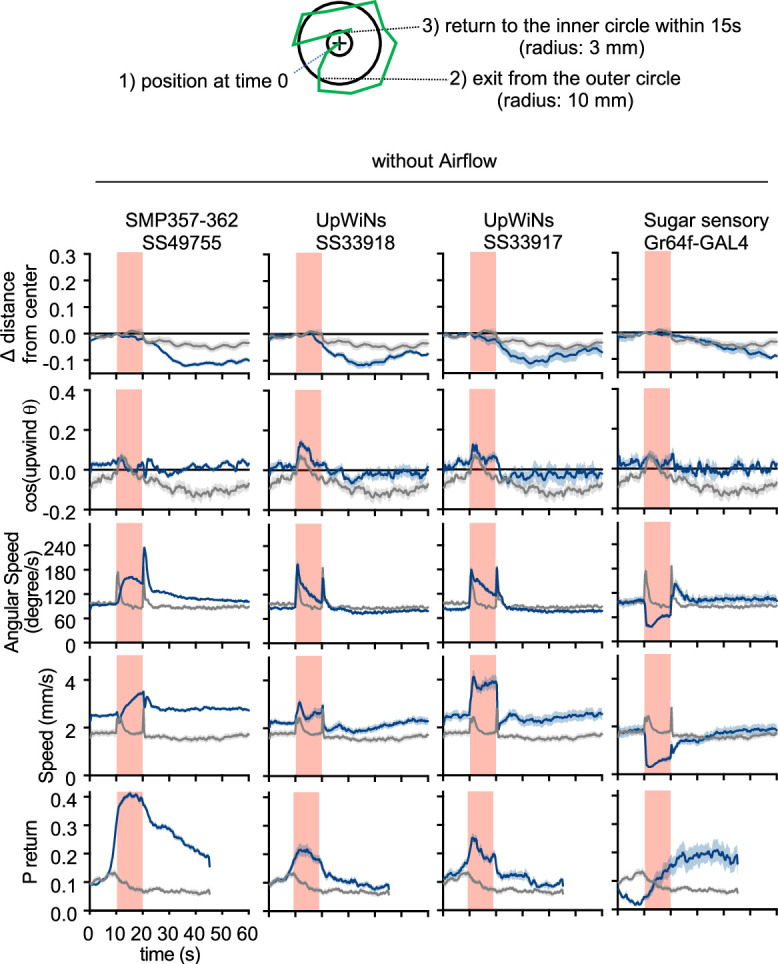
How memories are used by the brain to guide future action is poorly understood. In olfactory associative learning in Drosophila, multiple compartments of the mushroom body act in parallel to assign a valence to a stimulus. Here, we show that appetitive memories stored in different compartments induce different levels of upwind locomotion. Using a photoactivation screen of a new collection of split-GAL4 drivers and EM connectomics, we identified a cluster of neurons postsynaptic to the mushroom body output neurons (MBONs) that can trigger robust upwind steering. These UpWind Neurons (UpWiNs) integrate inhibitory and excitatory synaptic inputs from MBONs of appetitive and aversive memory compartments, respectively. After formation of appetitive memory, UpWiNs acquire enhanced response to reward-predicting odors as the response of the inhibitory presynaptic MBON undergoes depression. Blocking UpWiNs impaired appetitive memory and reduced upwind locomotion during retrieval. Photoactivation of UpWiNs also increased the chance of returning to a location where activation was terminated, suggesting an additional role in olfactory navigation. Thus, our results provide insight into how learned abstract valences are gradually transformed into concrete memory-driven actions through divergent and convergent networks, a neuronal architecture that is commonly found in the vertebrate and invertebrate brains.

Keywords: D. melanogaster; associative learning; dopamine; memory; mushroom body; neural circuit; neuroscience; olfactory navigation.


Conflict of interest statement

YA, DY, DB, KH, MS, HO, YS, TH No competing interests declared

Figures

Figure 1.
Figure 1.. Memories in specific set of mushroom body (MB) compartments drive upwind locomotion.
(A) A conceptual diagram of the MB circuit. The colored rectangles represent individual MB compartments. (B) A diagram of a four-armed olfactory arena. In each experiment, approximately 20 female flies were introduced into the circular arena. (C) Protocols for optogenetic training and tests used. One of two odors (pentyl acetate [PA] and ethyl lactate [EL]) was presented for 20 s, and three 1 s pulses of 627 nm light were started at 14 s. Another odor was presented alone, and then preference between two odors was measured. The cycles of training and tests were repeated nine times. In the unpaired protocol, LED was started 90 s before the onset of ‘CS+’ odor. (D) Preference to the CS+ odor in binary choice. (E) Displacement of flies’ position relative to the center of the arena during the initial 14 s of 20 s odor period as wind-directional response. (F) Learning rate defined as response after single training divided by peak response after 9× training. (G) Protocols for optogenetic training and the two different memory tests used in this work. (H) Appetitive memories assessed by binary choice between CS+ and CS− odors immediately after training with optogenetic activation of dopaminergic neurons (DANs) that express CsChrimson with drivers indicated in (I). Empty is a split-GAL4 driver without promoters for AD and DBD domains. Thick and thin horizontal lines represent means and SEMs. Dunn’s multiple comparison tests compared to empty-split-GAL4 control, following Kruskal-Wallis test; n=12–22. (I) Time course of the area-normalized mean of fly’s position relative to the center of the arena as compared with its mean position at odor onset and the cosine of the angle between the fly’s orientation and the upwind direction (see Materials and methods). Flies of each genotype were trained with three protocols: (1) pentyl acetate (PA) was paired with the LED illumination and ethyl lactate (EL) was unpaired. (2) EL was paired with LED and PA was unpaired. (3) Neither odor was paired (No LED). Lines and filled areas around lines are mean and SEM. N=24–60. (J) The delta of distance from the center at the end of the 10 s odor period. Each dot represents data from individual trials. Black lines are mean and SEM. *, p<0.05; ***, p<0.001; Dunn’s multiple comparison tests compared to empty-split-GAL4 control, following Kruskal-Wallis test; n=24–60. The upwind displacements of MB213B and MB043C in response to CS+ odor were also significantly higher than the control when trial averages of six movies were compared. (K) Cumulative angle of turning and forward walking speed during the first 10 frames (333 ms; a time window we used for optogenetic experiments in Figure 6) following odor onset are plotted against initial angle to upwind, smoothened with ±30 degree bin. The number of trajectories analyzed for (CS+, CS−, No LED) conditions for MB109B+MB315C, MB312C, MB213B, and MB043C were (531, 562, 167), (710, 758, 814), (920, 1039, 919), and (449, 768, 531), respectively. Only flies that were 3 mm or more from the edge of the arena were analyzed. (L) The violin-plots of the cumulative angle of turn to the upwind orientation during the first 10 frames (333 ms) of odor onset. Only flies that oriented –90 to –150 or +90–150 degrees to the upwind direction at odor onset were analyzed. n=122, 137, 233, 239, 99 for empty-split-GAL4, MB109B+MB315C, MB312C, MB213B, and MB043C, respectively. *, p<0.05; ***, p<0.001; Dunn’s multiple comparison tests compared to empty-split-GAL4 control, following Kruskal-Wallis test.
Figure 1—figure supplement 1.
Figure 1—figure supplement 1.. Memory-based modulation of walking speed and angular speed depends on the fly’s initial angle to the upwind direction.
(A–E) The cosine of the angle to upwind direction, angular speed, and forward walking speed are separately plotted for flies oriented downwind or upwind at odor onset (time = 0 s). Only flies that were at least 3 mm away from the edge of the arena were analyzed. The source data are identical to Figure 1E–H.
Figure 2.
Figure 2.. Identification of UpWind Neurons (UpWiNs) by activation screening.
(A) Mean displacement of fly’s position relative to the center of the arena during activation of various cell types defined by the indicated driver lines. Red asterisks indicate the results of Dunn’s multiple comparison tests compared to empty-split-GAL4 control, following Kruskal-Wallis test;*, p<0.05; **, p<0.01; ***, p<0.001, n=18–132. Black asterisks indicate p<0.05 without correction for multiple comparisons. The median, first and third quartiles, 10 and 90 percentiles are displayed with outlier data points. Each of six movies from a group of flies was considered as a single data point. The conclusions about the UpWiNs lines (i.e. SS33917 and SS33918) did not change when trial averages of six movies were used for statistical tests. See Figure 2—figure supplement 2 and http://www.janelia.org/split-gal4 for expression patterns of CsChrimson in these driver lines. (B) Z-scores for five parameters for 2 s time bins (T1 to T2) before, during (bold numbers), and after the 10 s activation period. Z-scores for driver line were calculated by (value – mean)/(standard deviation). For calculating the probability of return, 15-s-long trajectories of each fly following each time point (t1) were analyzed. A fly was considered to revisit the original location at time0 if it moved away more than 10 mm and came back to within 3 mm distance from that location at time0 within 15 s. ‘time0’ ranges 0–45 s, because the movies were 60 s long. High Z-score at 8–10 s time bin indicate that flies tended to move back to their location at 8–10 s by 23–25 s (i.e. mostly dark period after LED was turned off).
Figure 2—figure supplement 1.
Figure 2—figure supplement 1.. Activation phenotypes of ‘hit’ lines.
Time courses of five behavioral parameters are shown for driver lines with significant upwind locomotion (i.e. delta distance from center) phenotypes in Figure 2. Lines and shaded areas around lines are mean and SEM for trial averages; split-GAL4>CsChrimson-mVenus are shown in blue and empty-split-Gal4>CsChrimson-mVenus in gray.
Figure 2—figure supplement 2.
Figure 2—figure supplement 2.. Expression patterns of ‘hit’ lines.
Projection of confocal microscopy stacks for expression patterns of CsChrimson-mVenus driven by designated split-GAL4 driver lines in brains and ventral nerve cords. Confocal stacks are available at https://splitgal4.janelia.org/.
Figure 2—figure supplement 3.
Figure 2—figure supplement 3.. LM-EM matching of cell types in SS49899.
(A) The fan-shaped body neurons in SS49899 driver that were visualized with myr-smGFP-HA (green) and synaptotagmin-smGFP-V5 (magenta). The outlines of the standard brain and the mushroom body are shown in gray. Other driver lines with similar expression patterns are listed. Confocal stacks are available at https://splitgal4.janelia.org. (B) The corresponding EM reconstructed neurons, which were matched by comparing projection patterns in the standard brain and referring MCFO images of split-GAL4. (A′) and (B′) are projections from dorsal side of the brains.
Figure 2—figure supplement 4.
Figure 2—figure supplement 4.. LM-EM matching of cell types in SS49755.
(A) The SMP neurons in SS49755 driver that were visualized with myr-smGFP-HA (green) and synaptotagmin-smGFP-V5 (magenta). The outlines of the standard brain and the mushroom body are shown in gray. Other driver lines with similar expression patterns are listed. (B) The corresponding EM reconstructed neurons, which were matched by comparing projection patterns in the standard brain and referring MCFO images of split-GAL4. Confocal stacks are available at https://splitgal4.janelia.org. (A′) and (B′) are projections from dorsal side of the brains.
Figure 3.
Figure 3.. Connectivity of UpWind Neurons (UpWiNs).
(A) The expression pattern of CsChrimson-mVenus driven by split-GAL4 line SS33917. The scale bar is 20um. The insert image shows signals of membrane reporter myr-smHA and presynaptic reporter Syt-smV5 driven by the same driver. (B) Eleven EM-reconstructed neurons that correspond to UpWiNs defined by the SS33917 driver were identified by analyzing the morphology of individual neurons (Figure 3—figure supplements 1 and 2) and are displayed with outline of the MB and the standard brain. Individual neurons are color-coded to indicate the cell type to which they were assigned. (C) Connectivity of UpWiNs with major upstream and downstream neurons that have at least 20 connections with 1 of the 11 UpWiNs. The hemibrain body IDs of each neuron is shown as well as their assignment to specific cell types. Numbers indicate the number of synapses from the upstream neurons to UpWin neurons (left) or from the UpWiNs to the downstream neurons (right). (D) Interneurons downstream to mushroom body output neuron (MBON)-α1 and MBON-α3. Colors of dots indicate neurotransmitter prediction (Eckstein et al., 2020). See Figure 3—figure supplement 3 for more details. (E) Predicted postsynaptic sites in SMP353 and SMP354 (gray), which are juxtaposed to presynaptic sites from MBON-α1 (green) and MBON-α3 (orange). The insert (10 μm width) shows a magnified view of juxstaposed synapses. (F) Interconnectivity between UpWiNs. The numbers indicate the summed number of connections. The numbers in parentheses indicate the number of neurons per cell type.
Figure 3—figure supplement 1.
Figure 3—figure supplement 1.. Candidate UpWind Neurons (UpWiNs) in hemibrain EM images.
(A) Frontal and dorsal projection of 11 EM-reconstructed neurons that were matched with confocal images of UpWiNs within the standard brain (Bogovic et al., 2020) (see Figure 3—figure supplement 2). Pseudo colors were assigned to each of five cell types. The arrowhead and arrow indicate common axonal tract and terminal area in the SMP. IDs of each neuron are displayed. The somas of these neurons are clustered near the tip of the vertical lobe of the MB, and they share the tracts for the primary neurite and axons, whereas the branching patterns of their dendrites exhibit cell-type-specific characteristics, which were used for cell-type matching. (B–L) Projections of individual neurons. The arrows indicate dendritic branches that are characteristic to each cell type.
Figure 3—figure supplement 2.
Figure 3—figure supplement 2.. Single cell images of neurons in SS33917.
(A–Y) Frontal projections of segmented multi-color flip-out images of SS33917 (colored) with corresponding EM neuron (gray). The arrows indicate dendritic branches that are characteristic to each cell type.
Figure 3—figure supplement 3.
Figure 3—figure supplement 3.. NBLAST clustering of single cell images of neurons in SS33917.
Multi-color flip-out (MCFO) single cell images of SS33917 driver were clustered into six groups, which were nearly identical to the manual annotation.
Figure 3—figure supplement 4.
Figure 3—figure supplement 4.. Downstream neurons of mushroom body output neuron (MBON)-α1 and MBON-α3.
Connectivity from MBON-α1 and MBON-α3 to downstream neurons that receive at least 10 connections.
Figure 4.
Figure 4.. UpWind Neurons (UpWiNs) integrate excitatory and inhibitory synaptic inputs from mushroom body output neurons (MBONs).
(A) Functional connectivity between MBON-α3 and UpWiNs. Chrimson88-tdTomato was expressed in MBON-α3 by MB082C split-GAL4, and the photostimulation responses were measured by whole-cell current-clamp recording in randomly selected UpWiNs labeled by R64A11-LexA. 3 out of 11 neurons (7 flies) showed excitatory response. Mean voltage traces from individual connected (orange) and unconnected UpWiNs (gray) are overlaid. The connection was strong enough to elicit spikes (black; single-trial response in one of the connected UpWiNs). Magenta vertical line indicates photostimulation (10 ms). (B) Functional connectivity between MBON-α1 and UpWiNs. Chrimson88-tdTomato expression in MBON-α1 was driven by MB310C split-GAL4. 4 out of 17 neurons (12 flies) showed inhibitory response. Mean voltage traces from individual connected (green) and unconnected UpWiNs (gray) are overlaid. (C) Integration of synaptic inputs from MBON-α3 and MBON-α1. Population responses of UpWiNs were measured by two-photon calcium imaging at the junction between dendrites and axonal tracts (mean ∆F/F ± SEM) while photostimulating MBON-α3 (orange; n=5), MBON-α1 (green; n=11) or both (black; n=7). Expression of GCaMP6s was driven by R64A11-LexA, and Chrimson88-tdTomato by G0239-GAL4 (MBON-α3) and/or MB310C (MBON-α1). Photostimulation: 1 s (magenta). While activation of MBON-α1 did not evoke detectable inhibition in the calcium signal, it effectively canceled the excitation by MBON-α3.
Figure 4—figure supplement 1.
Figure 4—figure supplement 1.. Excitatory interconnections between UpWind Neurons (UpWiNs).
(A) Expression of Chrimson-tdTomato (red) and GCaMP6s (green) in UpWiNs. To express them in mutually exclusive subsets of UpWiNs, GCaMP expression was driven by a broad UpWiN driver 64A11-LexA, while Chrimson-tdTomato and LexAp65-DBD2-RNAi were driven in a subset of UpWiNs by SS67249. White box in the left image indicates an example axonal region of interest (ROI), which is zoomed in on the right image. Scale bar, 5 µm. (B) Thresholded images of GCaMP and Chrimson-tdTomato fluorescence. A small number of voxels that showed co-expression of GCaMP and Chrimson, presumably due to incomplete RNAi, were excluded from analysis. (C) Two-photon imaging of GCaMP6s signals (mean ∆F/F ± SEM; n=8). 1 s photostimulation (magenta) evoked calcium responses in both axonal and dendritic ROIs.
Figure 5.
Figure 5.. Optogenetic appetitive conditioning enhances the response to the conditioned odor in UpWind Neurons (UpWiNs).
(A) Optogenetic conditioning was performed by pairing photostimulation of PAM-dopaminergic neurons (DANs) with odor presentation. Expression of ChrimsonR-mVenus was driven by 58E02-LexA, and in vivo whole-cell recordings were made from UpWINs labeled by GFP using SS67249-split-GAL4. 1 min presentation of OCT was paired with LED stimulation (1 ms, 2 Hz, 120 times), followed by 1 min presentation of MCH alone. (B) Representative recording from a single fly. Gray bars indicate 1 s odor presentation. (C) Mean (± SEM) odor responses (n=6). Spikes were removed by a low-pass filter. (D) Summary data of mean (± SEM) odor-evoked membrane depolarization. Gray lines indicate data from individual neurons. Responses to OCT were potentiated (p<0.01; repeated-measures two-way ANOVA followed by Tukey’s post hoc multiple comparisons test), while those to MCH did not change (p=0.9).
Figure 5—figure supplement 1.
Figure 5—figure supplement 1.. Expression patterns of SS67249.
(A) Expression of CsChrimson-mVenus driven by SS67249. (B–D) MCFO image of neurons in SS67249 (red) and SMP353 (gray) with outline of the mushroom body (MB) and the standard brain.
Figure 5—figure supplement 2.
Figure 5—figure supplement 2.. Reciprocal experiment of optogenetic appetitive conditioning.
(A) Experimental design and protocol. Same as Figure 5 except that MCH was paired with dopaminergic neuron (DAN) photostimulation. (B) Representative recording from a single fly. Gray bars indicate 1 s odor presentation. (C) Mean (± SEM) odor responses (n=5). Spikes were removed by a low-pass filter. (D) Summary data of mean (± SEM) odor-evoked membrane depolarization. Gray lines indicate data from individual neurons. Responses to MCH were potentiated (p<0.001; repeated-measures two-way ANOVA followed by Tukey’s post hoc multiple comparisons test), while those to OCT did not change (p=0.4).
Figure 6.
Figure 6.. Activity of UpWind Neurons (UpWiNs) bias turning direction.
(A) Fed or 40–48 hr starved flies were compared to assess requirement of starved status for UpWiNs to promote upwind locomotion. n=14 (fed) and 16 (starved); ***, p<0.001, Mann-Whitney test. (B) Upwind locomotion during the 10 s activation of UpWiNs in the arena with various rates of airflow. n=9–16;**, p<0.01; Dunn’s multiple comparison tests compared to the zero flow condition. (C) Right side or both sides of aristae were ablated 1 day prior to experiments to measure upwind response during UpWiN activation. n=20 (intact) and 40 (unilateral and bilateral); ***, p<0.001; Dunn’s multiple comparison tests compared to the intact control. (D) Behavioral kinematics of UpWiN activation. The trajectories of individual flies during first 1.5 s of 10 s LED period were grouped to initially facing downwind or upwind if cos(upwind angle) was above 0.5 or below –0.5, respectively. (E) Cumulative angle of turning and forward walking speed during the first 10 frames (333 ms) after the onset of LED plotted against initial angle to upwind smoothened with ±30 degree bin. The number of trajectories analyzed for (SS33917, SS33918, MB077B, empty-split-GAL4) were (2492, 3362, 772, 1582), respectively. Only flies that were at least 3 mm away from the edge of the arena were analyzed. (F–G) The violin-plots of the cumulative angle of turn to the upwind orientation or forward walking speed during the first 10 frames (333 ms) of odor onset. Only flies that oriented –90 to –150 or +90–150 degrees to upwind at the odor onset were analyzed. n=444, 540, 231, 219 for SS33917, SS33918, MB077B, empty-split-GAL4, respectively. **, p<0.01; ***, p<0.001; Dunn’s multiple comparison for the selected pairs, following Kruskal-Wallis test. Thick and thin horizontal lines are mean and SEM in (A–C) and median and quartile ranges in (F–G), respectively.
Figure 6—figure supplement 1.
Figure 6—figure supplement 1.. The cosine of angle to upwind, angular speed and forward walking speed are separately plotted for flies oriented downwind or upwind at the odor onset.
Only flies that were 3 mm away from the edge of the arena were analyzed. The source data are identical to Figure 2.
Figure 7.
Figure 7.. UpWind Neurons (UpWiNs) are required for memory-driven upwind locomotion.
(A) Upwind response to the odor associated with sugar in control genotypes and flies that express tetanus toxin (TNT) in UpWiNs. (B) Time course of upwind response. (C) Appetitive memories of control genotypes and flies expressing shibire (Shi) in UpWiNs were tested 1 day after odor-sugar conditioning at restrictive or permissive temperature. (D) Time course of fly’s preference to quadrants with red LED light by SS33917>CsChrimson (blue) or empty-split-GAL4>CsChrimson (gray). The preference to red LED quadrants during the last 5 s of two 30 s activation period was significantly higher for SS33917>CsChrimson flies (right). (E) The probability of returning to the location where LED stimulation was terminated were measured as in Figure 2, but without airflow. See Figure 7—figure supplement 1 for the time courses and other parameters. UpWiN drivers are shown together with SS49755 from the screen.
Figure 7—figure supplement 1.
Figure 7—figure supplement 1.. UpWind Neuron (UpWiN) activation phenotypes without airflow.
Time course of the five parameters shown in Figure 2—figure supplement 1 but in the absence of airflow. Lines and filled areas around lines are mean and SEM; CsChrimson-expressing flies (blue) and empty-split-GAL4 control (gray). The return probability was calculated within a 15 s time window. High return probability during LED ON period (10–20 s) does not necessarily mean that flies returned during LED ON period. If a fly is at the position A when t=10 s, to be counted as ‘returned’, it needs to move more than 10 mm away from A and move back to the position less than 3 mm distance from A by t=25 s. In the case of sugar sensory neuron activation with Gr64f-GAL4, the peak of return probability is shifted toward a later time point because flies stop and extend proboscis during activation period.

Update of

References

    1. Álvarez-Salvado E, Licata AM, Connor EG, McHugh MK, King BM, Stavropoulos N, Victor JD, Crimaldi JP, Nagel KI. Elementary sensory-motor transformations underlying olfactory navigation in walking fruit-flies. eLife. 2018;7:e37815. doi: 10.7554/eLife.37815. - DOI - PMC - PubMed
    1. Aso Y, Herb A, Ogueta M, Siwanowicz I, Templier T, Friedrich AB, Ito K, Scholz H, Tanimoto H, Rulifson E. Three dopamine pathways induce aversive odor memories with different stability. PLOS Genetics. 2012;8:e1002768. doi: 10.1371/journal.pgen.1002768. - DOI - PMC - PubMed
    1. Aso Y, Hattori D, Yu Y, Johnston RM, Iyer NA, Ngo TTB, Dionne H, Abbott LF, Axel R, Tanimoto H, Rubin GM. The neuronal architecture of the mushroom body provides a logic for associative learning. eLife. 2014a;3:e04577. doi: 10.7554/eLife.04577. - DOI - PMC - PubMed
    1. Aso Y, Sitaraman D, Ichinose T, Kaun KR, Vogt K, Belliart-Guérin G, Plaçais PY, Robie AA, Yamagata N, Schnaitmann C, Rowell WJ, Johnston RM, Ngo TTB, Chen N, Korff W, Nitabach MN, Heberlein U, Preat T, Branson KM, Tanimoto H, Rubin GM. Mushroom body output neurons encode valence and guide memory-based action selection in Drosophila. eLife. 2014b;3:e04580. doi: 10.7554/eLife.04580. - DOI - PMC - PubMed
    1. Aso Y, Rubin GM. Dopaminergic neurons write and update memories with cell-type-specific rules. eLife. 2016;5:e16135. doi: 10.7554/eLife.16135. - DOI - PMC - PubMed

Publication types

LinkOut - more resources