. 2023 Nov 1;133(21):e170706.
doi: 10.1172/JCI170706.

GLUT3 promotes macrophage signaling and function via RAS-mediated endocytosis in atopic dermatitis and wound healing

Affiliations

GLUT3 promotes macrophage signaling and function via RAS-mediated endocytosis in atopic dermatitis and wound healing

Dong-Min Yu et al. J Clin Invest. .

Abstract

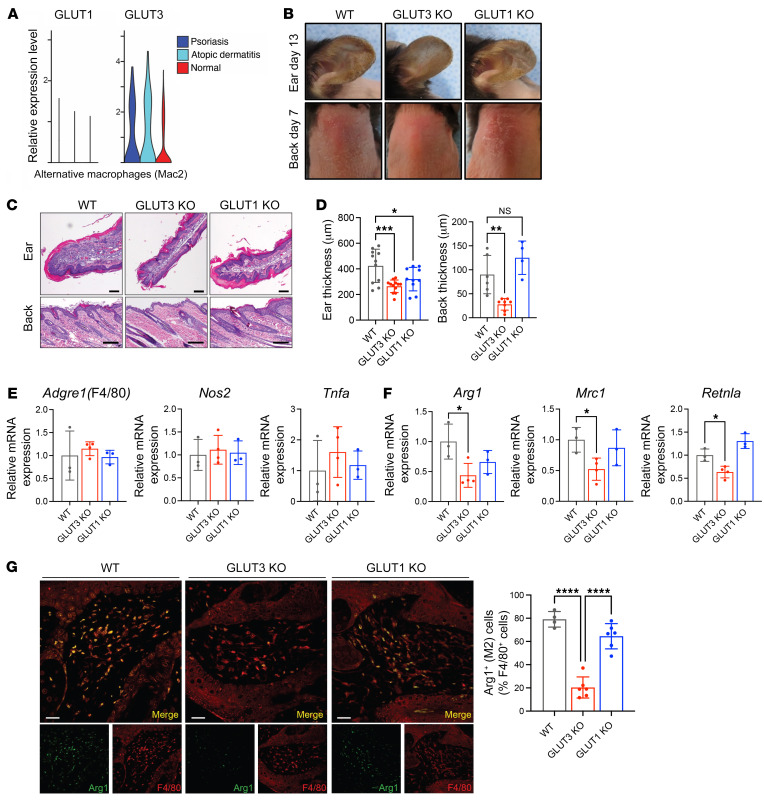
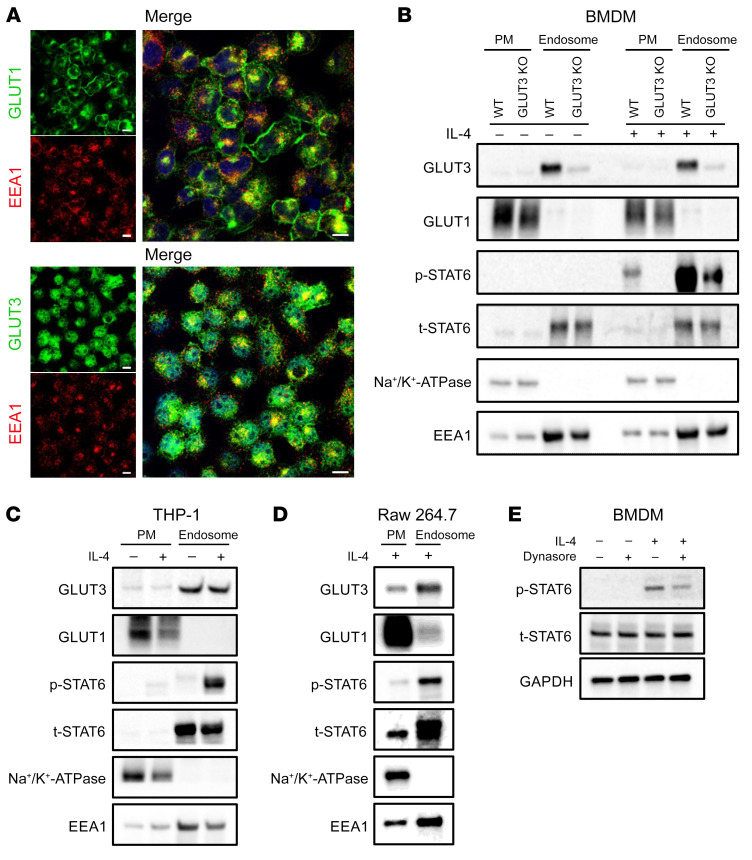
The facilitative GLUT1 and GLUT3 hexose transporters are expressed abundantly in macrophages, but whether they have distinct functions remains unclear. We confirmed that GLUT1 expression increased after M1 polarization stimuli and found that GLUT3 expression increased after M2 stimulation in macrophages. Conditional deletion of Glut3 (LysM-Cre Glut3fl/fl) impaired M2 polarization of bone marrow-derived macrophages. Alternatively activated macrophages from the skin of patients with atopic dermatitis showed increased GLUT3 expression, and a calcipotriol-induced model of atopic dermatitis was rescued in LysM-Cre Glut3fl/fl mice. M2-like macrophages expressed GLUT3 in human wound tissues as assessed by transcriptomics and costaining, and GLUT3 expression was significantly decreased in nonhealing, compared with healing, diabetic foot ulcers. In an excisional wound healing model, LysM-Cre Glut3fl/fl mice showed significantly impaired M2 macrophage polarization and delayed wound healing. GLUT3 promoted IL-4/STAT6 signaling, independently of its glucose transport activity. Unlike plasma membrane-localized GLUT1, GLUT3 was localized primarily to endosomes and was required for the efficient endocytosis of IL-4Rα subunits. GLUT3 interacted directly with GTP-bound RAS in vitro and in vivo through its intracytoplasmic loop domain, and this interaction was required for efficient STAT6 activation and M2 polarization. PAK activation and macropinocytosis were also impaired without GLUT3, suggesting broader roles for GLUT3 in the regulation of endocytosis. Thus, GLUT3 is required for efficient alternative macrophage polarization and function, through a glucose transport-independent, RAS-mediated role in the regulation of endocytosis and IL-4/STAT6 activation.

Keywords: Dermatology; Glucose metabolism; Immunology; Macrophages; Skin.


Figures

Figure 1
Figure 1. Expression of GLUT3 is increased by M2 stimulus, and GLUT3 deficiency impairs M2 polarization of macrophages.
(A and B) mRNA expression levels of GLUT and SGLT transporter isoforms in BMDMs (A) and THP-1 cells (B) cells in unstimulated macrophages (green) and after treatment with classic M1 (purple) or alternative M2 (yellow) polarization stimuli for 24 hours. Expression normalized to that of β-actin (ACTB) (n = 3 biological replicates). (C and D) Western blot assessing expression of GLUT1 and GLUT3 with the indicated polarization stimuli in BMDMs (C) and THP-1 (D). iNOS and p-STAT1, M1 polarization markers; Arg1 and MRC1, M2 polarization markers; Hsp90, loading control. (E) GLUT1 (Slc2a1) and GLUT3 (Slc2a3) expression in primary human CD14+ peripheral blood monocyte–derived macrophages after treatment with indicated polarization stimuli. (F) mRNA expression levels of M1 (Nos2, Tnfa, and Il1b) and M2 (Arg1, Retnla, and Chil3l3) markers in WT (n = 12) and LysM-Cre Glut1fl/fl (GLUT1 KO) (n = 12) BMDMs after the indicated polarization stimuli (n = 4 biological replicates). (G) mRNA expression levels of M1 and M2 markers in WT (n = 12) and LysM-Cre Glut3fl/fl (GLUT3 KO) (n = 12) BMDMs after the indicated polarization stimuli (n = 4 biological replicates). (H) 2-Deoxy-D-glucose uptake in WT, LysM-Cre Glut1fl/fl, and LysM-Cre Glut3fl/fl BMDMs after the indicated polarization stimuli. Fold change represents uptake relative to uptake in unstimulated BMDMs from the same mouse. Data shown as mean ± SEM (n = 2 biological replicates). (I) Pyruvate and ATP levels in WT, LysM-Cre Glut1fl/fl, and LysM-Cre Glut3fl/fl BMDMs after the indicated polarization stimuli. P values were calculated by 2-way ANOVA with Dunnett’s test (A and B), 1-way ANOVA with Dunnett’s test (E and I), or 2-tailed t test (H). *P ≤ 0.05; **P ≤ 0.01; ***P ≤ 0.001; ****P ≤ 0.0001.
Figure 2
Figure 2. Myeloid LysM-Cre Glut3fl/fl (GLUT3 KO) rescues a mouse model of calcipotriol-induced inflammation.
(A) Violin plots showing relative expression of GLUT1 and GLUT3 in alternative macrophages (Mac2) from single-cell RNA-seq profiles of CD45+ cells from patients with psoriasis vulgaris (n = 8), atopic dermatitis (n = 7), or healthy controls (n = 7). (B) Representative photos after calcipotriol administration in WT, LysM-Cre Glut3fl/fl (GLUT3 KO), and LysM-Cre Glut1fl/fl (GLUT1 KO) mice on day 8. (C) Hematoxylin and eosin–stained sections of mouse skin treated with calcipotriol analyzed on day 13 in WT, LysM-Cre Glut3fl/fl, and LysM-Cre Glut1fl/fl mice. Scale bars: 100 μm. (D) Thickness of calcipotriol-treated ear and back in WT (n = 11 for ear and n = 6 for back), LysM-Cre Glut3fl/fl (n = 12 for ear and n = 8 for back), and LysM-Cre Glut1fl/fl (n = 10 for ear and n = 4 for back) mice. (E and F) mRNA expression levels in calcipotriol-treated ear in WT (n = 3), LysM-Cre Glut3fl/fl (n = 4), and LysM-Cre Glut1fl/fl (n = 3) mice. Pan-macrophage marker (Adgre1 [F4/80]), M1 markers (Nos2 and Tnfa) (E), and M2 markers (Arg1, Mrc1, and Retnla) (F) were observed. (G) Representative immunofluorescent staining of Arg1 (green) and F4/80 (red) in the back skin of calcipotriol treated mice (day 8). Scale bars: 50 μm. (Right) Quantification of M2 macrophages at wound sites (day 8). The number of F4/80+Arg1+ (M2) cells present relative to the total number of F4/80+ cells. Data shown as mean ± SEM. P values were calculated by 1-way ANOVA with Dunnett’s test. *P ≤ 0.05; **P ≤ 0.01; ***P ≤ 0.001; ****P ≤ 0.0001.
Figure 3
Figure 3. Delayed wound healing in LysM-Cre Glut3fl/fl (GLUT3 KO) mice.
(A) Violin plots showing relative expression of GLUT1 and GLUT3 in alternative macrophages (Mac2) from single-cell RNA-seq profiles of indicated tissues from diabetic patients with no foot ulcer (n = 6), healing diabetic foot ulcer (n = 7), healthy nondiabetic skin (n = 10), or nonhealing diabetic foot ulcer (n = 4). Transcriptomic data are from Theocharidis et al. (28). DFU, diabetic foot ulcer. (B) Representative immunofluorescent staining of a patient biopsy specimen of a wound bed for CD68 (red) and GLUT3 (green). Arrows indicate cells expressing both CD68 and GLUT3 in the wound bed (see Supplemental Figure 5A). Scale bar: 20 μm. (C) Representative photos of wound site in WT, LysM-Cre Glut3fl/fl (GLUT3 KO), and LysM-Cre Glut1fl/fl (GLUT1 KO) mice 6 days after injury. (D) Measurements of wound diameter on day 6 in WT (n = 12), LysM-Cre Glut3fl/fl (n = 12), and LysM-Cre Glut1fl/fl (n = 7) mice (see Supplemental Figure 5C). (E) Quantification of M2 macrophages at wound sites (day 6). The number of F4/80+Arg1+ (M2) cells present relative to the total number of F4/80+ cells (see Supplemental Figure 5D). (F) Representative immunofluorescent staining for Arg1 (green), F4/80 (red), and with DAPI (blue) in the wound site (day 6). Scale bars: 50 μm. (G and H) mRNA expression levels of M0/M1 markers (Adgre1 [F4/80], Nos2, and Tnfa) (E) or M2 markers (Arg1, Mrc1, and Retnla) (F) in WT (n = 3), LysM-Cre Glut3fl/fl (n = 3), and LysM-Cre Glut1fl/fl (n = 3) mice. Data shown as mean ± SEM. P values were calculated by 1-way ANOVA with Dunnett’s test. *P ≤ 0.05; ***P ≤ 0.001; ****P ≤ 0.0001.
Figure 4
Figure 4. GLUT3 activates STAT6 signaling and M2 polarization independently of glucose transport activity.
(A) Western blot (WB) for phospho-STAT6 (p-STAT6) and total STAT6 (t-STAT6) with and without IL-4 activation (30 minutes) in WT and LysM-Cre Glut3fl/fl (GLUT3 KO) BMDMs. Mean of p-STAT6/t-STAT6 levels from quantification of WB (n = 3 biological replicates; Supplemental Figure 6B). (B) Western blot for p-STAT6 and t-STAT6 after shRNA knockdown of endogenous GLUT3 in THP-1 cells (n = 3 biological replicates; Supplemental Figure 6C). (C) Levels of p-JAK1 (Y1034/1035) and t-JAK1 was determined in WT and LysM-Cre Glut3fl/fl BMDMs with and without IL-4 stimulation (n = 2 biological replicates). (D) Levels of p-STAT6 and t-STAT6 after overexpression of WT GLUT3 or GLUT3 R331W mutant and GLUT3 shRNA in THP-1 cells. Mean of p-STAT6/t-STAT6 levels from quantification of WB (n = 3 biological replicates; Supplemental Figure 7D). (E) Expression of the indicated mRNA was assessed in THP-1 cells with and without IL-4 stimulation (24 hours). (F) Levels of p-STAT6 and t-STAT6 were assessed in THP-1 cells after treatment with the indicated concentration of G3iA and IL-4 stimulation (30 minutes). Mean of p-STAT6/t-STAT6 levels from quantification of WB (n = 3 biological replicates; Supplemental Figure 7G). (G) Expression of the indicated mRNA was assessed in THP-1 cells with the indicated concentration of G3iA with and without IL-4 stimulation (24 hours). P values were calculated by 2-way ANOVA with Tukey’s test. ****P ≤ 0.0001.
Figure 5
Figure 5. GLUT3 is localized in endosomes.
(A) Representative immunofluorescence image of THP-1 cells labeled for GLUT1 (upper panel, green), GLUT3 (lower panel, green), EEA1 (red), and with DAPI (blue). Scale bars: 10 μm. (BD) Western blot analysis of the expression of GLUT3, GLUT1, p-STAT6, and STAT6 in the isolated plasma membrane (PM) and endosome fraction from WT and LysM-Cre Glut3fl/fl (GLUT3 KO) BMDMs (B), THP-1 cells (C), and Raw 264.7 cells (D). Na+/K+-ATPase and EEA1 are fractionation controls for the plasma membrane and endosome, respectively. (E) Western blot analysis of the expression of p-STAT6 and t-STAT6 in BMDMs with and without IL-4 (30 minutes) and with and without Dynasore.
Figure 6
Figure 6. GLUT3 promotes IL-4R subunit endocytosis and M2 polarization through its interaction with RAS.
(A and B) Western blot (WB) of IL-4Rα and γc chain in the plasma membrane (PM) and endosomal fractions from WT, LysM-Cre Glut3fl/fl (GLUT3 KO) BMDMs (A), and THP-1 cells transduced with control or GLUT3 shRNA (B). Na+/K+-ATPase and EEA1, fractionation controls. Mean of IL-4Rα and γc chain levels relative to EEA1 from quantification of WB (n = 3 biological replicates; Supplemental Figure 9, C and F). (C) HEK293T cells were transfected with the indicated GLUT allele, and GLUT1 (Thermo Fisher Scientific, MA1-37783) or GLUT3 (Abcam, ab15311) was immunoprecipitated. RAS was detected by Western blotting. Normal mouse/rabbit IgG, IP controls. (D) HEK293T cells were transfected with the indicated GLUT allele and immunoprecipitation performed after serum starvation (serum-free, SF) or refeeding as indicated. (E) HEK293T cells were transfected with the indicated GLUT3 allele (Supplemental Figure 9I) and GLUT3 alleles were FLAG immunoprecipitated; RAS was detected by Western blotting. IgG indicates a normal mouse IgG control. (F) The indicated GST fusion protein was bound to glutathione-agarose and incubated with GDP- or GTP-bound (GMP-PNP) KRAS as indicated. Bound proteins were eluted and assessed by Western blotting. The GST blot was stripped and probed for RAS to ensure even loading. (G) Levels of p-STAT6 after expression of indicated shRNA-resistant GLUT3 allele and shRNA of endogenous GLUT3 in THP-1 cells. (H) THP-1 were transduced with the indicated shRNA and shRNA-resistant GLUT3 allele and then the indicated M2 marker (MRC1, TGM2) was assessed by qRT-PCR after IL-4 stimulation (24 hours). P values were calculated by 1-way ANOVA with Dunnett’s test. ***P ≤ 0.001, ****P ≤ 0.0001.
Figure 7
Figure 7. GLUT3 is required for PAK/cofilin signaling and macropinocytosis in macrophages.
(A and B) Levels of phospho-PAK (p-PAK), total PAK (t-PAK), p-cofilin, and t-cofilin with and without IL-4 (30 minutes) in WT, LysM-Cre Glut3fl/fl (GLUT3 KO) BMDMs (A), and shRNA-transduced THP-1 cells (B). (C) Levels of p-PAK, t-PAK, p-cofilin, and t-cofilin after expression of indicated shRNA-resistant GLUT3 allele and shRNA of endogenous GLUT3 in THP-1 cells. (D) Representative IF image of WT or LysM-Cre Glut3fl/fl BMDMs incubated in FITC-dextran. Scale bars: 50 μm. (E) Quantification of mean fluorescence intensity (MFI) per field (Zen) normalized by cell number (n = 3 biological replicates). Data shown as mean ± SEM. P values were calculated by 2-tailed t test. *P ≤ 0.05.

Comment in

References

    1. Mantovani A, et al. Macrophage polarization comes of age. Immunity. 2005;23(4):344–346. doi: 10.1016/j.immuni.2005.10.001. - DOI - PubMed
    1. Ley K. M1 means kill; M2 means heal. J Immunol. 2017;199(7):2191–2193. doi: 10.4049/jimmunol.1701135. - DOI - PubMed
    1. Sica A, Mantovani A. Macrophage plasticity and polarization: in vivo veritas. J Clin Invest. 2012;122(3):787–795. doi: 10.1172/JCI59643. - DOI - PMC - PubMed
    1. Murray PJ. Macrophage polarization. Annu Rev Physiol. 2017;79:541–566. doi: 10.1146/annurev-physiol-022516-034339. - DOI - PubMed
    1. Orecchioni M, et al. Macrophage polarization: different gene signatures in M1(LPS+) vs. Classically and M2(LPS-) vs. Alternatively activated macrophages. Front Immunol. 2019;10:1084. doi: 10.3389/fimmu.2019.01084. - DOI - PMC - PubMed

Publication types