. 2023 Nov;623(7985):122-131.
doi: 10.1038/s41586-023-06627-y. Epub 2023 Sep 18.

Cholinergic neurons trigger epithelial Ca2+ currents to heal the gut

Affiliations

Cholinergic neurons trigger epithelial Ca2+ currents to heal the gut

Afroditi Petsakou et al. Nature. 2023 Nov.

Abstract

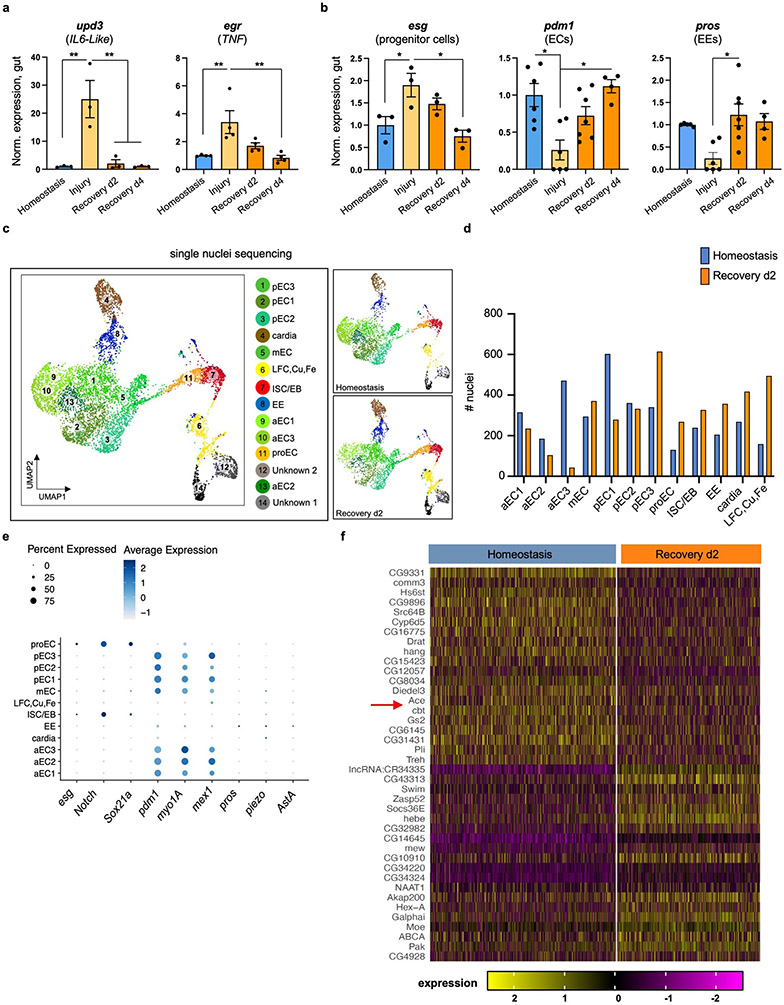
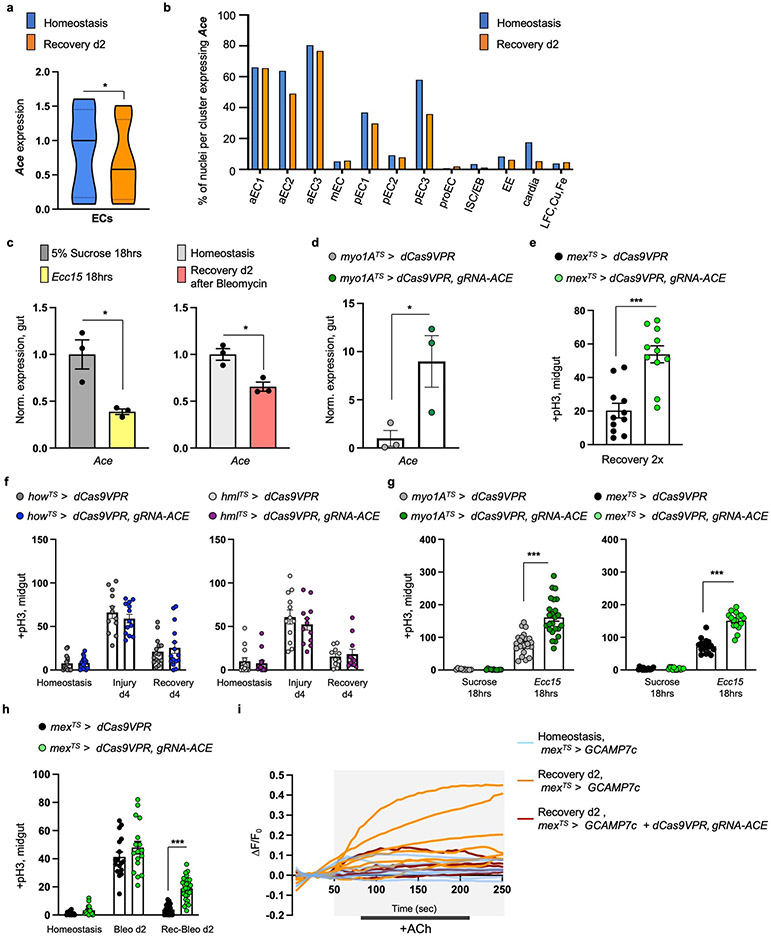
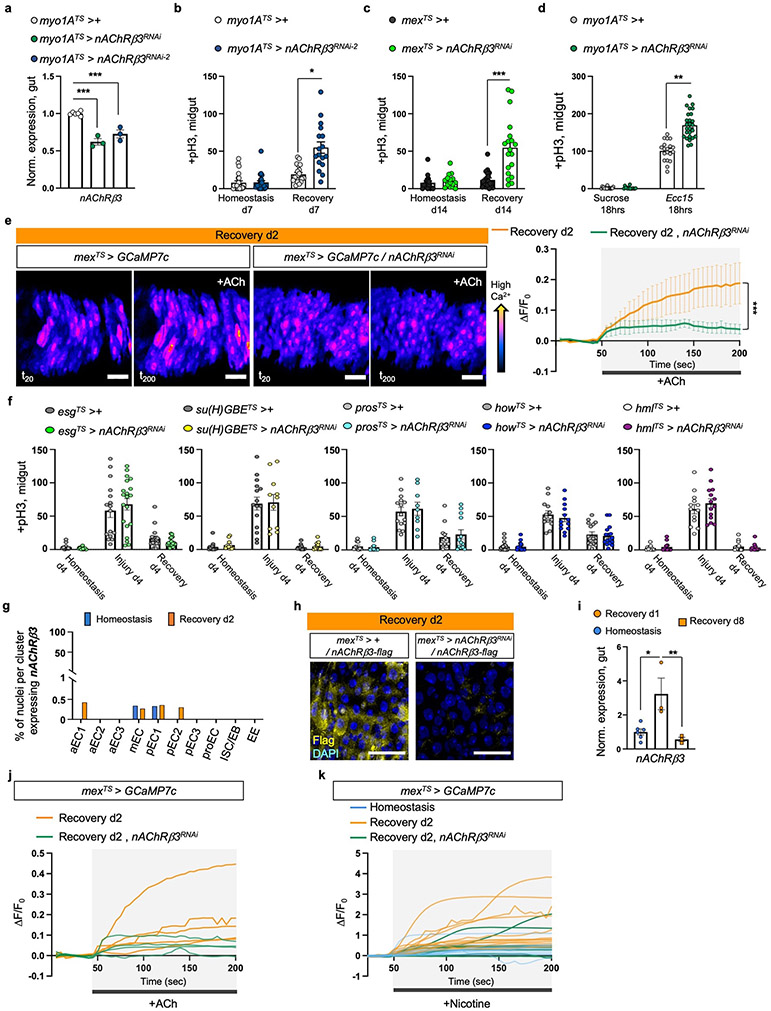
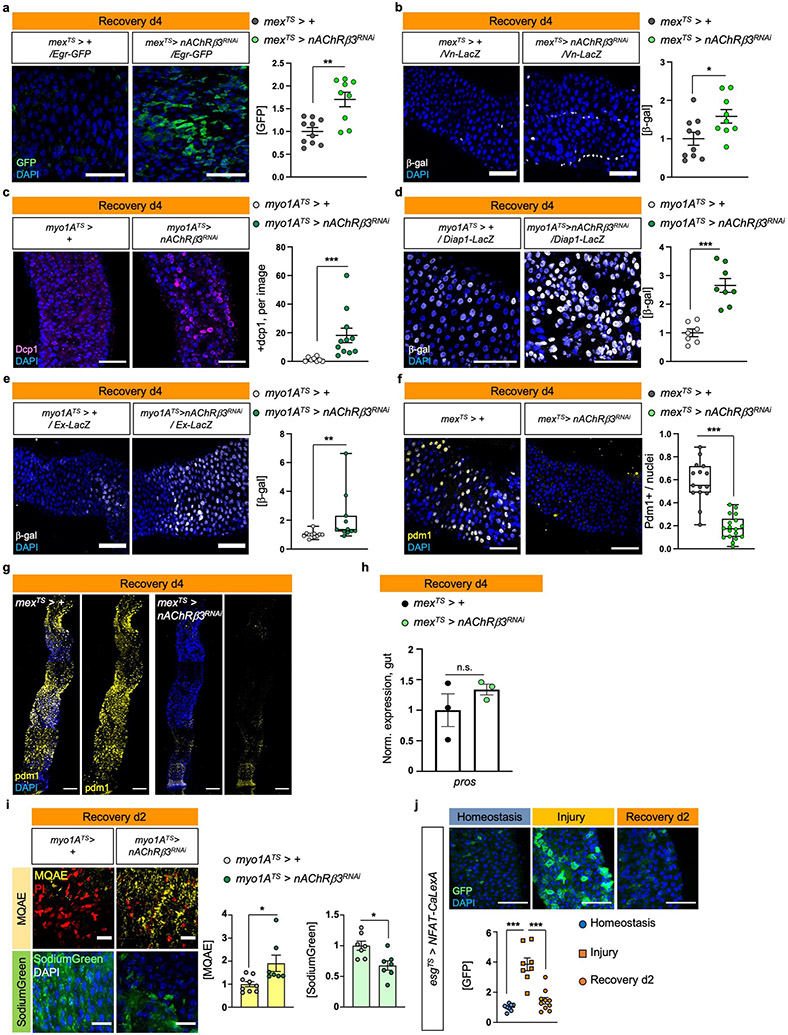
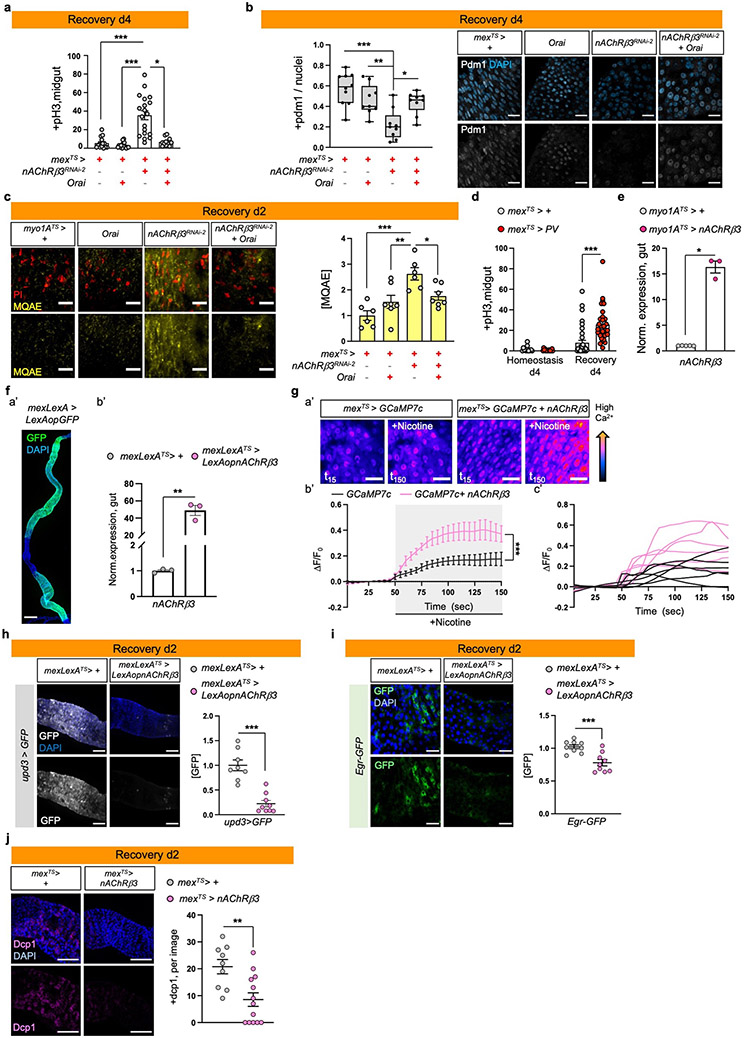
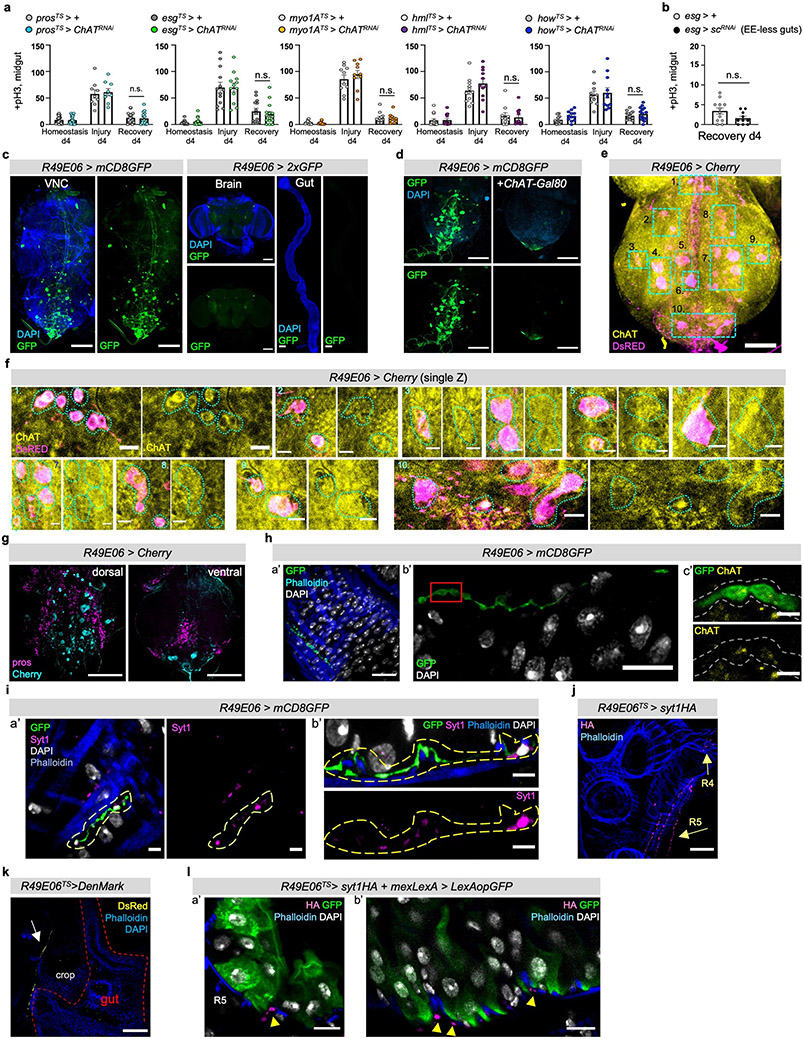
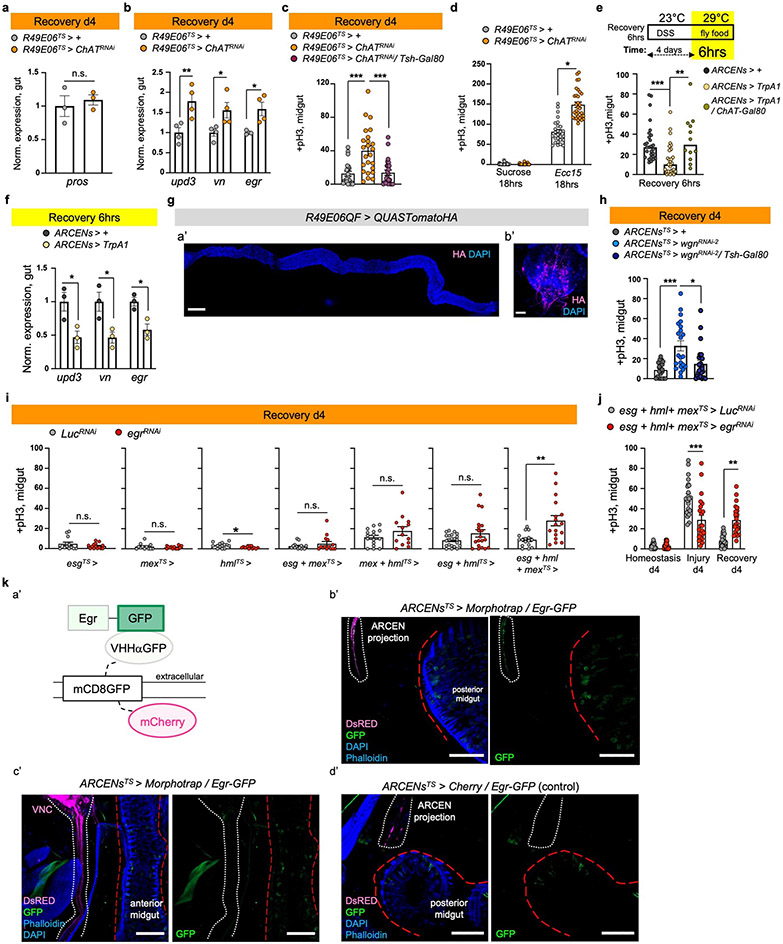
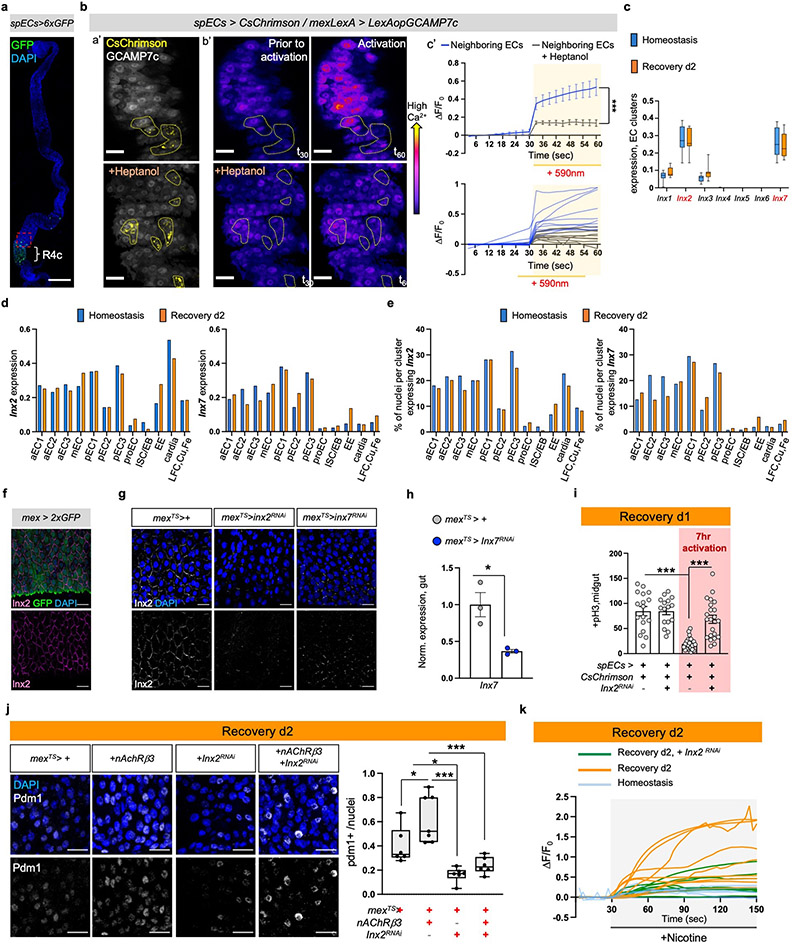
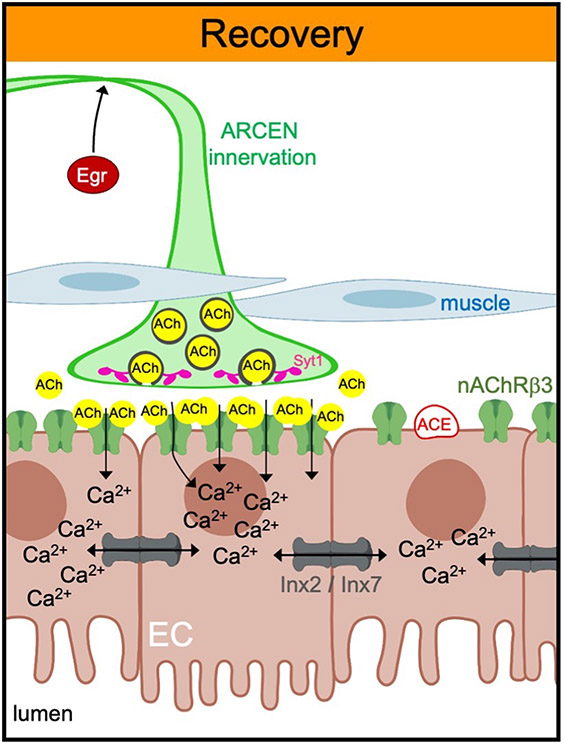
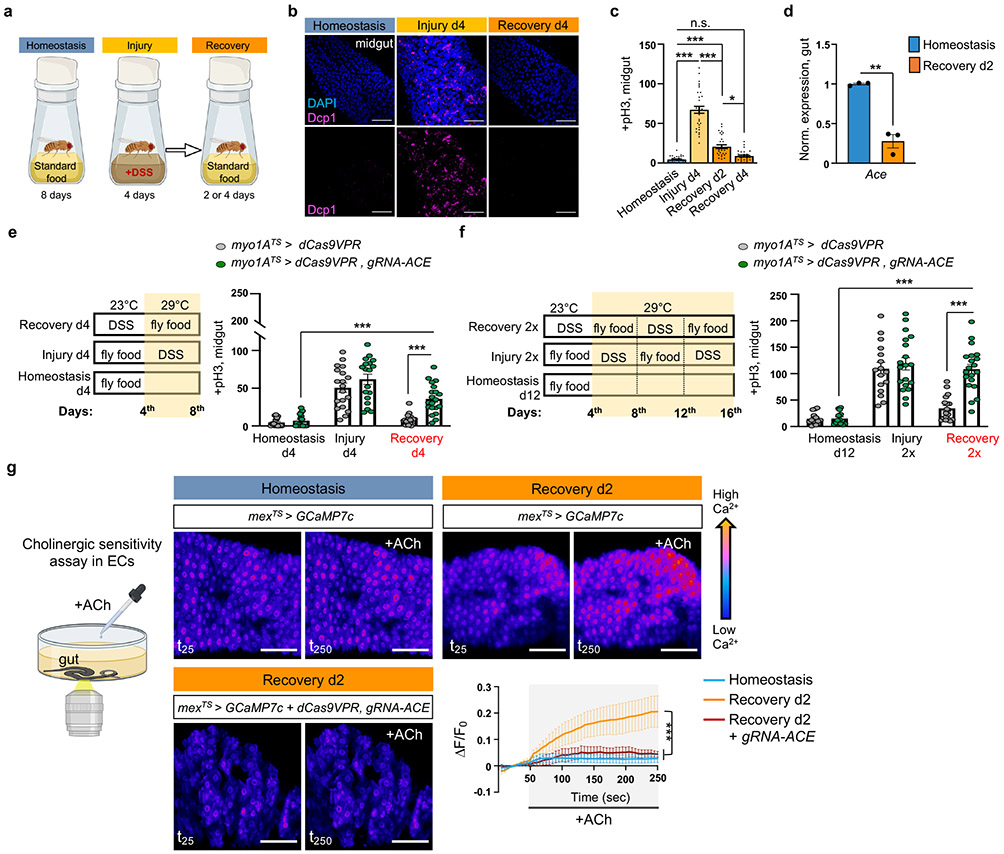
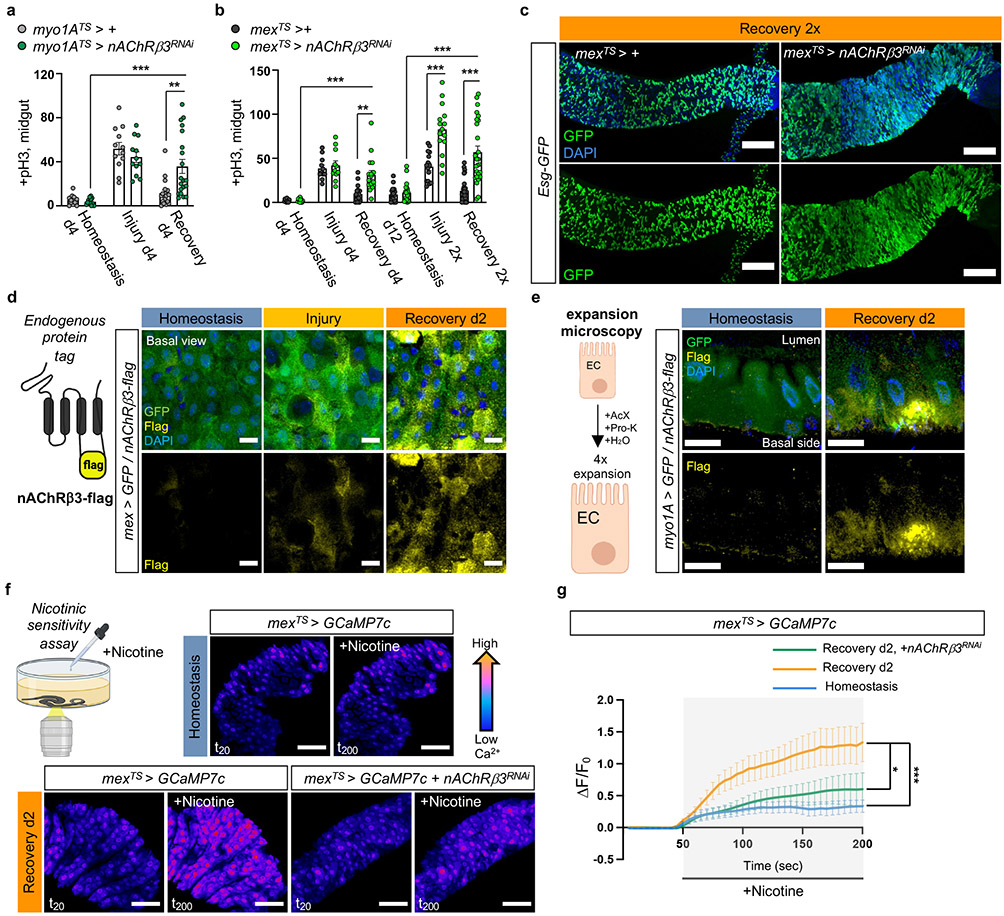
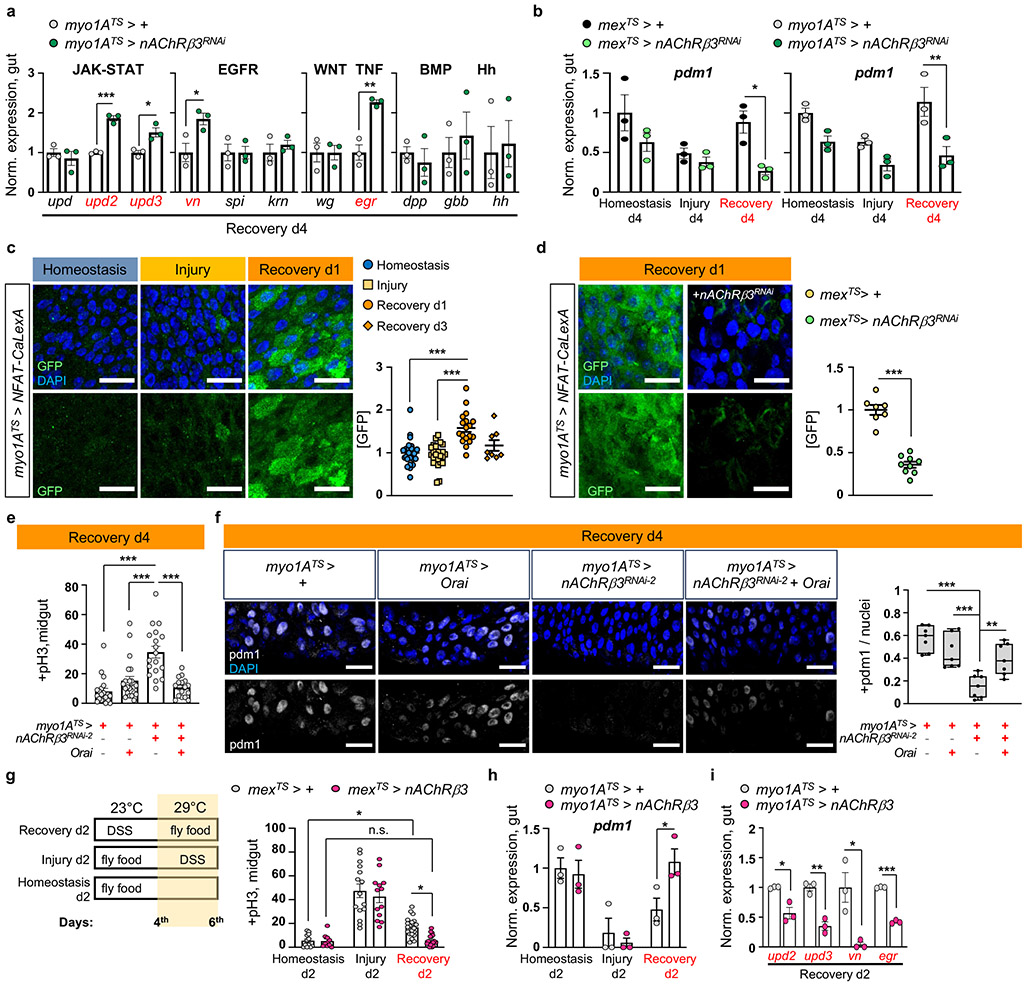
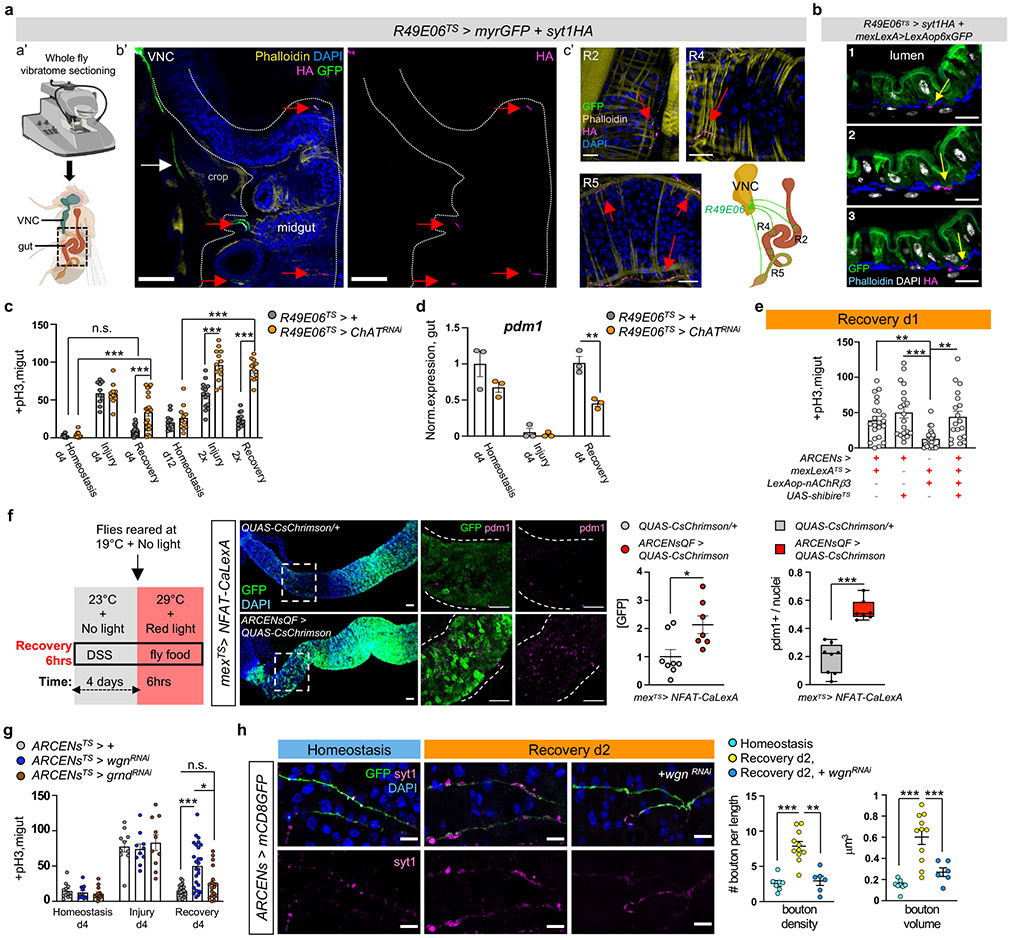
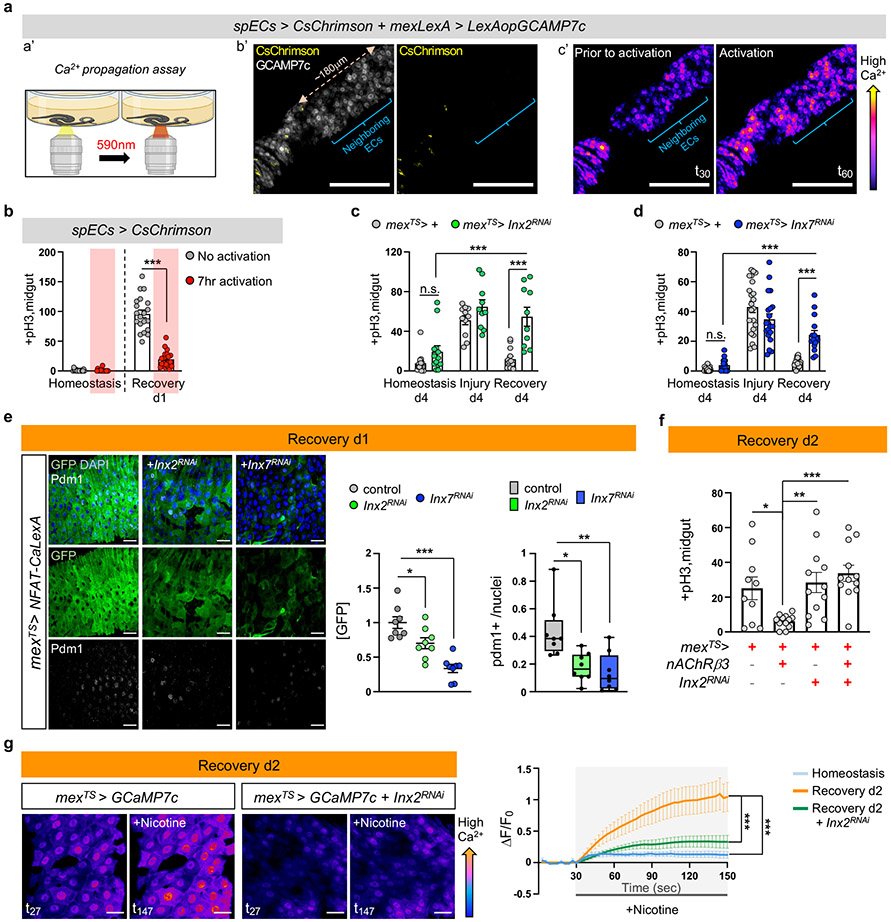
A fundamental and unresolved question in regenerative biology is how tissues return to homeostasis after injury. Answering this question is essential for understanding the aetiology of chronic disorders such as inflammatory bowel diseases and cancer1. We used the Drosophila midgut2 to investigate this and discovered that during regeneration a subpopulation of cholinergic3 neurons triggers Ca2+ currents among intestinal epithelial cells, the enterocytes, to promote return to homeostasis. We found that downregulation of the conserved cholinergic enzyme acetylcholinesterase4 in the gut epithelium enables acetylcholine from specific Egr5 (TNF in mammals)-sensing cholinergic neurons to activate nicotinic receptors in innervated enterocytes. This activation triggers high Ca2+, which spreads in the epithelium through Innexin2-Innexin7 gap junctions6, promoting enterocyte maturation followed by reduction of proliferation and inflammation. Disrupting this process causes chronic injury consisting of ion imbalance, Yki (YAP in humans) activation7, cell death and increase of inflammatory cytokines reminiscent of inflammatory bowel diseases8. Altogether, the conserved cholinergic pathway facilitates epithelial Ca2+ currents that heal the intestinal epithelium. Our findings demonstrate nerve- and bioelectric9-dependent intestinal regeneration and advance our current understanding of how a tissue returns to homeostasis after injury.


Figures

Ext. Data Fig.1 ∣
Ext. Data Fig.1 ∣. Ace is downregulated during recovery.
a, Expression levels of conserved inflammatory cytokines (unpaired-3/upd-3 and eiger/egr) in guts of Ore R flies undergoing DSS-induced repair. Normalized to Homeostasis. n=3 biologically independent samples per condition. Tukey’s one-way Anova: p=0.0046 (upd3: Hom. vs Injury & Injury vs Rec. d4), p=0.0061(upd3: Injury vs Rec. d2), p=0.0096 (egr: Hom. vs Injury), p=0.006 (Injury vs Rec. d4). b, Expression levels of markers for PCs (escargot, esg), ECs (pdm1), EEs (prospero, pros) in guts of Ore R flies undergoing DSS-induced repair. Normalized to Homeostasis. Homeostasis: n=3 (esg), n=6 (pdm1), n=5 (pros) biologically independent samples. Injury: n=3 (esg), n=6 (pdm1), n=6 (pros) biologically independent samples. Rec. d2: n=3 (esg), n=7 (pdm1, pros) biologically independent samples. Rec. d4: n=3 (esg), n=4 (pdm1, pros) biologically independent samples. Tukey’s one-way Anova: p=0.0393 (Hom. vs Injury, esg), p=0.0112 (Injury vs Rec. d4, esg). Dunn’s Kruskal-Wallis test: p=0.0384 (Hom. vs Injury, pdm1), p=0.0227 (Injury vs Rec. 4, pdm1), p=0.0157 (Injury vs Rec. d2, pros). c, Annotated gut cell type clusters of Ore R flies after snRNAseq, visualized with UMAP (n= total of 8073 nuclei). d, Graph depicting the number of gut nuclei recovered per cluster and per condition after snRNAseq of Ore R flies (n=total of 7411 nuclei in gut clusters). e, Dot plot per snRNAseq gut cluster illustrating the average expression (blue color range) and percent of expression (dot size) of marker genes for ECs (pdm1, myo1A, mex1), EEs (pros, piezo, AstA) and for PCs (esg, Notch, Sox21a) [PCs: ISC/EB and proEC]. (n=total of 7411 gut nuclei). f, Heatmap of significantly upregulated and downregulated genes in EC clusters (S. Table 1-2) after snRNAseq (n= total of 4547 nuclei in EC clusters). Red arrow: Acetylcholinesterase (Ace). *: 0.05>p>0.01, **: 0.01>p>0.001. Data are presented as mean values ± SEM.
Ext. Data Fig.2 ∣
Ext. Data Fig.2 ∣. ACh sensitivity is required for recovery.
a, Violin plot illustrating the mean expression of Ace per condition in EC clusters after snRNAseq of Ore R flies (p=0.0364). n= 4547 nuclei in EC clusters. Statistics: two-tailed negative binomial exact test, adjusted with Benjamini-Hochberg procedure. Violin plot: median, 1st and 3rd quartile. b, Graph depicting percentage of nuclei expressing Ace per snRNAseq gut cluster and condition (n=7411 gut nuclei). c, Expression levels of Ace in Ore R guts after 18hrs of Ecc15 bacterial infection (yellow) or 2 days after Bleomycin-injury (pink) compared to unchallenged guts (5% sucrose: grey, homeostasis: light grey). n=3 biologically independent samples per condition. two-tailed t-test: p=0.0179 (Suc. vs Ecc15), p=0.0121 (Hom. vs Bleo). d, Validation of ACE overexpression using CRISPR-OE .n=3 biologically independent samples per genotype. two-tailed t-test: p=0.0461. e, Mitotic division counts of proliferating ISCs with anti-pH3 from midgut of control (mexTS > dCas9VPR) and flies with conditional Ace overexpression (mexTS > dCas9VPR, gRNA-Ace) in ECs during Recovery 2x (like Fig.1f). n=11 guts per genotype examined over 2 independent experiments. two tailed Mann-Whitney test: p=0.0001. f, pH3+ counts from midgut of control (howTS > dCas9VPR, hmlTS > dCas9VPR) and flies with conditional Ace overexpression in the visceral muscle (howTS > dCas9VPR, gRNA-Ace) and in hemocytes (immune cells, hmlTS > dCas9VPR, gRNA-Ace). Conditions like Fig. 1e. Two-way Anova. howTS>dCas9VPR: n=15(Hom, Rec.d4), n=12(Injury) guts; howTS>dCas9VPR,gRNA-Ace: n=15(Hom, Rec.d4), n=13 (Injury) guts; hmlTS > dCas9VPR: n=13(Hom.), n=12(Injury), n=10(Rec. d4) guts, hmlTS>dCas9VPR,gRNA-Ace: n=14(Hom.), n=12 (Injury), n=11(Rec. d4) guts, examined over 3 independent experiments. g, pH3+counts from midgut of control (myo1ATS> dCas9VPR, mexTS > dCas9VPR) and flies with conditional Ace overexpression (myo1ATS> dCas9VPR, gRNA-Ace and mexTS > dCas9VPR, gRNA-Ace ) in ECs after 18hrs of 5% sucrose feeding or 18hrs of Ecc15 oral infection (29°C). myo1ATS> dCas9VPR: n=10(Suc.), n=23 (Ecc15) guts; myo1ATS>dCas9VPR,gRNA-Ace: n=11(Suc.), n=24(Ecc15) guts; mexTS> dCas9VPR: n=16(Suc.), n=17(Ecc15) guts; mexTS>dCas9VPR, gRNA-Ace: n=15(Suc.), n=16 (Ecc15) guts, examined over 2 independent experiments. Tukey’s one-way Anova. h, pH3+ counts from mexTS > dCas9VPR and mexTS > dCas9VPR, gRNA-Ace guts during Homeostasis, 2 days feeding with Bleomycin (Bleo d2) and 2 days recovery after Bleomycin (Rec-Bleo d2) at 29°C. mexTS> dCas9VPR: n=15(Hom.), n=17(Bleo.), n=32 (Rec.) guts; mexTS>dCas9VPR, gRNA-Ace: n=16(Hom.), n=17 (Bleo.), n=29 (Rec.) guts, examined over 3 independent experiments. Tukey’s one-way Anova. i, Relative fluorescence intensity (ΔF/F0) per frame (5 seconds per frame) and per genotype of individual guts as described in Fig. 1g. *: 0.05>p>0.01, ***: p<0.001. Data are presented as mean values ± SEM.
Ext. Data Fig.3 ∣
Ext. Data Fig.3 ∣. nAChRβ3 is required in ECs for recovery.
a, nAcRβ3RNAi validation. n=6 (control), n=3 (nAChRβ3RNAi , nAChRβ3RNAi-2 ) biologically independent samples. Statistics: Dunnett’s one-way Anova. b, pH3+ counts from control (myo1ATS>+) guts and when nAChRβ3 is reduced in ECs (myo1ATS>nAChRβ3RNAi-2). Recovery d7: 7 days standard food (29°C) after 4 days DSS-feeding (23°C). Homeostasis d7: 7 days standard food (29°C). p= 0.0496 (Dunn’s Kruskal-Wallis test). myo1ATS>+: n=23(Hom.), n=20(Rec. d7) guts; myo1ATS>nAChRβ3RNAi-2: n=23(Hom.), n=17(Rec. d7) guts, examined over 3 independent experiments. c, pH3+ counts from mexTS>+ and mexTS>nAChRβ3RNAi guts. Recovery d14: 14 days standard food (29°C) after 4 days of DSS-feeding (23°C). Homeostasis d14: 14 days standard food (29°C). p= 0.0007(Kruskal-Wallis test). mexTS>+ : n=16(Hom.), n=20(Rec. d14) guts; mexTS>nAChRβ3RNAi: n=16(Hom.), n=19(Rec. d14) examined over 3 independent experiments. d, pH3+ counts from myo1ATS>+ and myo1ATS >nAChRβ3RNAi guts after Ecc15 oral infection and after 5% sucrose feeding. Conditions like Ext. Data Fig.2g. p= 0.0099 (Dunn’s Kruskal-Wallis test). myo1ATS>+ : n=17 (Suc.), n=19 (Ecc15) guts; myo1ATS >nAChRβ3RNAi n=15 (Suc.), n=26 (Ecc15) guts examined over 3 independent experiments. e, Representative color-coded sequential frames before (fr20) and after (fr200) ACh administration from control (mexTS > GCAM7c) and mexTS > GCAM7c +nAChRβ3RNAi midguts (Like in Fig. 1g). scale bar: 25μm. Accompanying graph: average relative fluorescence intensity (ΔF/F0) per frame (5 seconds per frame) and per genotype. n=4 (control), n=5 (nAChRβ3RNAi ) guts examined over 2 independent experiments (two-way Anova). Individual ΔF/F0 per gut on Ext. Data Fig.3j. f, pH3+ counts from control and when reducing nAcRβ3 in PCs (esgTS>nAChRβ3RNAi), EBs (su(H)GBETS>nAChRβ3RNAi), EEs (prosTS> nAChRβ3RNAi), visceral muscle (howTS > nAChRβ3RNAi) and hemocytes (hmlTS> nAChRβ3RNAi). Conditions like Fig. 1e. Statistics: Sidak’s two-way Anova. esgTS>+ : n=16 (Hom., Injury) n=17 (Rec.) guts; esgTS>nAChRβ3RNAi: n=14(Hom.), n= 20(Injury), n=18(Rec) guts, over 2 independent experiments. Su(H)GBETS>+ : n=16(Hom.), n=15 (Injury), n=13 (Rec.) guts; Su(H)GBETS>nAChRβ3RNAi: n=11(Hom., Injury), n=15(Rec) guts examined over 2 independent experiments. prosTS>+ : n=10 (Hom.), n=15(Injury), n=12(Rec.) guts; prosTS>nAChRβ3RNAi: n=10(Hom.), n=9(Injury), n=13(Rec) guts examined over 2 independent experiments. howTS>+ : n=20(Hom.), n=13(Injury), n=16(Rec.) guts; howTS>nAChRβ3RNAi: n=19(Hom.), n=13(Injury), n=16(Rec) guts examined over 2 independent experiments. hmlTS>+ : n=12(Hom.), n=13(Injury), n=14(Rec.) guts; hmlTS>nAChRβ3RNAi: n=12(Hom.), n=14(Injury), n=13(Rec) guts examined over 2 independent experiments. g, Graph depicting percentage of nuclei expressing nAChRβ3 per snRNAseq gut cluster (n=7411 gut nuclei). h, nAChRβ3-flag validation: Midgut expressing nAChRβ3-flag (mexTS> +/nAChRβ3-flag) and when knocking down nAChRβ3 in ECs (mexTS>nAChRβ3RNAi/nAChRβ3-flag). anti-Flag: nAChRβ3-flag (yellow). DAPI: nuclei (blue). Images are representative of 2 independent experiments with similar results. scale bar: 25μm. i, nAChRβ3 expression levels in Ore R guts. Tukey’s one-way Anova: p= 0.0104(Hom. vs Rec. d1), p=0.0085(Rec. d1 vs Rec. d8). n= 6 (Hom.), n=3(Rec. d1, Rec. d8) biologically independent samples. j-k, Relative fluorescence intensity (ΔF/F0) per frame (5 seconds per frame) and genotype of each gut as described in Ext. Data Fig.3e and Fig. 2g, respectively. *: 0.05>p>0.01, **: 0.01<p<0.001, ***: p<0.001. Data are presented as mean values ± SEM.
Ext. Data Fig.4 ∣
Ext. Data Fig.4 ∣. nAChRβ3 promotes EC maturation.
a, Representative image of posterior midgut from control (mexTS>+/Egr-GFP) flies and when nAChRβ3 is reduced in ECs (mexTS>nAChRβ3RNAi/ Egr-GFP) together with the protein trap Egr-GFP (anti-GFP, green). Accompanying graph: fluorescence fold change per image. n=10 (control), n=9 (nAChRβ3RNAi) guts examined over 2 independent experiments. Statistics: two-tailed Mann-Whitney test, p=0.0057. Conditions like Fig.1e. scale bar: 50μm. b, Representative images of posterior midguts from control (mexTS>+/Vn-LacZ) and when nAChRβ3 is reduced in ECs (mexTS> nAChRβ3RNAi/Vn-LacZ) together with the Vn-LacZ reporter (anti-β-gal, white). Accompanying graph: fluorescence fold change per image. n=10 (control), n=9 (nAChRβ3RNAi) guts examined over 2 independent experiments. Conditions like Fig.1e. Statistics: two-tailed t-test, p=0.0279. scale bar: 50μm. c, Representative images of posterior midguts from myo1ATS>+ and myo1ATS> nAChRβ3RNAi flies stained with anti-Dcp1: cell death (pink). Conditions like Fig.1e. Accompanying graph: Dcp1+ cells per image. n=8 (control), n=11 (nAChRβ3RNAi) guts examined over 2 independent experiments. Statistics: two-tailed Mann-Whitney test. scale bar: 50μm. d, Representative images of posterior midguts from control (myo1ATS>+/Diap1-LacZ) and when knocking down nAChRβ3 in ECs (myo1ATS> nAChRβ3RNAi/Diap1-LacZ) together with Diap1-LacZ (Yki target gene, anti-β-gal: white). Conditions like Fig.1e. Accompanying graph: fluorescence fold change per image. n=7 (control), n=8 (nAChRβ3RNAi) guts examined over 2 independent experiments. Statistics: two-tailed t-test. scale bar: 50μm. e, Representative images of posterior midgut from control (myo1ATS>+/Ex-LacZ) and when nAChRβ3 is reduced in ECs (myo1ATS> nAChRβ3RNAi /Ex-LacZ) together with Ex-LacZ (Yki target gene, anti-β-gal: white). Conditions like Fig.1e. Boxplot: fluorescence fold change per image (median, 1st and 3rd quartile, whiskers: minimum maximum values). n=11 guts per genotype examined over 2 independent experiments. Statistics: two-tailed Mann-Whitney test, p=0.0014. scale bar: 50μm. f-g, Representative images from posterior midgut of mexTS>+ and mexTS> nAChRβ3RNAi flies stained with anti-pdm1: EC (yellow). Conditions like Fig.1e. Boxplot: pdm1+ cells over total nuclei per image (median, 1st and 3rd quartile, whiskers: minimum maximum values). n=15 (control), n=18 (nAChRβ3RNAi) guts examined over 3 independent experiments. Statistics: two-tailed t-test. scale bars: 50μm(f),100μm(g). h, Pros expression levels. n=3 biologically independent samples per genotype. Statistics: two-tailed t-test. i, Representative images of posterior midgut assayed with MQAE dye (intracellular Cl via diffusion-limited collisional quenching, yellow) and SodiumGreen dye (intracellular Na+, green) from control myo1ATS>+ and myo1ATS>nAChRβ3RNAi flies. PI: nuclei (Propidium Iodide, red). See Methods for conditions. Accompanying graphs: fluorescence fold change per image. n= 9 (control/MQAE), n=7 (nAChRβ3RNAi/MQAE) guts, n=7 (SodiumGreen per genotype) guts examined over 2 independent experiments per dye. Statistics: p=0.0115 (two tailed Mann-Whitney test/ MQAE), p=0.0103 (two-tailed t-test/SodiumGreen). scale bar: 20μm. j, Representative images from posterior midgut with PCs expressing NFAT-CaLexA (esgTS>NFAT-CaLexA). anti-GFP: Ca2+ (green). NFAT-CaLexA was expressed for 2 days (29°C) per condition. Accompanying graph: fluorescence fold change per image. n= 8 (Hom., Injury), n=10 (Rec. d2) guts examined over 2 independent experiments (Tukey’s one-way Anova). scale bar: 50μm. *: 0.05>p>0.01, **: 0.01<p<0.001, ***: p<0.001. n.s.: non-significant. Data are presented as mean values ± SEM.
Ext. Data Fig.5 ∣
Ext. Data Fig.5 ∣. nAChRβ3-mediated Ca2 promotes recovery.
a, pH3+ counts of control (mexTS>+), guts with Orai (Ca2+ channel) overexpressed in ECs (mexTS>Orai), nAChRβ3 reduced in ECs (mexTS>nAChRβ3RNAi-2) and combined (mexATS>nAChRβ3RNAi-2+ Orai) during Recovery d4 (Like Fig.1e). n=15 (mexTS>+), n=19 (mexTS>nAChRβ3RNAi-2), n=16 (mexTS>Orai), n=11(mexATS>nAChRβ3RNAi-2+ Orai) guts examined over 2 independent experiments. Statistics: Dunn’s Kruskal-Wallis test, p=0.013 (nAChRβ3RNAi-2 vs nAChRβ3RNAi-2+ Orai). b, Representative images of posterior midgut of flies as in Ext. Data Fig.5a. anti-pdm1: ECs (grey). Boxplot: pdm1+ cells over total nuclei per image (median, 1st and 3rd quartile, whiskers: minimum maximum values). n=10 (control), n=9 (nAChRβ3RNAi-2, Orai nAChRβ3RNAi-2+ Orai guts) guts examined over 2 independent experiments. Statistics: Tukey’s one-way Anova, p=0.0048 (nAChRβ3RNAi-2 vs Orai), p=0.0144 (nAChRβ3RNAi-2 vs nAChRβ3RNAi-2+ Orai). scale bar: 25μm. c, Representative images of posterior midguts assayed with MQAE (like Ext. Data Fig.4i) of myo1ATS>+, myo1ATS>Orai, myo1ATS>nAChRβ3RNAi-2 and myo1ATS>nAChRβ3RNAi-2 + Orai flies. Accompanying graph: fluorescence fold change per image. n=6 (myo1ATS>+), n=6 (myo1ATS>nAChRβ3RNAi-2), n=7(myo1ATS>Orai), n=7 (myo1ATS>nAChRβ3RNAi-2 +Orai) guts examined over 2 independent experiments. Statistics: Tukey’s one-way Anova, p=0.0002 (control vs nAChRβ3RNAi-2), p=0.0084 (Orai vs nAChRβ3RNAi-2), p=0.0441 (nAChRβ3RNAi-2 vs Orai + nAChRβ3RNAi-2). scale bar: 25μm. d, pH3+ counts from control (mexTS>+) and flies overexpressing parvalbumin in ECs (mexTS>PV). Conditions like Fig. 1e. Control: n=14 (Hom.), n=37 (Rec.d4) guts, mexTS>PV: n=17 (Hom.), n=30 (Rec.d4) guts examined over 3 independent experiments. Statistics: Dunn’s Kruskal-Wallis test. e, Validation of UAS-nAcRβ3. n=6 (control), n=3 (myo1ATS> nAcRβ3) biologically independent samples. Statistics: two-tailed Mann-Whitney test, p=0.0357. f, Validation of a’: mexLexA (mexLexA::GAD), scale bar: 200μm. Image is representative of 2 independent experiments with similar results; b’: LexAopnAChRβ3. n= 3 biologically independent samples per genotype. Statistics: two-tailed t-test, p=0.0012. g, a’: Representative color-coded sequential frames of mexTS>GCAM7c and mexTS>GCAM7c+nAChRβ3 guts before (t15) and after (t150) nicotine administration. b’: average relative fluorescence intensity (ΔF/F0) per frame (5 seconds per frame) and genotype. Conditions: 2 days standard food (29°C). N=6 guts per genotype examined over 2 independent experiments. c’: relative fluorescence intensity of each gut. Statistics: two-way Anova. scale bar: 25μm. h, Representative images of posterior midguts from control (mexLexATS>+/upd3>GFP) and when nAChRβ3 is overexpressed in ECs (mexLexATS> LexAopnAChRβ3 /upd3>GFP) together with upd3-Gal4 driving UAS-GFP (anti-GFP, white). Conditions like Fig. 3g. Accompanying graph: fluorescence fold change per image. n=8 (control), n=9 (mexLexATS> LexAopnAChRβ3) guts examined over 2 independent experiments. Statistics: two-tailed Mann-Whitney test, p=0.0002. scale bar: 100μm. i, Representative images of posterior midguts from mexLexATS>+/Egr-GFP and mexLexATS>LexAopnAChRβ3/Egr-GFP flies (anti-GFP, green). Conditions like Fig. 3g. Accompanying graph: fluorescence fold change per image. n=9 guts per genotype examined over 2 independent experiments. Statistics: two-tailed t-test, p=0.0006. scale bar: 25μm. j, Representative images of posterior midguts from control (mexTS>+) and mexTS>nAChRβ3 flies stained with anti-Dcp1(pink). Conditions like Fig. 3g. Accompanying graph: Dcp1+ cells per image. n=9 (control), n=13 (mexTS>nAChRβ3) guts per genotype examined over 2 independent experiments. Statistics: two-tailed Mann-Whitney test, p=0.0064. scale bar: 100μm. DAPI: nuclei (blue). PI: nuclei (Propidium iodide, red). *: 0.05>p>0.01, **: 0.01<p<0.001, ***: p<0.001. Data are presented as mean values ± SEM.
Ext. Data Fig.6 ∣
Ext. Data Fig.6 ∣. R49E06-neurons innervate the gut.
a, pH3+ counts from control and from flies with conditional reduction of ChAT (Choline Acetyltransferase) in EEs (prosTS>), PCs (esgTS>), ECs (myo1ATS>), hemocytes (hmlTS>), visceral muscle (howTS> ). Conditions like Fig.1e. prosTS>+: n=20 (Hom.), n=9 (Injury), n=18 (Rec.) guts, prosTS>ChATRNAi: n=20 (Hom.), n=9 (Injury), n=16 (Rec.) guts; esgTS>+: n=13 (per condition) guts, esgTS>ChATRNAi: n=15 (Hom.), n=12 (Injury), n=15 (Rec.) guts; myo1ATS>+: n=11(Hom.), n=10 (Injury), n=12 (Rec.) guts, myo1ATS>ChATRNAi: n=12 (Hom.), n=10 (Injury), n=11 (Rec.) guts; hmlTS>+: n=13 (Hom.), n=11 (Injury), n=10 (Rec.) guts, hmlTS>ChATRNAi: n=12 (Hom.), n=11 (Injury), n=11 (Rec.) guts; howTS>+: n=11(Hom.), n=10 (Injury), n=15 (Rec.) guts, howTS>ChATRNAi: n=12 (Hom.), n=11 (Injury), n=15 (Rec.) guts examined over two independent experiments per cell type. Statistics: Sidak’s two-way Anova. b, pH3+counts from control (esg>+) and from flies without EEs (esg>scRNAi). n= 12 (control), n= 10 (esg>scRNAi) guts examined over 2 independent experiments. Statistics: two-tailed t-test. c, VNC (adult Ventral Nerve Cord), brain, and gut from R49E06>mCD8GFP and R49E06>2xEGFP flies. Images are representative of 3 independent experiments with similar results. anti-GFP: green. scale bar: 100μm. d, Posterior VNC from R49E06>mCD8GFP flies and together with the cholinergic repressor R49E06>mCD8GFP/ChAT-Gal80. anti-GFP: green. scale bar: 100μm. Images are representative of 2 independent experiments with similar results. e-f, Z-stack (e) and single Z-planes (f) from posterior VNC of R49E06>6xmCherry. anti-DsRed: magenta, anti-ChAT: yellow, numbered squares: ChAT+R49E06-neurons. scale bar: 50μm(e), 10μm (f). Image (e) is representative of 2 independent experiments with similar results. g, Posterior VNC from R49E06>6xmCherry. anti-pros: magenta, anti-DsRed: cyan. Ventral and dorsal from same stack. scale bar: 100μm. Images are representative of 2 independent experiments with similar results. h, R49E06-innervations (anti-GFP, green) in midguts of R49E06>mCD8GFP flies; a’: R4, Homeostasis, b’: R5, Recovery d2. Red square: domain of R49E06-innervation in c. c’: R49E06-innervation (grey line), anti-ChAT: yellow. scale bar: 20μm(h-a'), 10μm (h-b’), 2μm (h-c’). Images are representative of 2 independent experiments with similar results per condition. i, a’: innervated R4, b’: R5 from R49E06>mCD8GFP flies during Homeostasis. anti-GFP: R49E06-innervations (green), anti-Syt1: synaptic-vesicle marker (magenta). Yellow dots: Syt1+ boutons across innervations. scale bar: 4μm. Images are representative of 2 independent experiments with similar results. j, R49E06TS>syt1HA fly abdomen during Recovery d2. Yellow arrows: R49E06-innervations (anti-HA, magenta). scale bar: 50μm. Images are representative of 3 independent experiments with similar results. k, Fly abdomen with DenMarK expressed in R49E06-projections (R49E06TS>DenMark) during Recovery d2 (like Fig. 4a). anti-DsRed: DenMark (yellow). White arrow: DenMark-expressing ARCEN-projections, Dotted red line: gut. scale bar: 100μm. Images are representative of 2 independent experiments with similar results. l, R5 from R49E06TS>syt1HA+mexLexA>6xLexAopGFP (a’) and R49E06TS>syt1HA+mexLexA>LexAopGFP (b’) flies during Recovery d2. Yellow arrowheads: R49E06-innervations carrying the presynaptic marker syt1HA (anti-HA, magenta) near ECs (anti-GFP, green). Images are representative of 3 independent experiments with similar results. scale bar: 10μm. Phalloidin: muscle (blue). DAPI: nuclei (blue or white); n.s.: non-significant. Data are presented as mean values ± SEM.
Ext. Data Fig.7 ∣
Ext. Data Fig.7 ∣. Egr-ARCENs signaling promotes recovery.
a-b, Pros, upd3, vn, egr expression levels from control (R49E06TS>+) guts and guts after knocking down ChAT in R49E06-neurons (R49E06TS>ChATRNAi). Conditions like Fig. 1e. a: n=3 biologically independent samples. b: n=4 biologically independent samples. Normalized to R49E06TS>+. Statistics: (a) two-tailed t-test, (b) Sidak’s two-way Anova: p=0.0038 (upd3), p=0.0412 (vn), p=0.0298(egr). c, pH3+ counts from R49E06TS>+ (control), R49E06TS>ChATRNAi flies and flies co-expressing the VNC repressor (R49E06TS>ChATRNAi/Tsh-Gal80). n= 21 (control), n=24 (R49E06TS>ChATRNAi, R49E06TS>ChATRNAi/Tsh-Gal80) guts examined over 3 independent experiments. Statistics: Dunn’s Kruskal-Wallis test: p=0.0004. Conditions like Fig. 1e. d, pH3+ counts from R49E06TS>+ and R49E06TS>ChATRNAi flies after oral Ecc15 infection or 5% sucrose feeding (like Ext. Data Fig.2g). n=27 (R49E06TS>+ per condition), n=24 (R49E06TS>ChATRNAi, sucrose), n=32 (R49E06TS>ChATRNAi, Ecc15) guts examined over 3 independent experiments. Statistics: Dunn’s Kruskal-Wallis test: p=0.013. e, Experimental schematic and pH3+ counts, from control (ARCENs>+) files, flies with 6hrs thermo-activation of ARCENs with theTrpA1 channel (ARCENs>TrpA1) and when cholinergic neurons are inhibited (ARCENs>TrpA1/ChAT-Gal80). n=28 (control), n=29 (ARCENs>TrpA1), n=12 (ARCENs>TrpA1/ChAT-Gal80) guts examined over 2 independent experiments. Dunn’s Kruskal-Wallis test: p= 0.0005(control vs TrpA1), p= 0.0069 (TrpA1 vs TrpA1/ChAT-Gal80). f, upd3, vn, egr expression levels from ARCENs>+ (control) and ARCENs>TrpA1 guts. Conditions like Ext. Data Fig.7e. n=3 biologically independent samples per genotype. Normalized to ARCENs>+. Sidak’s two-way Anova: p=0.0114 (upd3), p=0.0109 (vn), p=0.0461(egr). g, Validation of R49E06QF. a’: gut (scale bar: 200μm), b’: posterior VNC (scale bar 50μm). Images are representative of 2 independent experiments with similar results. h, pH3+ counts from control (ARCENsTS>+) flies, flies with TNF receptor wgn reduced in ARECNs (ARCENsTS>wgnRNAi-2) and flies co-expressing the VNC repressor (ARCENsTS>wgnRNAi-2/Tsh-Gal80). Conditions like Fig.1e. n=21 (control), n=22 (ARCENsTS>wgnRNAi-2), n=25(ARCENsTS>wgnRNAi-2/Tsh-Gal80) guts examined over 3 independent experiments. Dunn’s Kruskal-Wallis: p=0.0004(control vs wgnRNAi-2), p=0.0105(wgnRNAi-2 vs wgnRNAi-2 /Tsh-Gal80). i, pH3+ from control (LucRNAi) and flies with egr reduced (egrRNAi) in PCs (esgTS>), ECs (mexTS>) and hemocytes (hmlTS>). Conditions like Fig.1e. esgTS: n=13 (control), n=14 (egrRNAi) guts examined over 2 independent experiments (two-tailed Mann-Whitney test). mexTS: n=12 (control), n=13 (egrRNAi) guts examined over 2 independent experiments (two-tailed Mann-Whitney test). hmlTS: n=14 (control), n=13 (egrRNAi) guts examined over 2 independent experiments (two-tailed Mann-Whitney test, p=0.028). esg+mexTS: n=14 guts per genotype examined over 2 independent experiments (two-tailed Mann-Whitney test). mex+hmlTS: n=16 (control), n=13 (egrRNAi) guts examined over 2 independent experiments (two-tailed t-test). esg+hmlTS: n=21 (control), n=19 (egrRNAi) guts examined over 3 independent experiments (two-tailed Mann-Whitney test). esg+mex+hmlTS: n=16 (control), n=19 (egrRNAi) guts examined over 3 independent experiments (two-tailed Mann-Whitney test). j, pH3+ counts from esg+hml+mexTS>LucRNAi (control) and esg+hml+mexTS>egrRNAi flies. Conditions like Fig.1e. control: n=23 (Hom.), n=22 (Injury), n=40 (Rec.) guts; egrRNAi: n=24 (Hom.), n=22 (Injury), n=39 (Rec.) guts examined over 3 independent experiments. Statistics: Sidak’s two-way Anova. k, a’: Schematic of Egr-GFP bound to extracellular morphotrap (VHHaGFP). b’-d’: Images from the abdomen (b’,d’) and thorax (c’) of flies expressing the morhotrap in ARCENs while expressing Egr-GFP (ARCENsTS>morphotrap/Egr-GFP) and of control flies without the morphotrap (ARCENsTS>Cherry/Egr-GFP). white dotted lines: ARCEN projections. red lines: midgut (b’,d’: posterior, c’: anterior). Sectioning like Fig.4a. anti-DsRed: Morphotrap and Cherry (magenta). Anti-GFP: Egr (green), Phalloidin: muscle (blue), DAPI: nuclei (blue). Images are representative of 2 independent experiments with similar results. scale bar 50μm. n.s.: non-significant ,*: 0.05>p>0.01, **: 0.01<p<0.001, ***: p<0.001. Data are presented as mean values ± SEM.
Ext. Data Fig.8 ∣
Ext. Data Fig.8 ∣. Ca2+ spreads in ECs via gap junctions.
a, Gut image with a subpopulation of ECs (spECs) expressing GFP (spECs > 6xGFP) that are located in R4c (between R4 and R5). anti-GFP: green. Red dotted square: area imaged in Ext. Data Fig.8b. scale bar 100μm. Image is representative of 2 independent experiments with similar results. b, a’: Posterior midgut images of flies expressing CsChrimson in spECs (spEC>CsChrimson, yellow) while expressing GCAMP7c in all ECs (mexLexA >LexAopGCAMP7c, grey). b’: Color-coded sequential frames from spEC>CsChrimson+mexLexA > LexAopGCaMP7c gut prior (t30) and during (t60) CsChrimson-activation. Lower panels: Heptanol addition (gap junction blocker). c’: Fluorescence intensity (ΔF/F0) of neighboring ECs (non-expressing CsChrimson) per frame (~3 sec/frame) per condition. Upper graph: average ΔF/F0 per condition. Lower graph: individual ΔF/F0 per gut. n=10 (Neighboring ECs), n=9 (Neighboring ECs+Heptanol) guts examined over 3 independent experiments. Statistics: two-way Anova. yellow dots: CsChrimson-expressing ECs (spECs). scale bar 20μm. c, Mean expression of each Innexin (gap junction components) in all snRNAseq EC clusters per condition (n= 4547 nuclei in EC clusters). Boxplot: median, 1st and 3rd quartile, whiskers: minimum maximum values. d, Graph depicting Inx2 and Inx7 mean expression per snRNAseq gut cluster and condition (n=7411 gut nuclei). e, Graph depicting the percentage of nuclei expressing Inx7 and Inx2 per snRNAseq gut cluster and condition (n=7411 gut nuclei). f, Posterior midgut expressing GFP in ECs (mex>2xGFP). anti-GFP: green, anti-Inx2: magenta. scale bar 20μm. Image is representative of 2 independent experiments with similar results. g, Posterior midgut of control (mexTS>+), and when conditionally knocking down Inx2 and Inx7 in ECs (mexTS>Inx2RNAi and mexTS>Inx7RNAi). Conditions: 2 days standard food (29°C). anti-Inx2: grey. Images are representative of 2 independent experiments with similar results. scale bar 20μm. h, Validation of Inx7 RNAi. n=3 biologically independent samples per genotype. Statistics: two-tailed t-test (p=0.0188). i, pH3+ counts from spECs>CsChrimson and spECs>CsChrimson+ Inx2RNAi flies without or with 7hr opto-activation (red square) during Recovery d1. No light: n=17(spECs>CsChrimson), n=18 (spECs>CsChrimson+ Inx2RNAi) guts; Red light: n=18(spECs>CsChrimson), n=22 (spECs>CsChrimson+ Inx2RNAi) guts, examined over 3 independent experiments (Tukey’s two-way Anova). j, Posterior midgut images from mexTS>+, mexTS>nAcRβ3, mexTS>Inx2RNAi and mexTS> nAcRβ3+Inx2RNAi flies. scale bar 20μm. Conditions like Fig.5f. anti-pdm1: ECs (grey). Accompanying boxplot: pdm1+ ratio (median, 1st and 3rd quartile, whiskers: minimum maximum values). n=7 (mexTS>nAcRβ3), n=6 ( mexTS>+, mexTS>Inx2RNAi, mexTS> nAcRβ3+Inx2RNAi ) guts, examined over 2 independent experiments. Tukey’s two-way Anova: p=0.0392 (mexTS>+ vs mexTS>nAcRβ3), p=0.0307 (mexTS>+ vs mexTS>Inx2RNAi), p=0.0003 (mexTS>nAcRβ3 vs mexTS> nAcRβ3+Inx2RNAi). k, Relative fluorescence intensity (ΔF/F0) per frame (3 seconds per frame) per genotype and per condition of individual guts as described in Fig.5g. n= 6(Hom.), n=9(Rec.),n=8(Inx2RNAi) guts examined over 2 independent experiments. DAPI: blue (nuclei). *: 0.05>p>0.01, **: 0.01<p<0.001, ***: p<0.001. Data are presented as mean values ± SEM.
Ext. Data Fig.9 ∣
Ext. Data Fig.9 ∣. ARCENs trigger nAchRβ3-mediated Ca2+ currents in ECs to promote intestinal epithelial recovery after injury.
Model: During recovery, ECs become sensitive (Ace reduction) and receptive (nAChRβ3 increase) to ACh while ARCEN-innervations strengthen their Syt1+ boutons in an Egr-dependent manner. Cholinergic signaling from ARCENs to ECs triggers nAChR-mediated Ca2+ currents that propagate across more ECs via Inx2/Inx7 gap junctions to advance EC maturation, ion balance and transition to homeostasis. Illustration generated with BioRender.com
Fig.1 ∣
Fig.1 ∣. ACh sensitivity is required for recovery.
a, Experimental design illustration. Midgut of OreR flies with cell death marker anti-Dcp1 (Drosophila caspase 1, magenta) and DAPI (nuclei, blue). Conditions like 1a at 29°C. Images are representative of two independent experiments with similar results. scale bar: 50μm. c, Mitotic division counts of proliferating ISCs in the midgut of Ore R flies with anti-PhoshoHistone-3 (pH3) staining (conditions like Fig.1b). n=29 xDunn’s Kruskal-Wallis test : p=0.02 (Rec. d2 vs Rec. d4). Black dots indicate counts per gut. d, Expression levels of Ace in Ore R guts. Normalized to Homeostasis. n=3 biologically independent samples per condition (two-tailed t-test, p=0.0011). e-f, Experimental design and graphs of pH3+ counts from control (myo1ATS>dCas9VPR) and flies with Ace conditionally overexpressed in ECs (myo1ATS>dCas9VPR, gRNA-Ace). Conditional perturbations with temperature-sensitive Gal4 inhibitor, Tubulin-Gal80TS(TS), allow Gal4 expression only >27°C. control: n=18(Homeostasis),19(Injury), 20(Recovery), 15(Homeostasis d12), 16(Injury 2x), 18(Recovery 2x) guts ; gRNA-Ace: n=17(Homeostasis), 18(Injury), 20(Recovery),14(Homeostasis d12),19(Injury 2x), 20(Recovery 2x) guts, from 3 independent experiments. Sidak’s and Tukey’s two-way Anova. g, Assay illustration and color-coded sequential frames of midgut before (t25) and after (t250) ACh administration of flies conditionally expressing the Ca2+ reporter GCAMP7c with the EC-driver mex1-Gal4 (mexTS >GCaMP7c) and flies overexpressing Ace (mexTS >GCaMP7c+dCas9VPR,gRNA-Ace, Videos S1-S3). Recovery: 2 days in standard food (29°C) after 4 days of DSS-feeding (23°C). Homeostasis: conditions like Recovery without DSS-feeding. Accompanying graph: average relative fluorescence intensity (ΔF/F0) per frame (5 sec/frame) and genotype. n=7 (Homeostasis), n=7 (Recovery d2), n=5 (Recovery d2, mexTS> gRNA-Ace) guts, from 3 independent experiments. Tukey’s two-way Anova. Individual ΔF/F0 shown on Ext. Data Fig.2i. scale bar: 50μm *: 0.05>p>0.01, **: 0.01<p<0.001, ***: p<0.001, ns: non-significant. Data are presented as mean values ± SEM. Illustrations with Biorender.com
Fig.2 ∣
Fig.2 ∣. nAChRβ3 is required in ECs for recovery.
a, pH3+ counts from midgut of control (myo1ATS > +) and flies with nAChRβ3 conditionally reduced in ECs (myo1ATS> nAChRβ3RNAi). control: n=13 (Homeostasis), n=12(Injury), n=18(Recovery) guts, myo1ATS>nAChRβ3RNAi: n=13 (Homeostasis), n=12(Injury), n=20 (Recovery) guts, from 2 independent experiments. Sidak’s and Tukey’s two-way Anova. Like Fig. 1e. b, pH3+ counts from midgut of control (mexTS > +) and flies with nAChRβ3 conditionally reduced in ECs (mexTS>nAChRβ3RNAi). control: n=12 (Homeostasis), n=11(Injury), n=18(Recovery), n=20(Homeostasis d12), n=15(Injury 2x), n=29 (Recovery 2x); mexTS>nAChRβ3RNAi: n=12 (Homeostasis), n=11 (Injury), n=17 (Recovery), n=20 (Homeostasis d12), n=15 (Injury 2x), n=26(Recovery 2x), from 3 independent experiments. Sidak’s and Tukey’s two-way Anova. Like Fig. 1e-f. c, Confocal gut images of mexTS>+ and mexTS>nAChRβ3RNAi flies co-expressing the PC marker esg-GFP (green, anti-GFP, like Fig. 2b). scale bar: 100μm. Images are representative of 2 independent experiments with similar results. d, Illustration of nAChRβ3-flag and confocal images of midgut expressing nAChRβ3-flag and GFP-expressing ECs (mex >GFP). anti-Flag: nAChRβ3-flag (yellow), anti-GFP: ECs (green). scale bar: 10μm. Images are representative of 3 independent experiments with similar results. Like Fig. 1e. e, Illustration followed by images of expanded midguts from flies expressing nAChRβ3-flag (yellow) and GFP-expressing ECs (myo1A >GFP, green). scale bar: 50μm. Images are representative of 2 independent experiments with similar results. f-g, Illustration and color-coded sequential frames of midgut before (t20) and after (t200) nicotine administration of mexTS > GCaMP7c and mexTS > GCaMP7c+nAChRβ3RNAi flies (Videos S4-S6). Bottom graph: average relative fluorescence intensity (ΔF/F0) per frame (5 sec/frame) per condition and genotype. n=7(Homeostasis),n=7(Recovery d2),n=5 (Recovery d2, mexTS>Ace) guts from 2 independent experiments. Tukey’s two-way Anova (Rec d2 vs Rec d2+nAChRβ3RNAi, p=0.0116). Like Fig 1g. scale bar: 50μm. Individual ΔF/F0 on Ext. Data Fig.3k. DAPI: nuclei. *: 0.05>p>0.01, **: 0.01<p<0.001, ***: p<0.001. Mean ± SEM. Illustrations with Biorender.com
Fig.3 ∣
Fig.3 ∣. nAChRβ3-mediated Ca2+ promotes recovery.
a, Cytokine expression levels when reducing nAChRβ3 in ECs (myo1ATS>nAChRβ3RNAi). Like Fig. 1e. upd(unpaired), vn(vein), spi(spitz), krn(keren), wg(wingless), dpp(decapentaplegic), gbb(glass bottom boat), hh(hedgehog). n=3 biologically independent samples per genotype. Sidak’s two-way Anova; p=0.0196(vn), p=0.0022 (egr). b, Pdm1 levels when reducing nAChRβ3 in ECs (mexTS>nAChRβ3RNAi and myo1ATS>nAChRβRNAi). Like Fig. 1e. n=3 biologically independent samples per genotype and condition. Sidak’s two-way Anova; p=0.0014 (Rec.d4, myo1ATS>+ vs myo1ATS>nAChRβ3RNAi), p=0.0142 (Rec.d4, mexTS>+ vs mexTS>nAChRβ3RNAi). c, Posterior midgut with Ca2+ reporter in ECs (myo1ATS>NFAT-CaLexA). Reporter expression: 2days (29°C) per condition. GFP: green(Ca2+). Graph: GFP per image and condition. n=25(Homeostasis), n=24(Injury),n=18(Rec.d1), n=8(Rec.d3) guts from 3 independent experiments (Dunn’s Kruskal-Wallis test). d, Posterior midgut with NFAT-CaLexA in control (mexTS>NFAT-CaLexA) and when reducing nAChRβ3 in ECs (mexTS>NFAT-CaLexA+nAChRβ3RNAi). Conditions: 4days DSS-food (23°C) and standard food for 24hrs (29°C). n=7(control), n=9(nAChRβ3RNAi) guts from 2 independent experiments (two-tailed t-test). e, pH3+ counts from Orai (Ca2+ channel) overexpression (myo1ATS>Orai), nAChRβ3 reduction (myo1ATS>nAChRβ3RNAi-2) and combined (myo1ATS>nAChRβ3RNAi+Orai) in ECs. Like Fig 1e. n=20(control), n=22(Orai), n=18(nAChRβ3RNAi2), n=16(nAChRβ3RNAi +Orai) guts, from 3 independent experiments (Dunn’s Kruskal-Wallis test). f, Posterior midgut stained with anti-pdm1(grey), like Fig. 3e. Boxplot: pdm1+ versus all nuclei per image (median, quartiles, whiskers: minimum maximum values). N=7 guts per genotype (Tukey’s one-way Anova, Orai vs nAChRβ3RNAi + Orai: p=0.0092), from 2 independent experiments. g, Experimental design and pH3+ counts when nAChRβ3 is overexpressed in ECs (mexTS>nAChRβ3). control: n=12(Hom.), n=15(Injury), n=21(Rec.d2) guts, mexTS>nAChRβ3: n=8(Hom.), n=13(Injury), n=18(Rec.d2) guts from 2 independent experiments. Two-way Anova: p=0.023 (Rec. d2: control vs mexTS>nAChRβ3), p=0.0396 (control: Hom. vs Rec.d2). h-i, Pdm1 and cytokine levels from myo1ATS>nAChRβ3 flies. Like Fig. 3g. n=3 biologically independent samples per genotype. Sidak’s two-way Anova (pdm1/Rec.d2: p=0.0415, upd2: p=0.0326, upd3: p=0.0014, egr: p=0.0037). DAPI: nuclei. scale bars: 20μm. *: 0.05>p>0.01, **: 0.01<p<0.001, ***: p<0.001. n.s.: non-significant. Mean ± SEM.
Fig.4 ∣
Fig.4 ∣. ARCEN-EC interactions promote recovery.
a, Vibratome-sectioning of R49E06TS>myrGFP+syt1HA flies (Rec.d2). a’-b’: sectioned thorax/abdomen (square). white dots: midgut. White arrow: R49E06-projection. c’: innervated R2, R4, R5. anti-GFP: R49E06-innervations(green), anti-HA: presynaptic syt1HA(magenta). Red arrow: R49E06-enteric innervations. Images b’-c’ are representative of 2 independent experiments with similar results. scale bar: 100μm(b’), 20μm(c’). b, Sequential R4 images (Video S7) from R49E06TS>syt1HA+mexLexA>6xLexAopGFP flies (Rec.d2). Arrows: anti-HA(magenta), anti-GFP: ECs(green). scale bar: 10μm. Images are representative of 2 independent experiments with similar results. c, +pH3 counts when ChAT (Choline Acetyltransferase) is reduced in R49E06-neurons (R49E06TS>ChATRNAi). Control: n=10(Hom.), n=10(Injury), n=16(Rec.d4), n=13(Hom.d12), n=14 (Injury 2x),n=13(Rec.2x) guts; R49E06TS>ChATRNAi: n= 10(Hom.), n=10(Injury), n=20(Rec.d4),n=11(Hom.d12),n=13(Injury 2x),n=12(Rec.2x) guts, from 2 independent experiments (Sidak’s two-way Anova). Like Fig.1e-f. d, Pdm1 expression levels. n=3 biologically independent samples. Sidak’s two-way Anova(p=0.0027). e, +pH3 counts when overexpressing nAcRβ3 in ECs (mexLexATS>lexAop-nAcRβ3) and thermo-silencing (>27°C) R49E06/ARCENs with shibireTS (ARCENs>shibireTS). Conditions: 4days DSS-food (23°C), 24hrs standard food (29°C). n=22(control), n=20(ARCENs>shibireTS), n=24(mexLexATS>lexAop-nAcRβ3), n=19(ARCENs>shibireTS+mexLexATS>lexAop-nAcRβ3) guts from 3 independent experiments. Dunn’s Kruskal-Wallis test: p=0.0029(control vs shibireTS), p=0.0024(shibireTS+lexAop-nAcRβ3 vs shibireTS). f, Thermo- and optogenetic induction with NFAT-CalexA expressed in ECs (mexTS>NFAT-CaLexA/QUAS-CsChrimson) after depolarizing ARCENs with CsChrimson (mexTS>NFAT-CaLexA/ARCENsQF>QUAS-CsChrimson). anti-GFP: Ca2+(green), anti-pdm1: ECs(magenta). Chart: GFP fold change, Boxplot: pdm1+ ratio (median, quartiles, whiskers: minimum maximum values). n=8(control), n=7(CsChrimson) guts from two independent experiments, two-tailed Mann-Whitney test (p=0.0205/GFP). scale bar: 50μm. g, pH3+ counts after reducing TNF receptors in ARCENs (wgn/wengen, ARCENsTS>wgnRNAi ; grnd/grindelwald, ARCENsTS>grndRNAi). control: n=12(Hom.), n=10(Injury), n=21(Rec.); wgnRNAi: n=12(Hom.), n=10(Injury), n=25(Rec.); grndRNAi: n=14(Hom.), n=10(Injury), n=19(Rec.) guts from 2 independent experiments. Dunn’s Kruskal-Wallis test: p=0.0185(wgnRNAi vs grndRNAi; Rec). h, R5 of ARCENs>mCD8GFP and ARCENs>mCD8GFP+wgnRNAi guts. anti-GFP: ARCENs-innervations(green), anti-Syt1: boutons(magenta). n=8(Hom.), n=11(Rec.), n=6(wgnRNAi) guts, from 2 independent experiments. Tukey’s one-way Anova (p=0.0019, Rec. vs wgnRNAi; boutons). scale bar: 10μm. Phalloidin: muscle. DAPI: nuclei. *: 0.05>p>0.01, **:0.01<p<0.001, ***:p<0.001. n.s.: non-significant. Mean ± SEM. Illustrations with Biorender.com
Fig.5 ∣
Fig.5 ∣. Ca2+ spreads via Inx2/Inx7 gap junctions.
a, a’: Experimental Illustration. b’: Posterior midgut with CsChrimson in few ECs (spECs, spEC>CsChrimson, yellow) while all ECs express GCAMP7c (mexLexA>LexAopGCAMP7c, grey). Neighboring ECs: no CsChrimson expression. c’: Color-coded sequential frames prior (t30) and during (t60) CsChrimson-activation (Video S8). Images are representative of 3 independent experiments with similar results. Quantifications: Ext. Data Fig.8b. scale bar: 100μm. b, pH3+ counts of spEC>CsChrimson during 7hr opto-activation. No activation: n=17(Hom.), 20(Rec.) ; Activation: n=16(Hom.), n=21(Rec.) guts from 3 independent experiments (two-tailed Mann-Whitney). Conditions: see Methods. c-d, pH3+ counts when reducing Inx2 (mexTS>Inx2RNAi) and Inx7 (mexTS>Inx7RNAi) in ECs. Conditions: Fig. 1e. control: n=13(Hom./c), n=23(Hom./d), n=11(Injury/c), n=22(Injury/d), n=13(Rec./c), n=16(Rec./d); Inx2RNAi: n=13(Hom.), n=10(Injury), n=10(Rec); Inx7RNAi: n=17(Hom.), n=20(Injury), n=15(Rec.) guts from 2 independent experiments (two-way Anova). e, Posterior midgut expressing NFAT-CaLexA in ECs while reducing Inx2 or Inx7 (mexTS>NFAT-CaLexA+Inx2RNAi, mexTS>NFAT-CaLexA+Inx7RNAi). anti-GFP: Ca2+(green), anti-pdm1: ECs(grey). DAPI: nuclei. Scalebar 20μm. Conditions: 4days DSS-food (23°C), 24hrs standard food (29°C). Chart: GFP fold change, Boxplot: pdm1+ ratio (median, quartiles, whiskers: minimum maximum values). n=8 guts per genotype from 2 independent experiments. Tukey’s one-way Anova (p=0.0272; control vs Inx2RNAi; GFP). Dunn’s Kruskal-Wallis test (p=0.024 control vs Inx2RNAi;pdm1+), f, pH3+ counts when overexpressing nAcRβ3 (mexTS>nAcRβ3), reducing Inx2 in ECs (mexTS>Inx2RNAi) and combined (mexTS>nAcRβ3+Inx2RNAi). Conditions: 4days DSS-food (23°C), 48hrs standard food (29°C). n=10(mexTS>+), n=12(mexTS>nAcRβ3, mexTS>Inx2RNAi, mexTS>nAcRβ3+Inx2RNAi) guts from 2 independent experiments. Tukey’s one-way Anova (p=0.0476 control vs nAcRβ3, p=0.0096 nAcRβ3 vs Inx2RNAi). g, Color-coded sequential frames while reducing Inx2 in ECs (mexTS >GCaMP7c+Inx2RNAi) before (t27) and after (t147) nicotine (Videos S9-S10). Graph: average fluorescence intensity (ΔF/F0) per frame (~3sec/fr) and genotype. Individual ΔF/F0: Ext. Data Fig.8k. n= 6(Hom.), n=9(Rec.),n=8(Inx2RNAi) guts from 2 independent experiments (Tukey’s two-way Anova). scale bar: 20μm. Conditions: Fig. 2f. n.s.:non-significant, *: 0.05>p>0.01, **: 0.01<p<0.001, ***: p<0.001. Mean ± SEM. Illustrations with Biorender.com

References

    1. Karin M & Clevers H Reparative inflammation takes charge of tissue regeneration. Nature 529, 307–315, doi:10.1038/nature17039 (2016). - DOI - PMC - PubMed
    1. Miguel-Aliaga I, Jasper H & Lemaitre B Anatomy and Physiology of the Digestive Tract of Drosophila melanogaster. Genetics 210, 357–396, doi:10.1534/genetics.118.300224 (2018). - DOI - PMC - PubMed
    1. Wessler I & Kirkpatrick CJ Acetylcholine beyond neurons: the non-neuronal cholinergic system in humans. Br J Pharmacol 154, 1558–1571, doi:10.1038/bjp.2008.185 (2008). - DOI - PMC - PubMed
    1. Wiesner J, Kriz Z, Kuca K, Jun D & Koca J Acetylcholinesterases--the structural similarities and differences. J Enzyme Inhib Med Chem 22, 417–424, doi:10.1080/14756360701421294 (2007). - DOI - PubMed
    1. Igaki T et al. Eiger, a TNF superfamily ligand that triggers the Drosophila JNK pathway. EMBO J 21, 3009–3018, doi:10.1093/emboj/cdf306 (2002). - DOI - PMC - PubMed

Additional References:

    1. Phillips MD & Thomas GH Brush border spectrin is required for early endosome recycling in Drosophila. J Cell Sci 119, 1361–1370, doi:10.1242/jcs.02839 (2006). - DOI - PubMed
    1. Diao F et al. Plug-and-play genetic access to drosophila cell types using exchangeable exon cassettes. Cell Rep 10, 1410–1421, doi:10.1016/j.celrep.2015.01.059 (2015). - DOI - PMC - PubMed
    1. Jenett A et al. A GAL4-driver line resource for Drosophila neurobiology. Cell Rep 2, 991–1001, doi:10.1016/j.celrep.2012.09.011 (2012). - DOI - PMC - PubMed
    1. Ariyapala IS et al. Identification of Split-GAL4 Drivers and Enhancers That Allow Regional Cell Type Manipulations of the Drosophila melanogaster Intestine. Genetics 216, 891–903, doi:10.1534/genetics.120.303625 (2020). - DOI - PMC - PubMed
    1. McGuire SE, Mao Z & Davis RL Spatiotemporal gene expression targeting with the TARGET and gene-switch systems in Drosophila. Sci STKE 2004, pl6, doi:10.1126/stke.2202004pl6 (2004). - DOI - PubMed

Publication types