

Human Neuroimaging Reveals Differences in Activation and Connectivity between Real and Pantomimed Tool Use
- PMID: 37722847
- PMCID: PMC10648550
- DOI: 10.1523/JNEUROSCI.0068-23.2023
Human Neuroimaging Reveals Differences in Activation and Connectivity between Real and Pantomimed Tool Use
Abstract
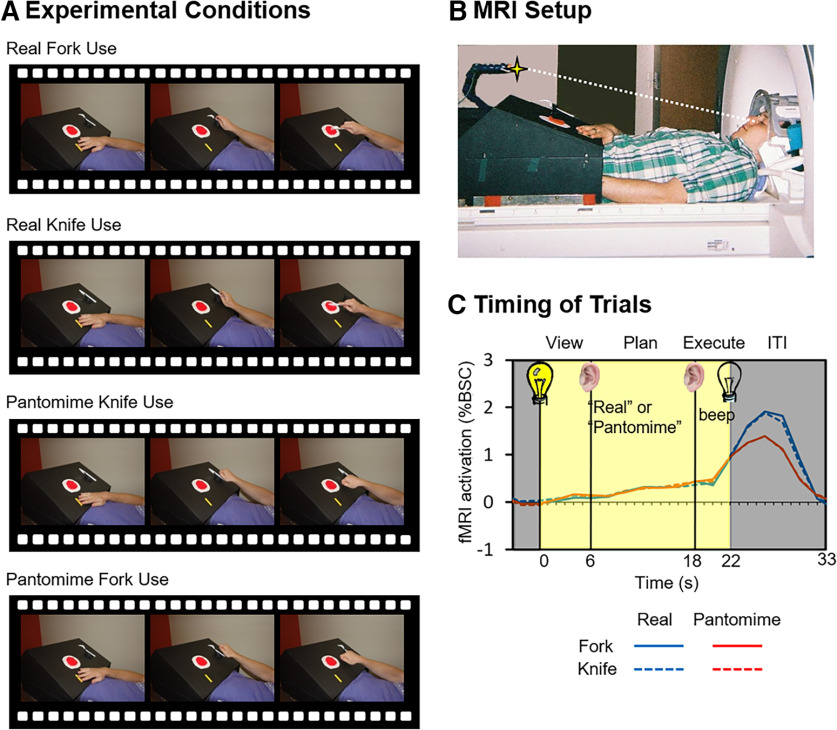
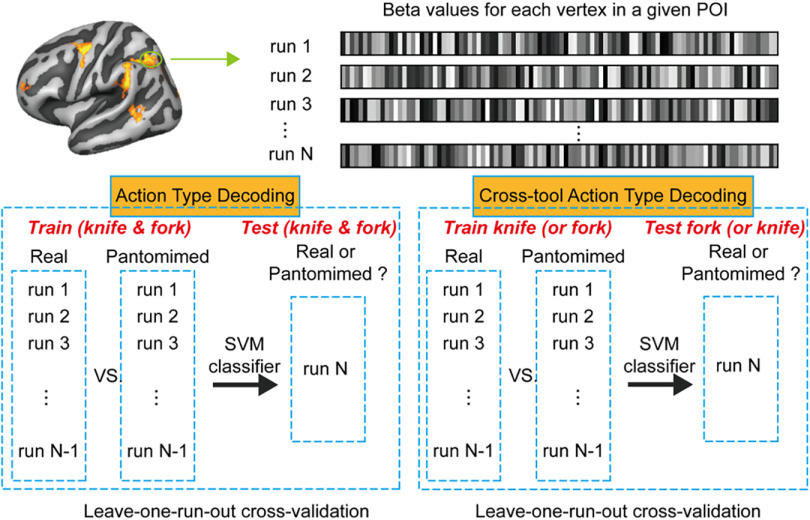
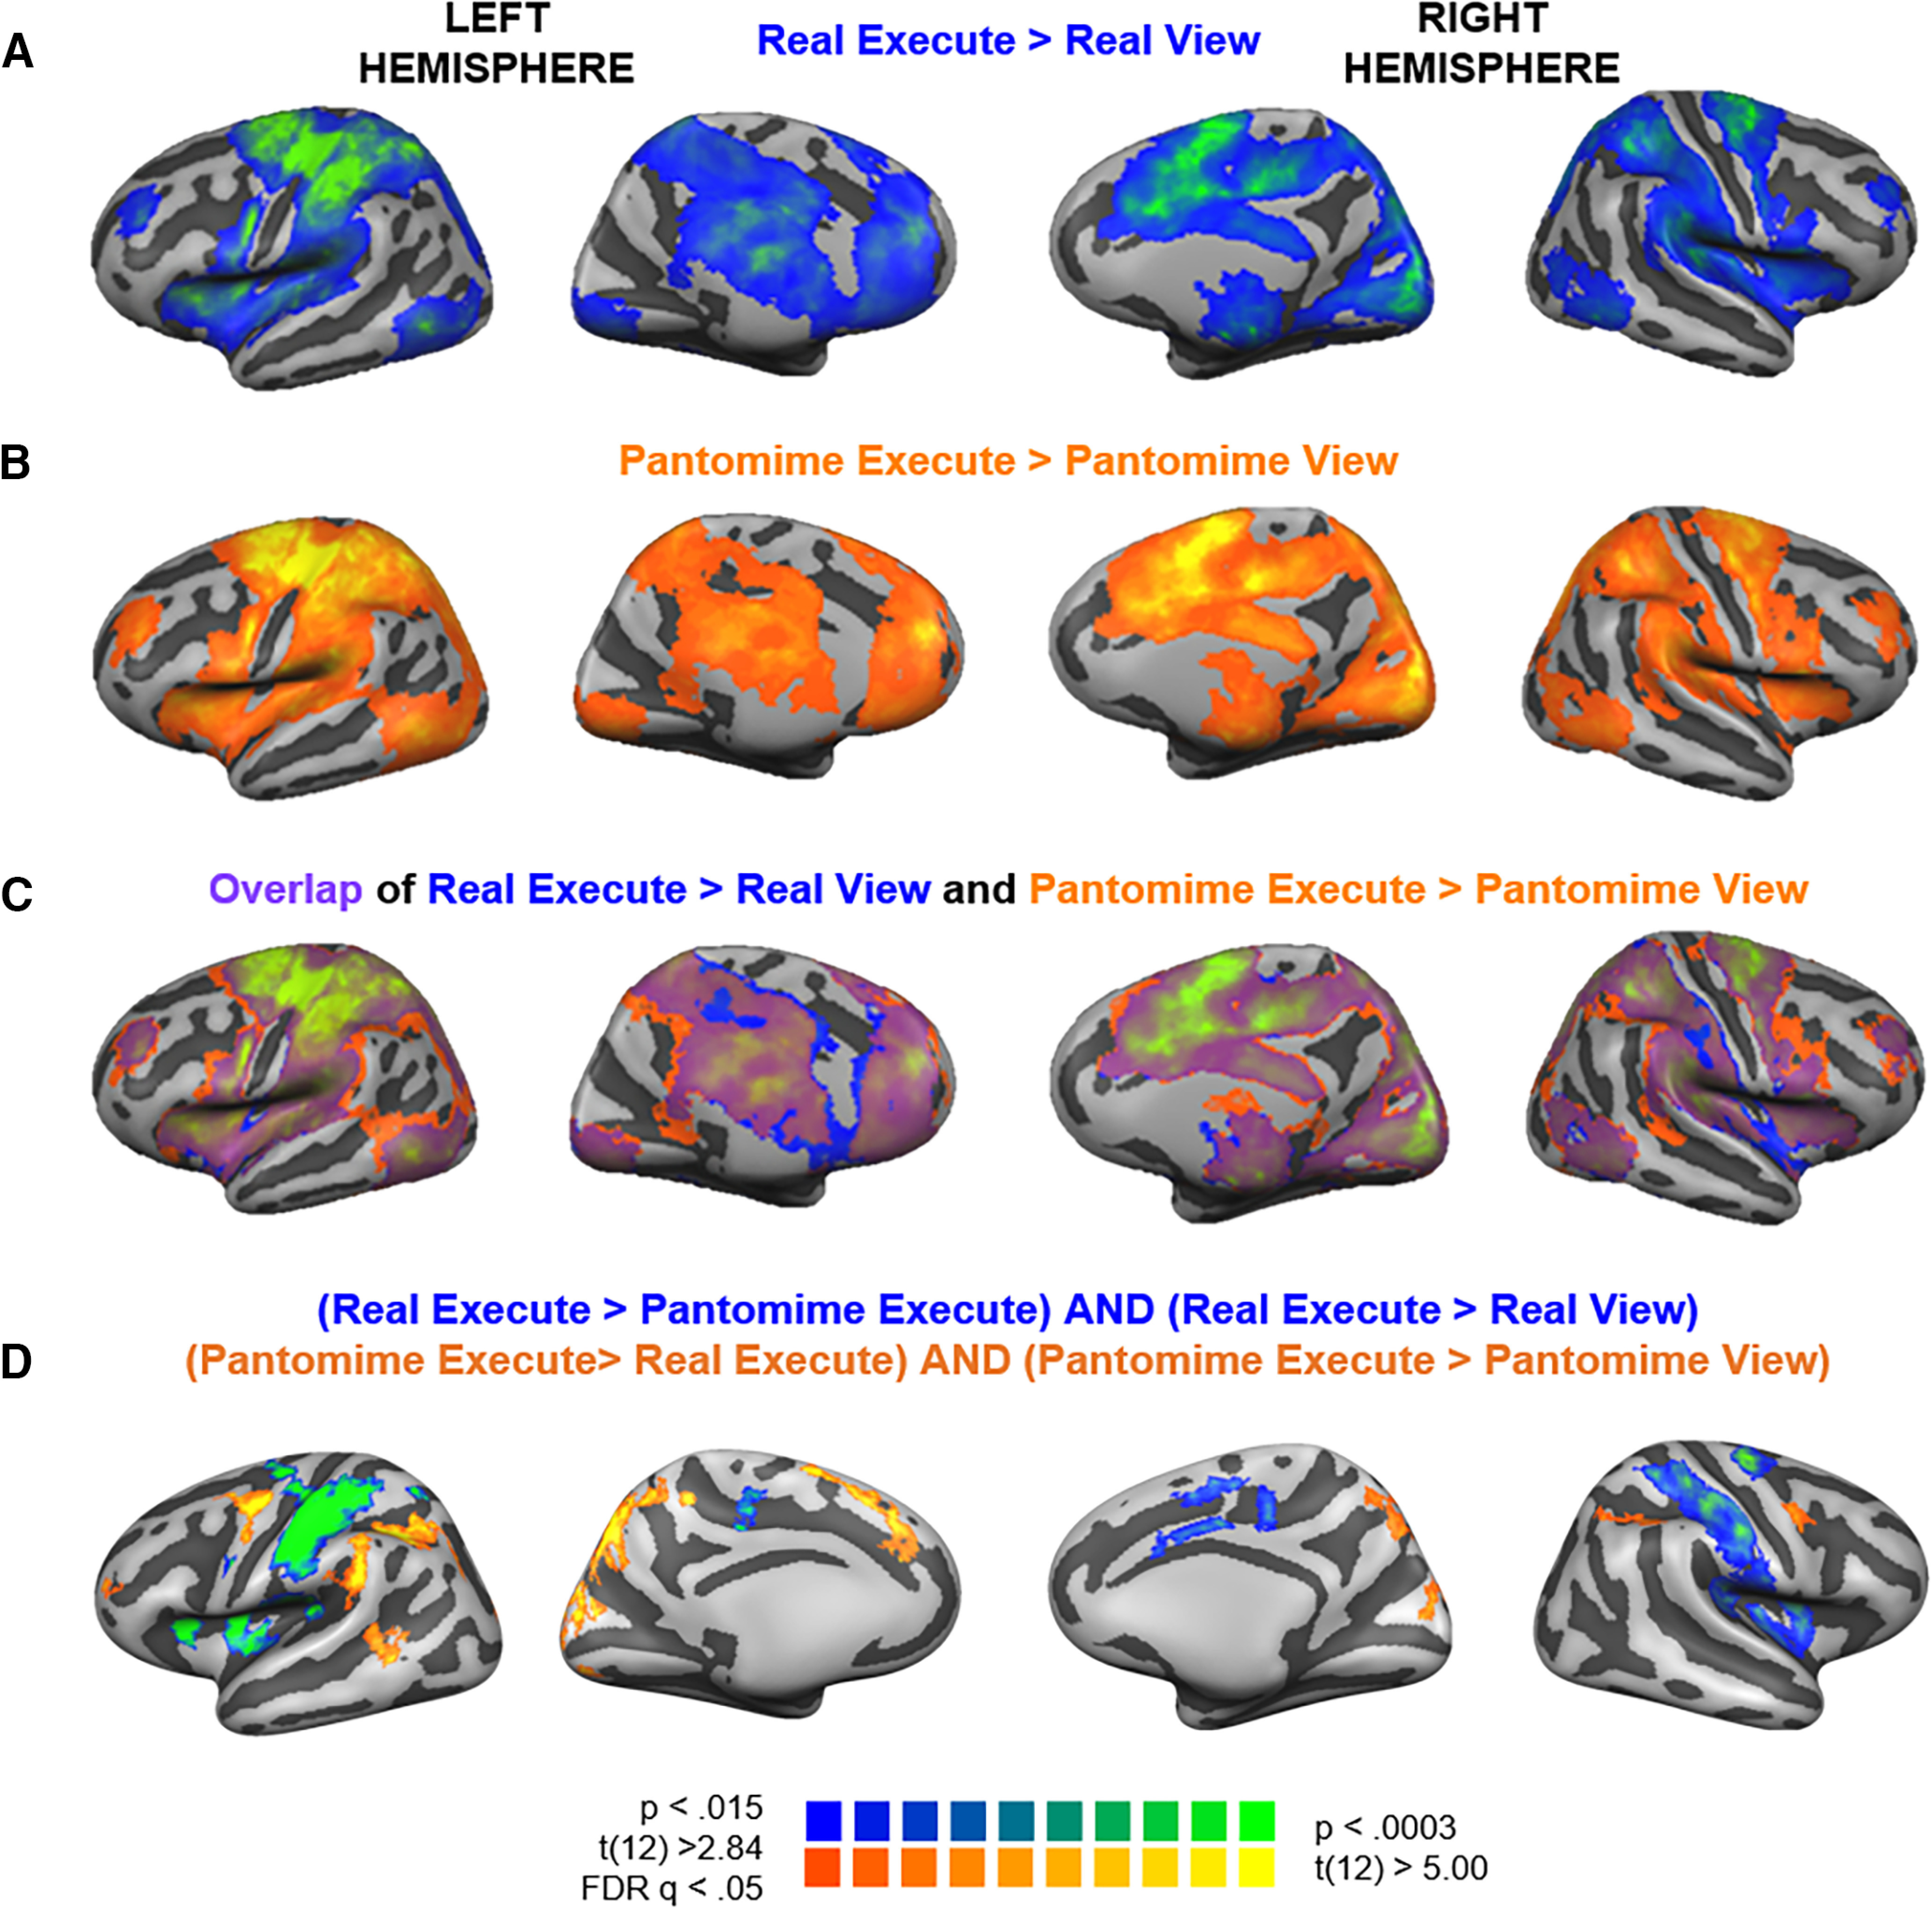
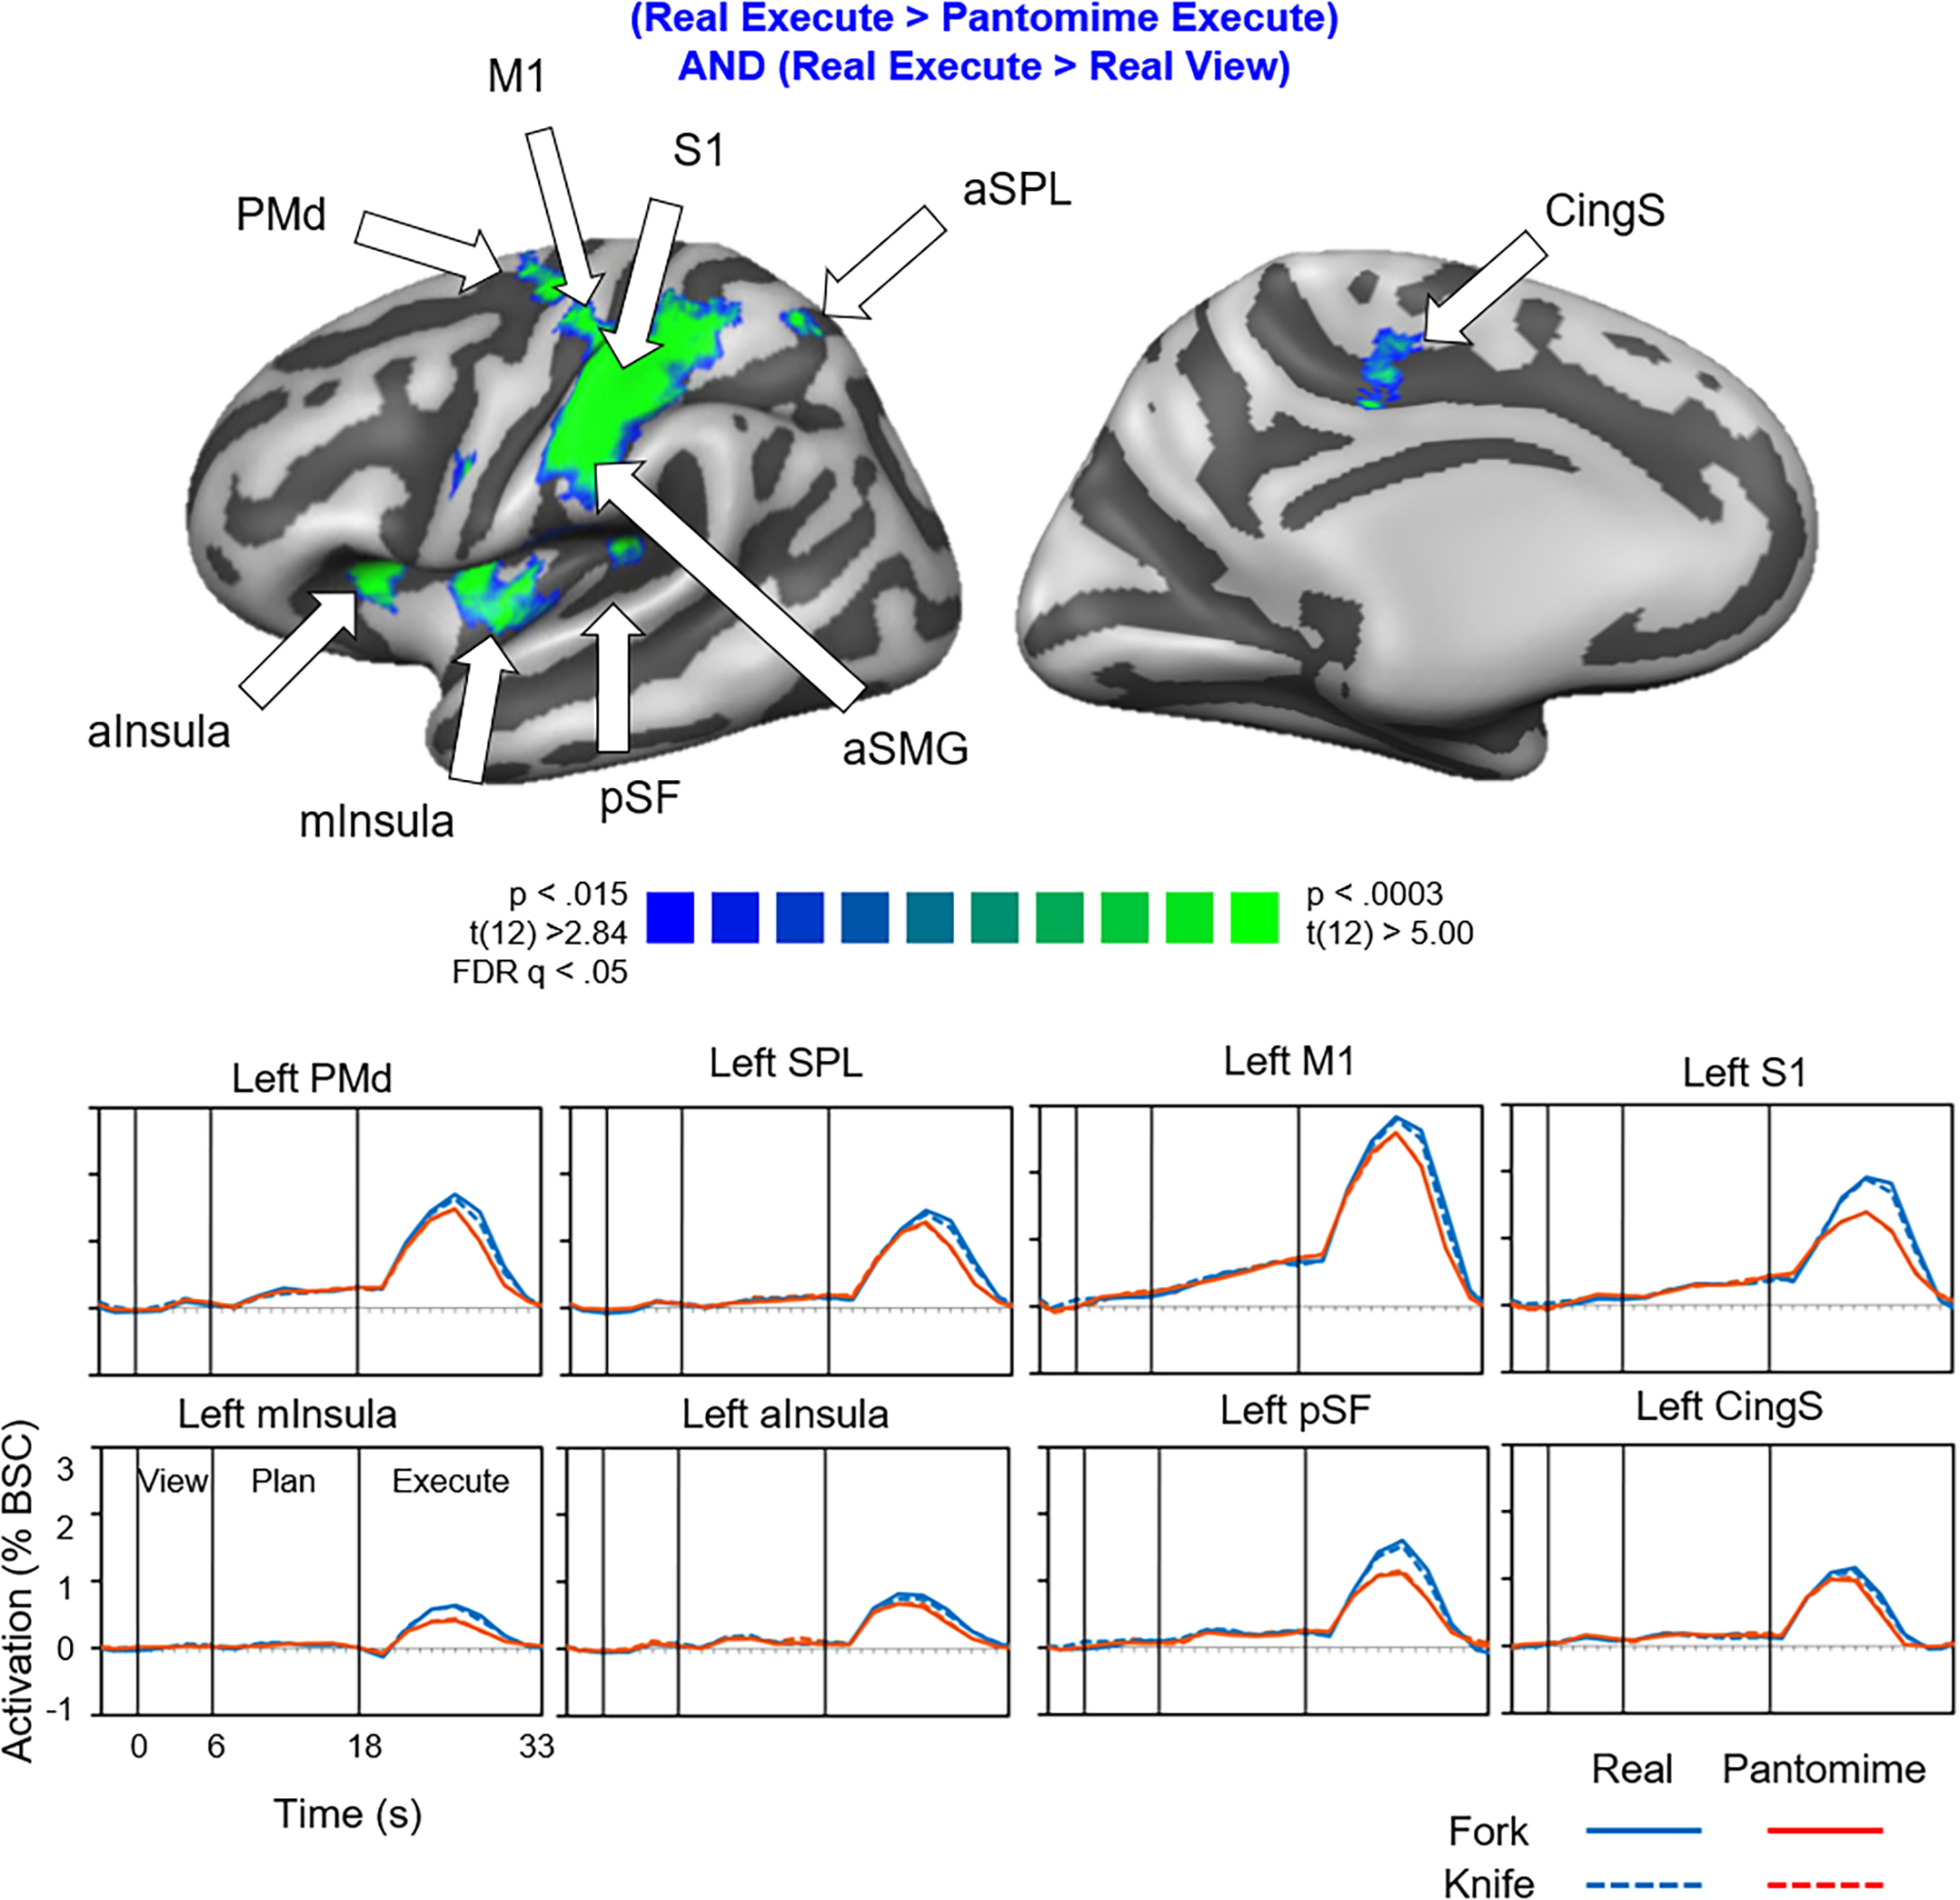
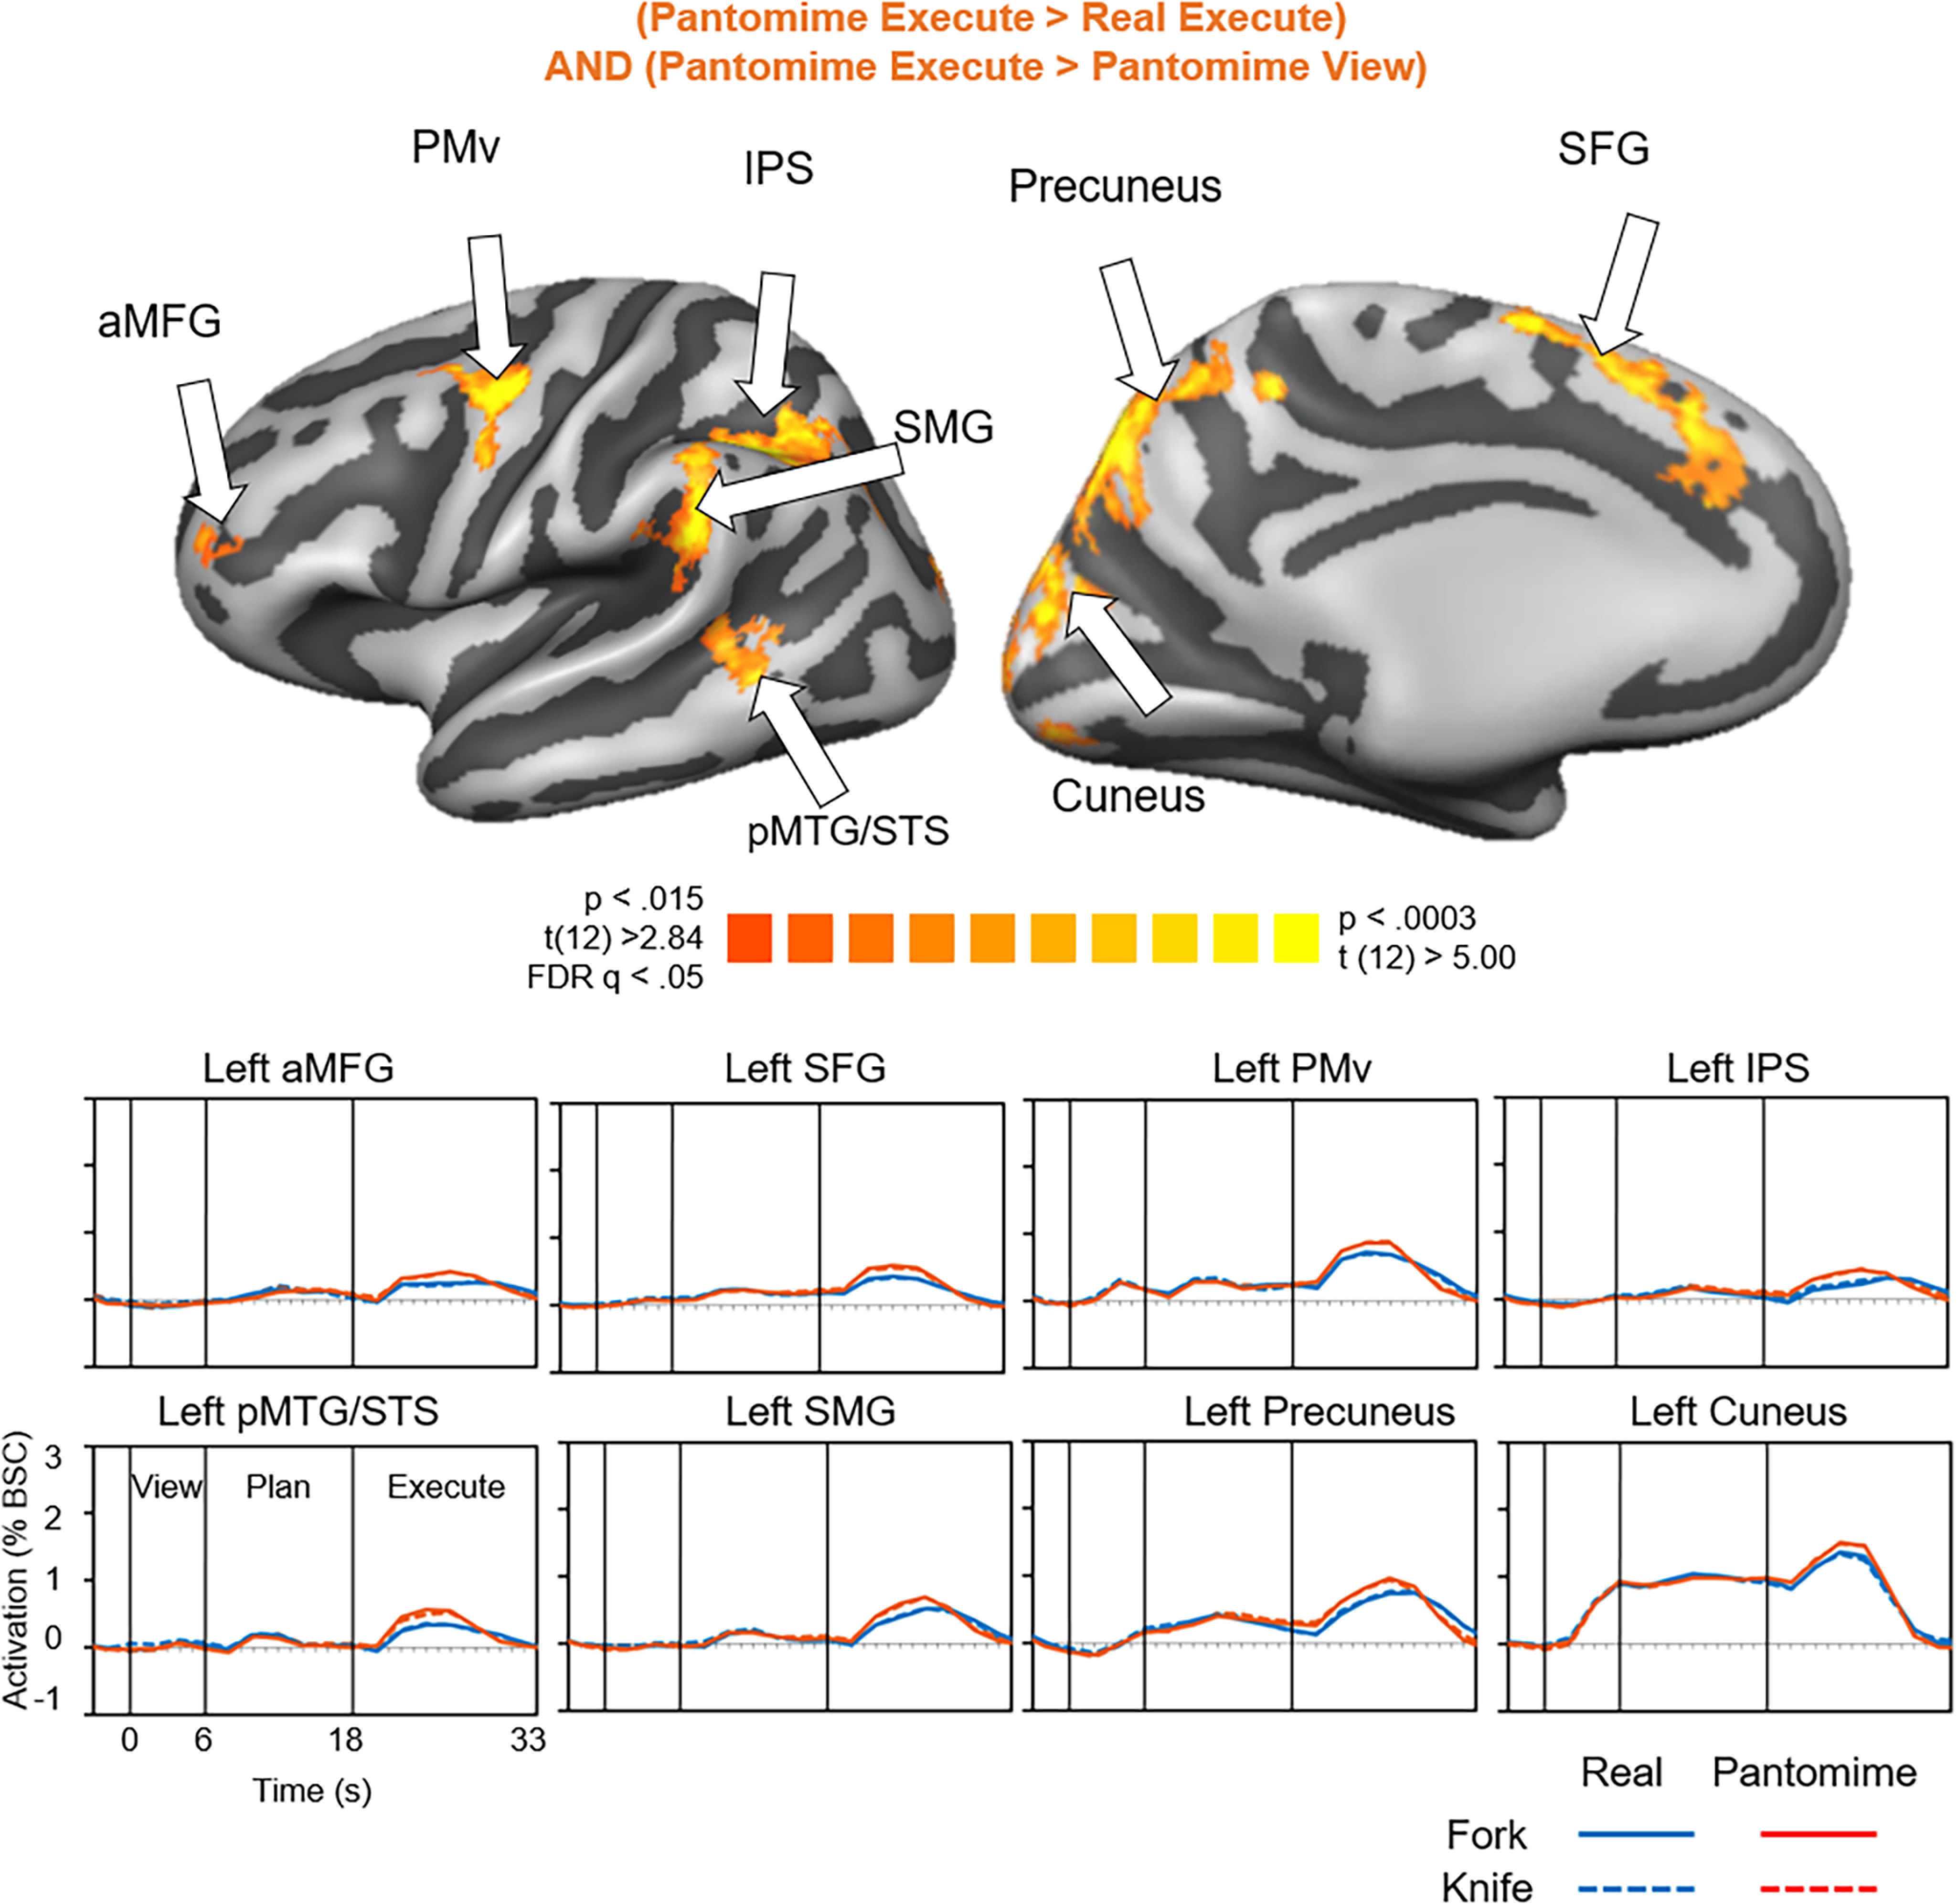
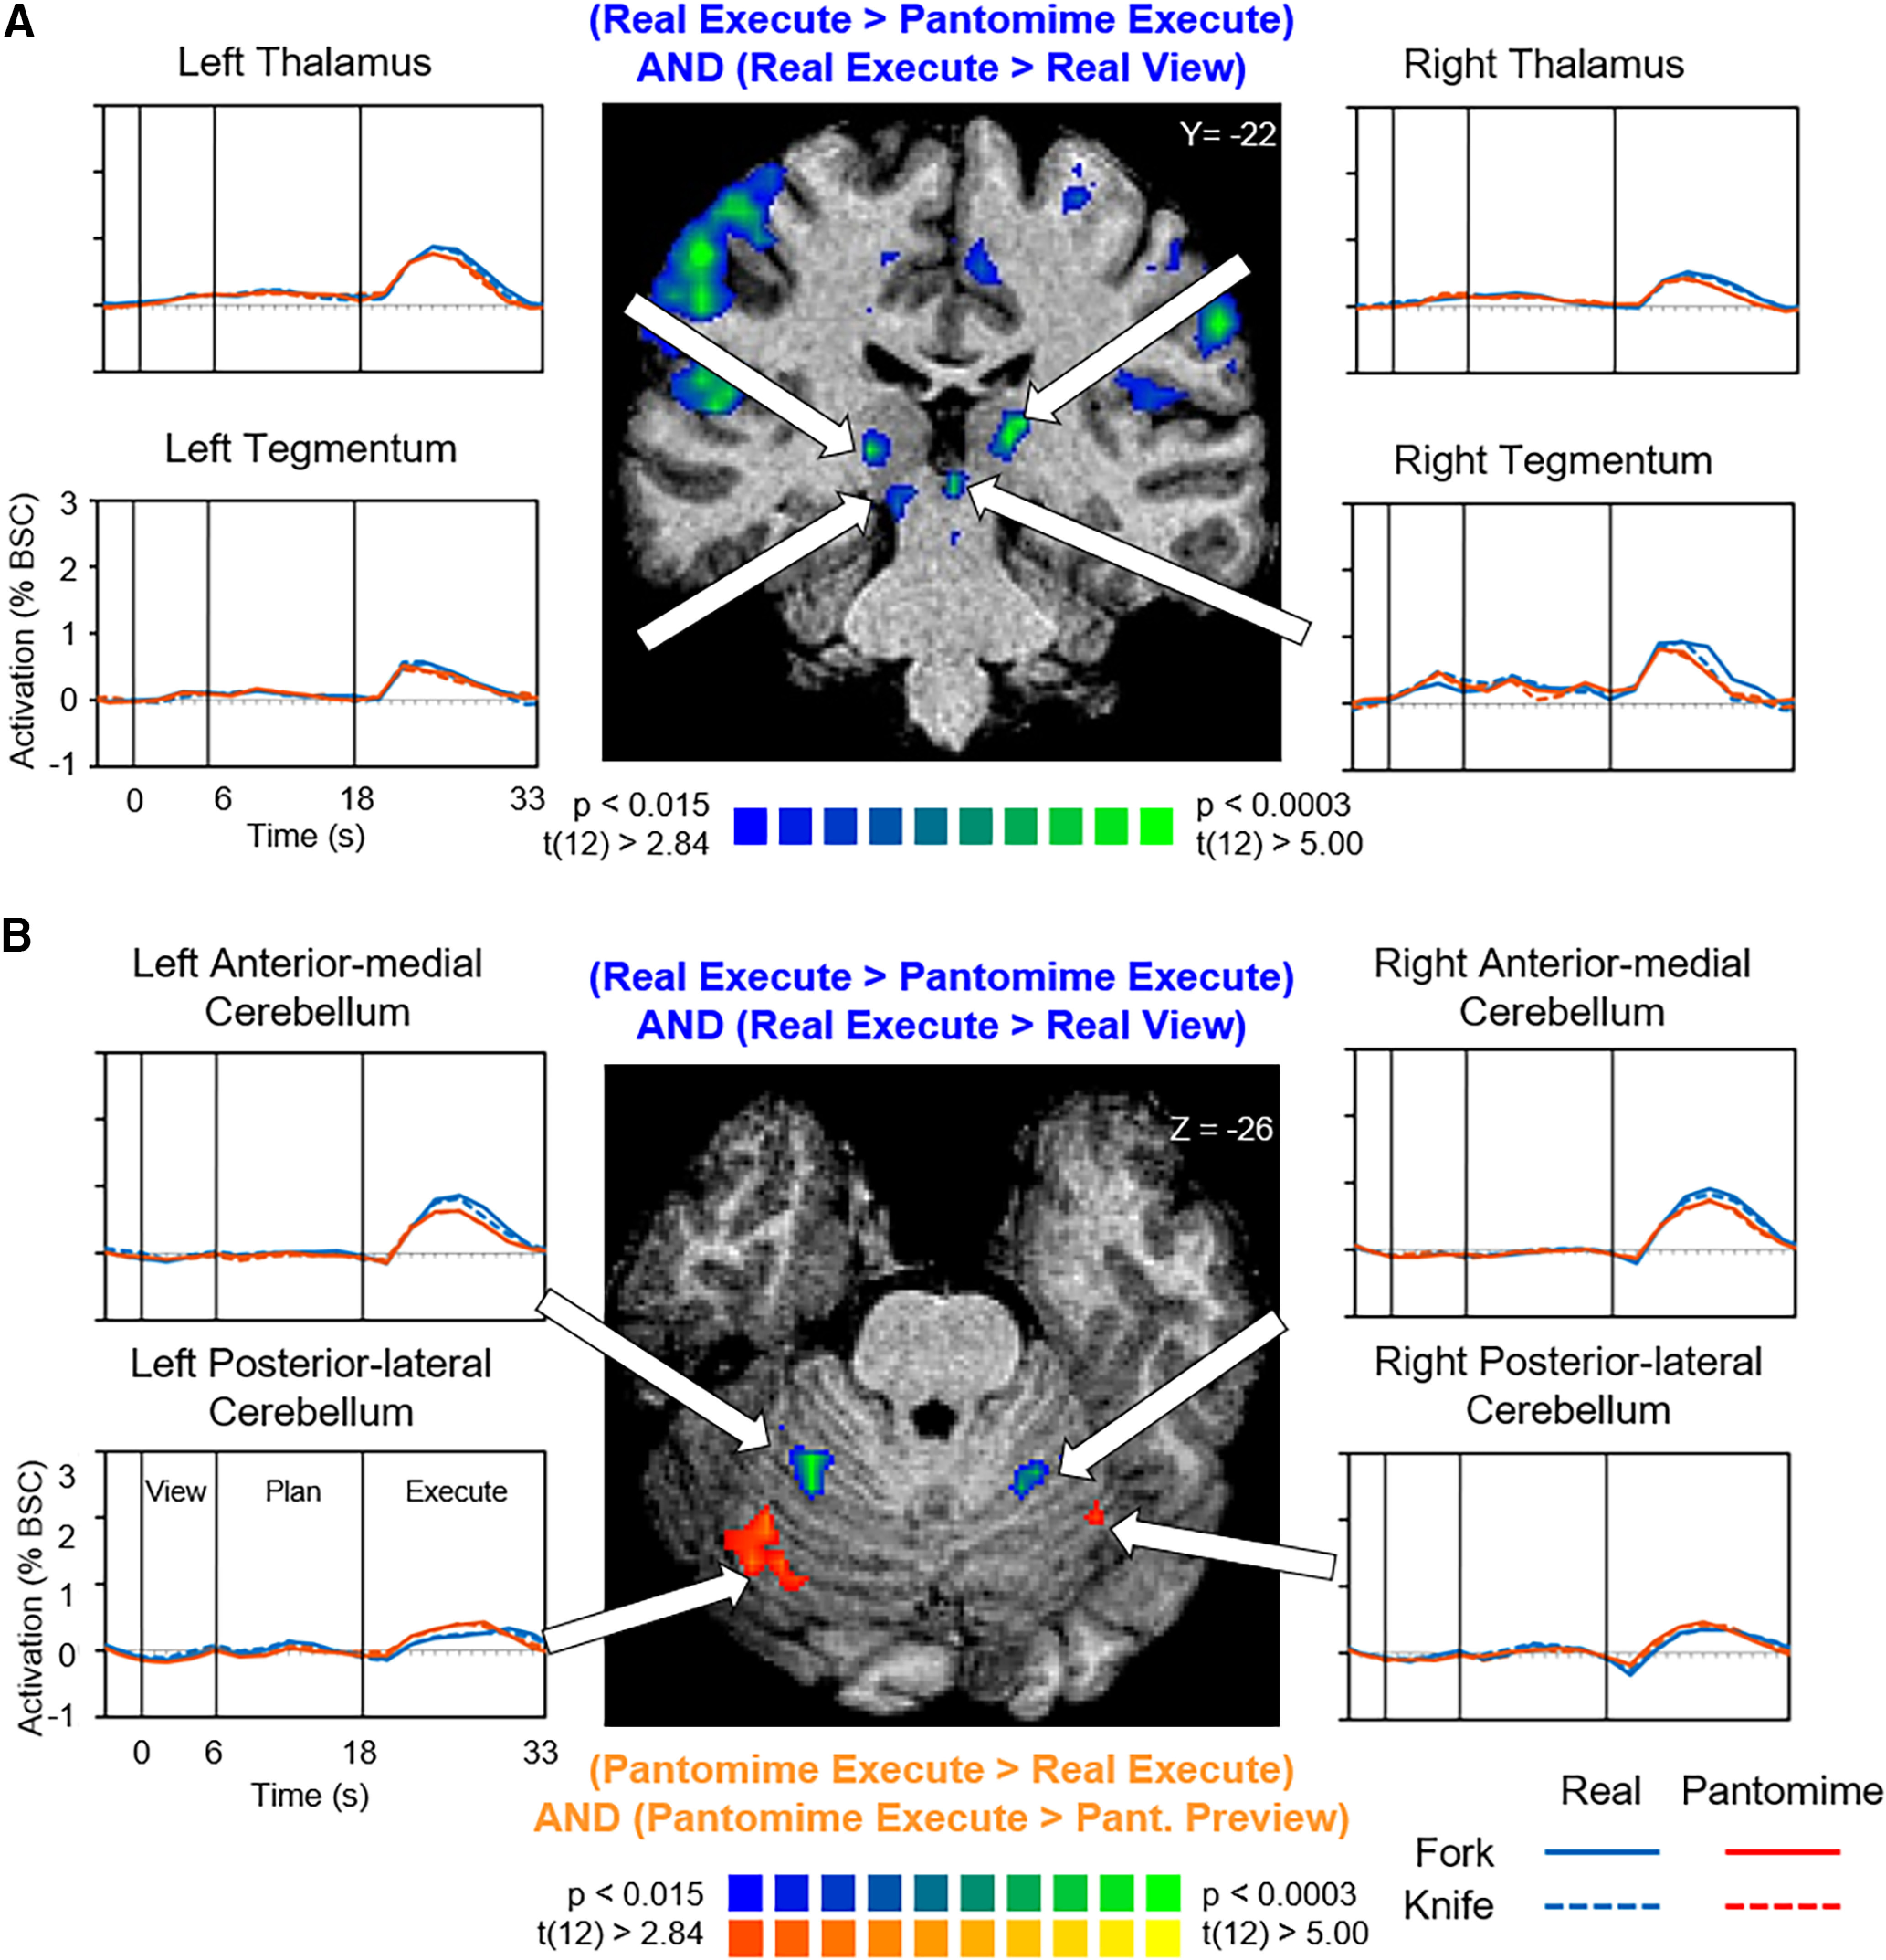
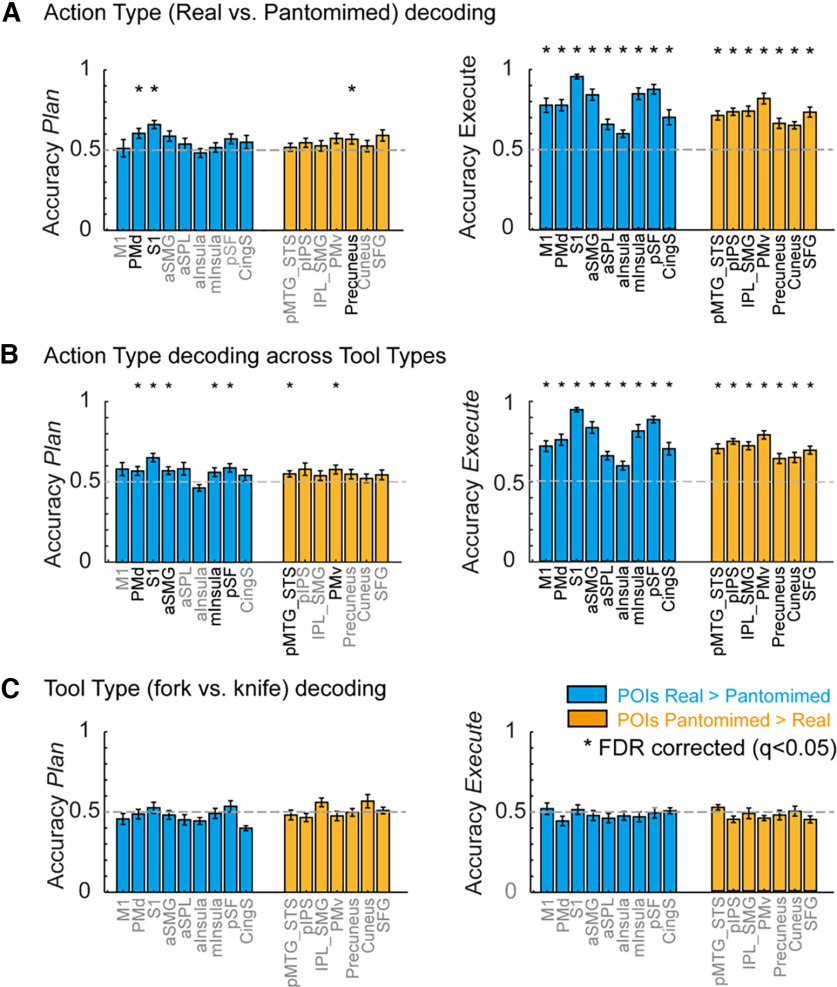
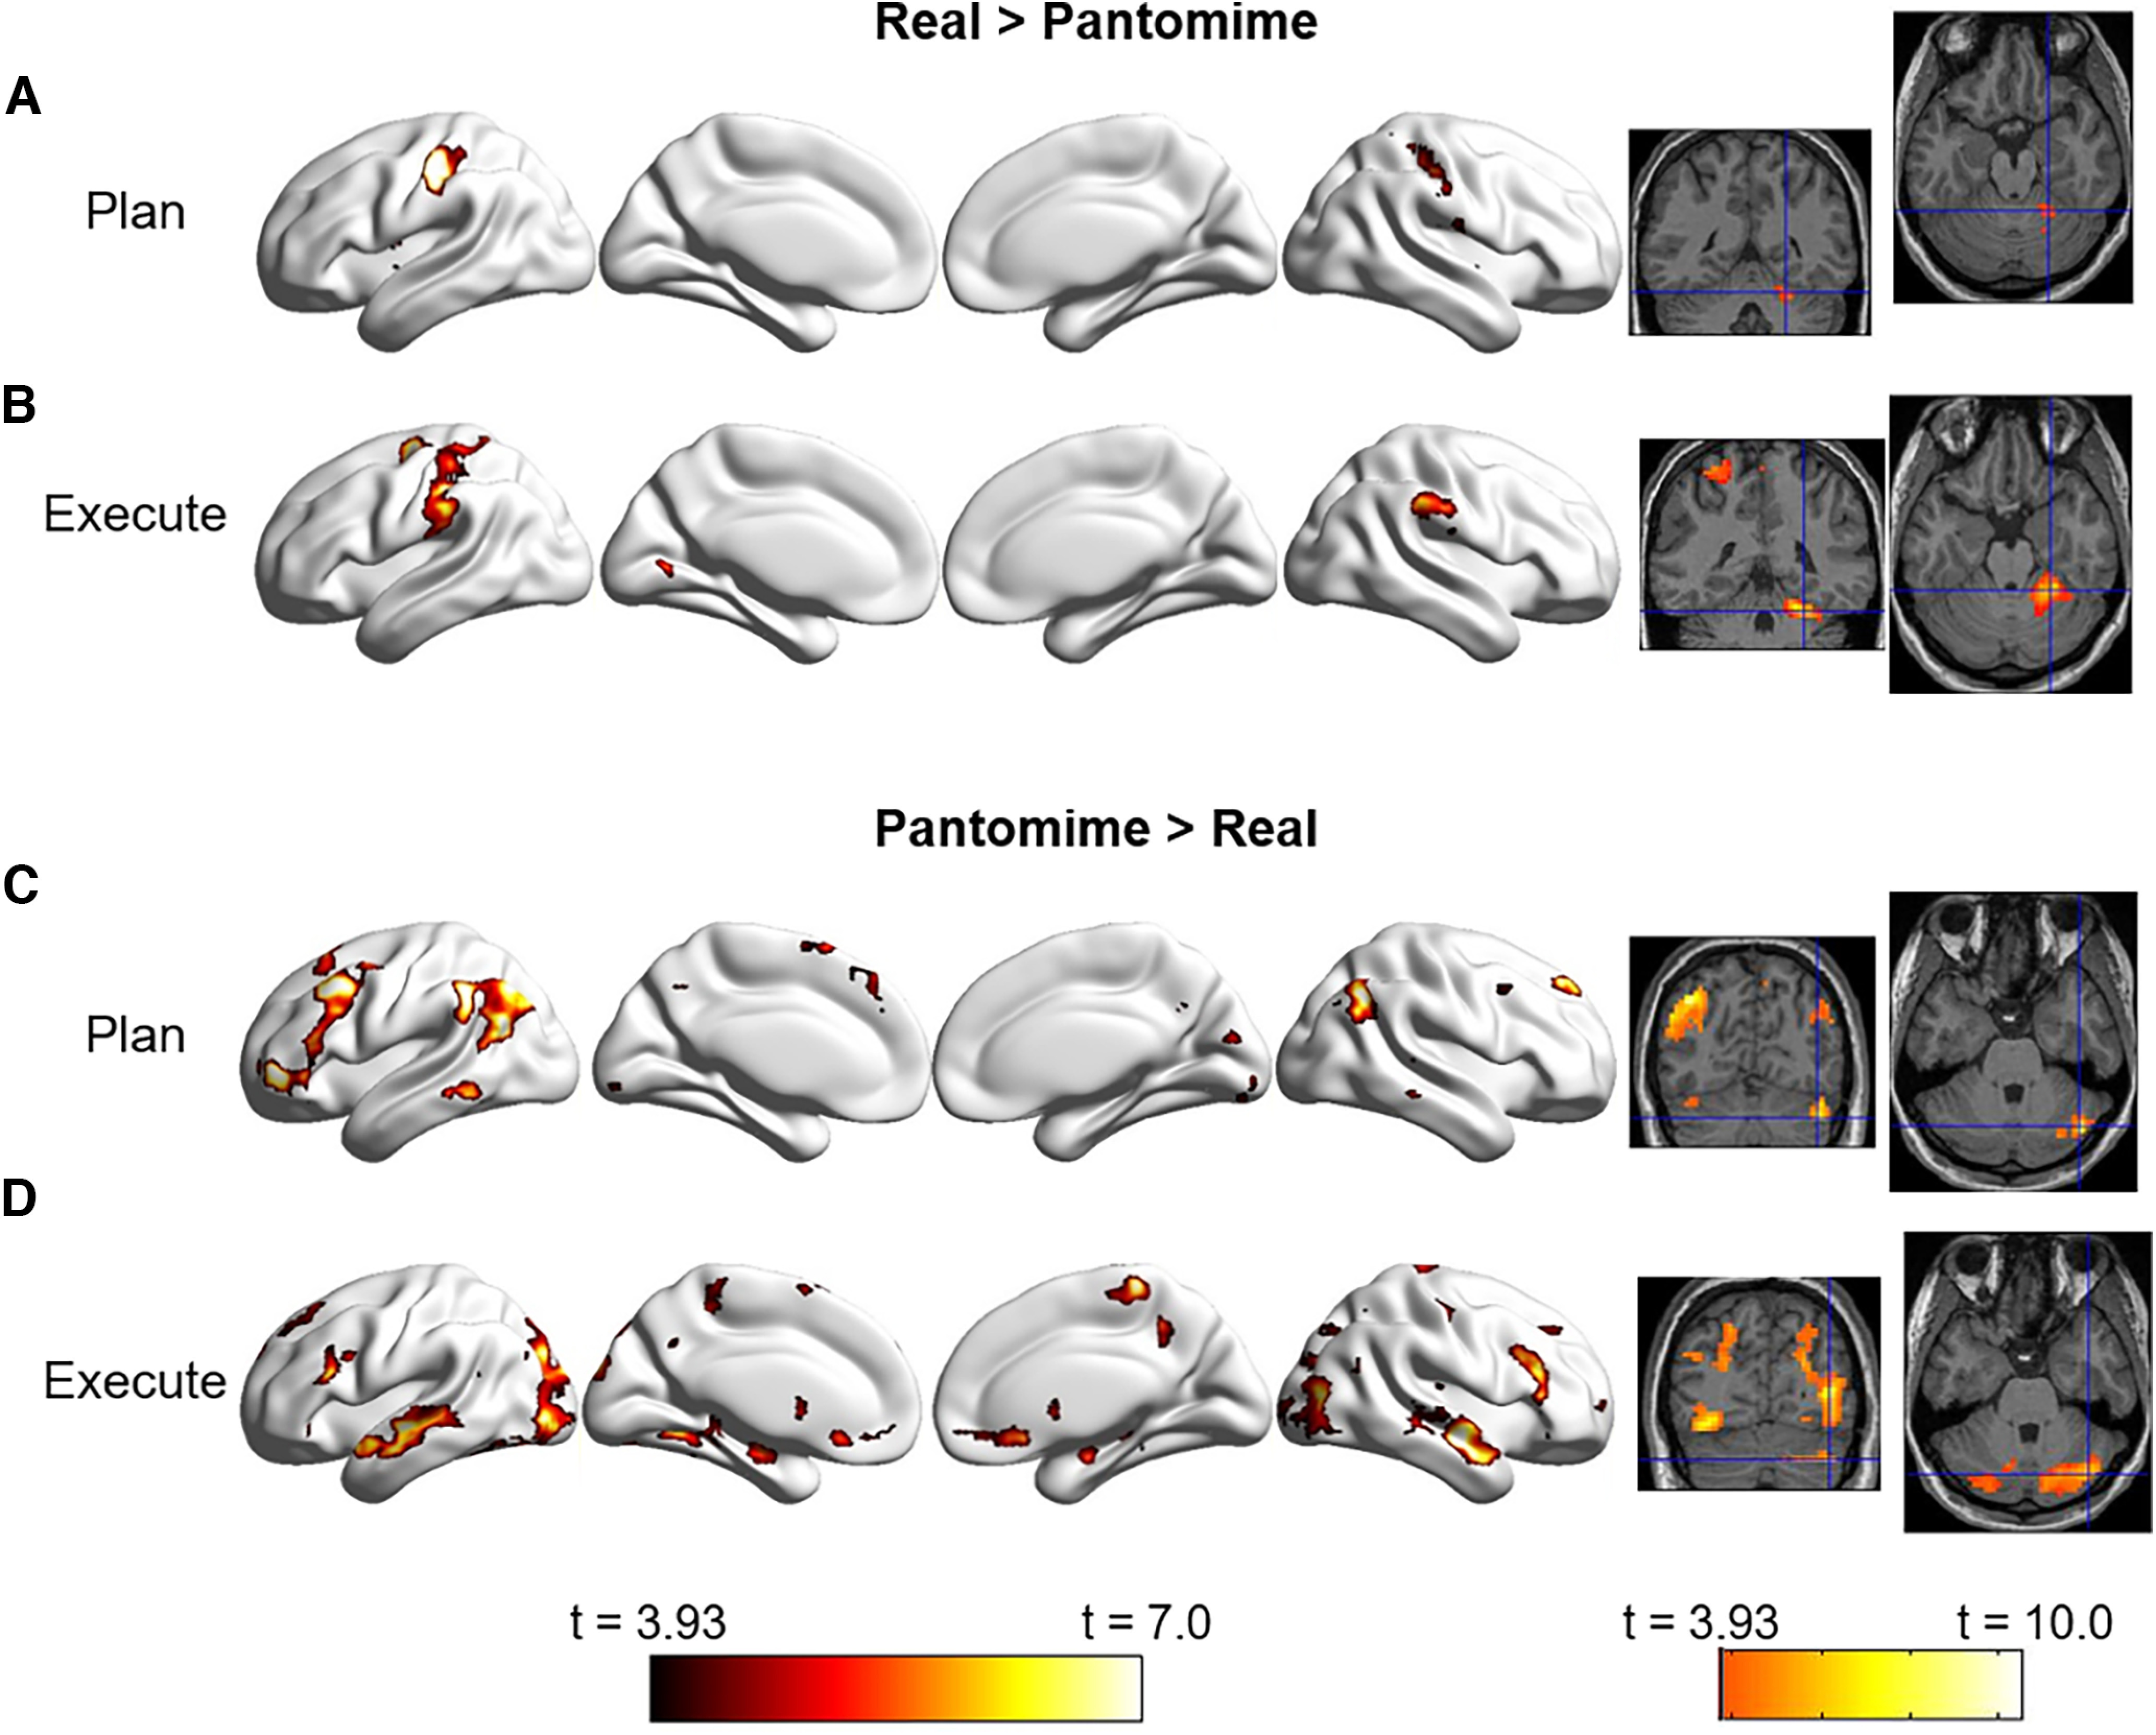
Because the sophistication of tool use is vastly enhanced in humans compared with other species, a rich understanding of its neural substrates requires neuroscientific experiments in humans. Although functional magnetic resonance imaging (fMRI) has enabled many studies of tool-related neural processing, surprisingly few studies have examined real tool use. Rather, because of the many constraints of fMRI, past research has typically used proxies such as pantomiming despite neuropsychological dissociations between pantomimed and real tool use. We compared univariate activation levels, multivariate activation patterns, and functional connectivity when participants used real tools (a plastic knife or fork) to act on a target object (scoring or poking a piece of putty) or pantomimed the same actions with similar movements and timing. During the Execute phase, we found higher activation for real versus pantomimed tool use in sensorimotor regions and the anterior supramarginal gyrus, and higher activation for pantomimed than real tool use in classic tool-selective areas. Although no regions showed significant differences in activation magnitude during the Plan phase, activation patterns differed between real versus pantomimed tool use and motor cortex showed differential functional connectivity. These results reflect important differences between real tool use, a closed-loop process constrained by real consequences, and pantomimed tool use, a symbolic gesture that requires conceptual knowledge of tools but with limited consequences. These results highlight the feasibility and added value of employing natural tool use tasks in functional imaging, inform neuropsychological dissociations, and advance our theoretical understanding of the neural substrates of natural tool use.SIGNIFICANCE STATEMENT The study of tool use offers unique insights into how the human brain synthesizes perceptual, cognitive, and sensorimotor functions to accomplish a goal. We suggest that the reliance on proxies, such as pantomiming, for real tool use has (1) overestimated the contribution of cognitive networks, because of the indirect, symbolic nature of pantomiming; and (2) underestimated the contribution of sensorimotor networks necessary for predicting and monitoring the consequences of real interactions between hand, tool, and the target object. These results enhance our theoretical understanding of the full range of human tool functions and inform our understanding of neuropsychological dissociations between real and pantomimed tool use.
Keywords: activity; connectivity; fMRI; pantomimed action; real action; tool use.
Copyright © 2023 the authors.
Figures
Similar articles
-
What does the brain do when you fake it? An FMRI study of pantomimed and real grasping.J Neurophysiol. 2007 Mar;97(3):2410-22. doi: 10.1152/jn.00778.2006. Epub 2007 Jan 17. J Neurophysiol. 2007. PMID: 17229828
-
Gender differences in non-standard mapping tasks: A kinematic study using pantomimed reach-to-grasp actions.Cortex. 2016 Sep;82:244-254. doi: 10.1016/j.cortex.2016.06.009. Epub 2016 Jun 27. Cortex. 2016. PMID: 27410715
-
Critical brain regions for tool-related and imitative actions: a componential analysis.Brain. 2014 Jul;137(Pt 7):1971-85. doi: 10.1093/brain/awu111. Epub 2014 Apr 27. Brain. 2014. PMID: 24776969 Free PMC article.
-
Contribution of the posterior parietal cortex in reaching, grasping, and using objects and tools.Front Psychol. 2014 Mar 5;5:151. doi: 10.3389/fpsyg.2014.00151. eCollection 2014. Front Psychol. 2014. PMID: 24634664 Free PMC article. Review.
-
Integrated technology for evaluation of brain function and neural plasticity.Phys Med Rehabil Clin N Am. 2004 Feb;15(1):263-306. doi: 10.1016/s1047-9651(03)00124-4. Phys Med Rehabil Clin N Am. 2004. PMID: 15029909 Review.
Cited by
-
Validation of Chinese version of the familiar tools use test for assessing limb apraxia in stroke patients.Front Neurol. 2025 Jun 3;16:1578179. doi: 10.3389/fneur.2025.1578179. eCollection 2025. Front Neurol. 2025. PMID: 40529449 Free PMC article.
-
Cognitive neuropsychological and neuroanatomic predictors of naturalistic action performance in left hemisphere stroke: A retrospective analysis.Cortex. 2025 Apr;185:301-315. doi: 10.1016/j.cortex.2025.03.004. Epub 2025 Mar 14. Cortex. 2025. PMID: 40121973
-
Activity in Occipito-Temporal Cortex Is Involved in Tool-Use Planning and Contributes to Tool-Related Semantic Neural Representations.Neurobiol Lang (Camb). 2024 Dec 3;5(4):1008-1024. doi: 10.1162/nol_a_00159. eCollection 2024. Neurobiol Lang (Camb). 2024. PMID: 39640363 Free PMC article.
-
Differences in Neural Activation between Actual Tool Use and Pantomime: Evidence for Two Different Streams?J Neurosci. 2024 Jun 12;44(24):e0248242024. doi: 10.1523/JNEUROSCI.0248-24.2024. J Neurosci. 2024. PMID: 38866537 Free PMC article. No abstract available.
-
Cognitive neuropsychological and neuroanatomic predictors of naturalistic action performance in left hemisphere stroke: a retrospective analysis.bioRxiv [Preprint]. 2025 Mar 15:2024.07.01.601398. doi: 10.1101/2024.07.01.601398. bioRxiv. 2025. Update in: Cortex. 2025 Apr;185:301-315. doi: 10.1016/j.cortex.2025.03.004. PMID: 39005391 Free PMC article. Updated. Preprint.
References
-
- Chang CC, Lin CJ (2011) LIBSVM: a library for support vector machines. ACM Trans Intell Syst Technol 2:1–27. 10.1145/1961189.1961199 - DOI
Publication types
MeSH terms
LinkOut - more resources
Full Text Sources
Miscellaneous