. 2023 Sep 18;14(1):5769.
doi: 10.1038/s41467-023-41460-x.

Strong electron-phonon coupling driven pseudogap modulation and density-wave fluctuations in a correlated polar metal

Affiliations

Strong electron-phonon coupling driven pseudogap modulation and density-wave fluctuations in a correlated polar metal

Huaiyu Hugo Wang et al. Nat Commun. .

Abstract

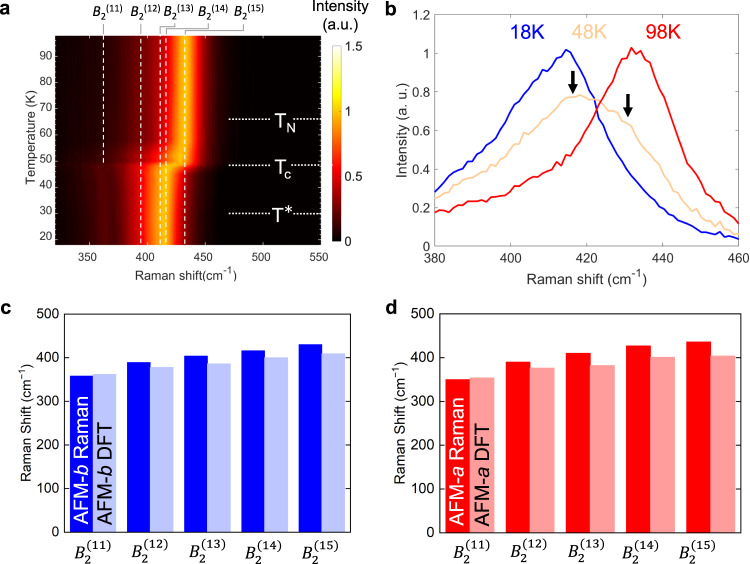
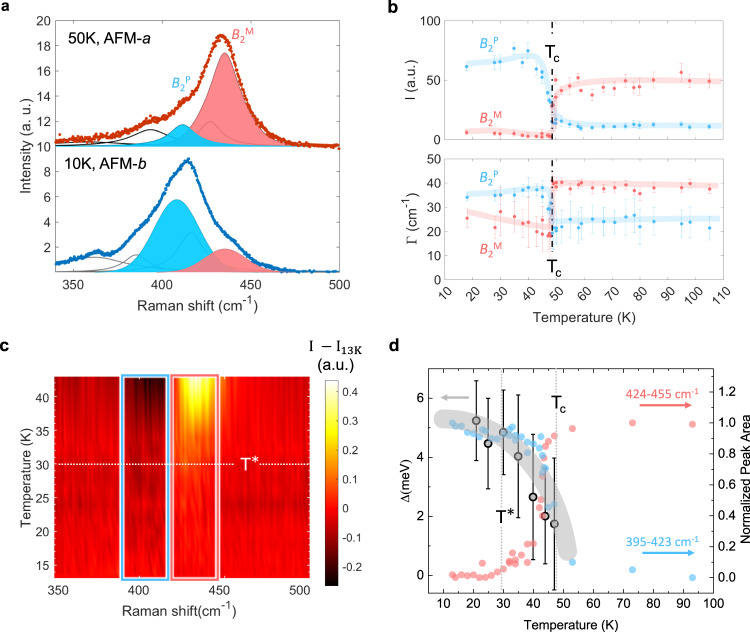
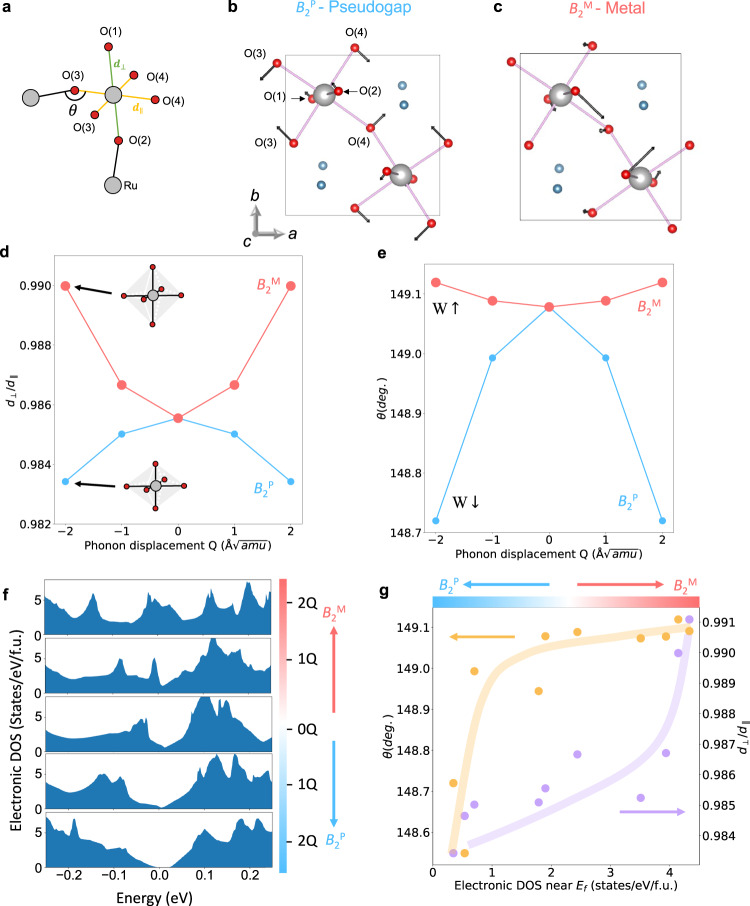
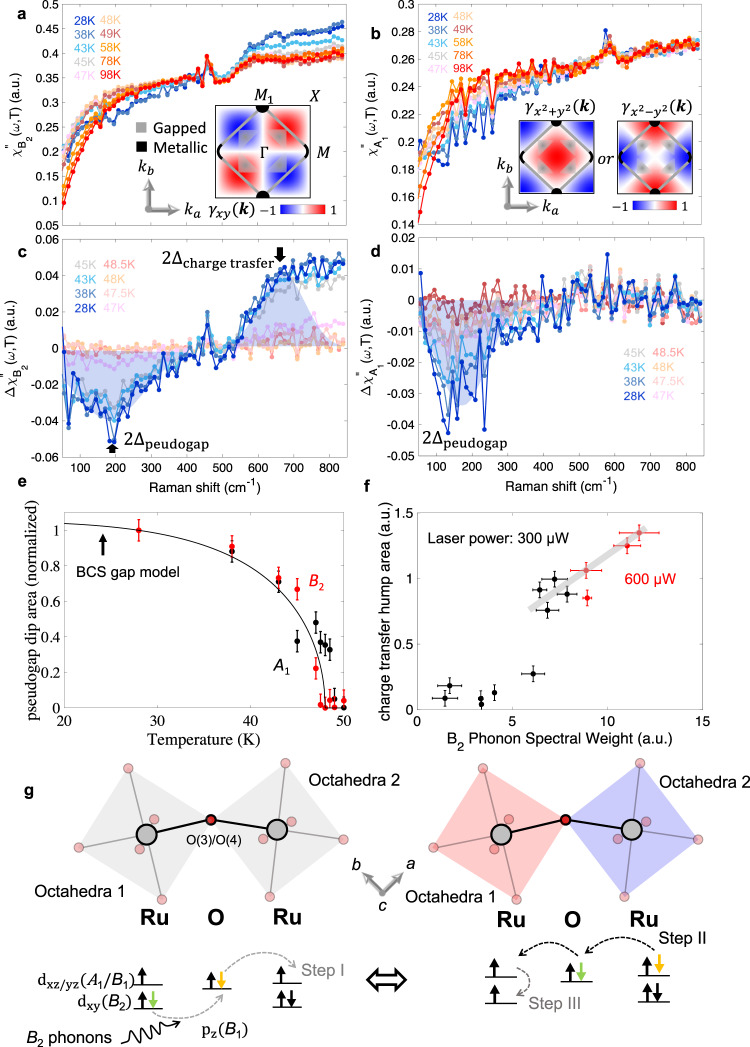
There is tremendous interest in employing collective excitations of the lattice, spin, charge, and orbitals to tune strongly correlated electronic phenomena. We report such an effect in a ruthenate, Ca3Ru2O7, where two phonons with strong electron-phonon coupling modulate the electronic pseudogap as well as mediate charge and spin density wave fluctuations. Combining temperature-dependent Raman spectroscopy with density functional theory reveals two phonons, B2P and B2M, that are strongly coupled to electrons and whose scattering intensities respectively dominate in the pseudogap versus the metallic phases. The B2P squeezes the octahedra along the out of plane c-axis, while the B2M elongates it, thus modulating the Ru 4d orbital splitting and the bandwidth of the in-plane electron hopping; Thus, B2P opens the pseudogap, while B2M closes it. Moreover, the B2 phonons mediate incoherent charge and spin density wave fluctuations, as evidenced by changes in the background electronic Raman scattering that exhibit unique symmetry signatures. The polar order breaks inversion symmetry, enabling infrared activity of these phonons, paving the way for coherent light-driven control of electronic transport.


Conflict of interest statement

The authors declare no competing interests.

Figures

Fig. 1
Fig. 1. Raman spectra coupled to the ground states of Ca3Ru2O7.
a Crystal structure of Ca3Ru2O7 with illustrated magnetic space group, symmetry operations and magnetic spins in the AFM-a and AFM-b phases. b Electronic and magnetic phase diagram of Ca3Ru2O7. c Schematically depicted Raman lab geometry with respect to the crystal lattice of Ca3Ru2O7. The Ei,s and kis are polarization and wavevector or incident and scattered light respectively. d Representative polarized Raman intensities for Ca3Ru2O7 at AFM-b and AFM-a phases respectively.
Fig. 2
Fig. 2. Temperature dependent Raman spectra and a comparison with density functional theory.
a Temperature dependent Raman spectra in z¯(xy)z with B2(11) to B2(15) modes highlighted. The intensity is normalized to strongest Raman peak. b B2 spectrum at 48 K (Tc) showcase features of shoulder peaks highlighted with black arrows, compared with spectra at 18 K and 98 K. The DFT calculated B2(11) to B2(15) phonon energies compared to experimental observations in c AFM-a and d AFM-b phases.
Fig. 3
Fig. 3. Temperature-dependent reconstruction of B2M and B2P phonon spectra.
a Fitting of z¯(xy)z Raman spectra between 340 cm–1 and 470 cm–1 at 50 K (top panel) and 10 K (bottom panel). the celeste/pink color-coded peak correspond to B2P/B2M. b The temperature dependent plots of amplitude (I) and FWHM (Γ) of B2P (celeste) and B2M (pink) modes. Error bars are standard deviations from fitting values. The celeste/pink lines are guides to the eye. c Raman colormap plot of the intensity difference between specified temperature and 13 K. The total area of region of interest highlighted in blue and red boxes in c are replotted in d to indicate an intensity anomaly observed at T* = 30 K. The pseudogap size (Δ) is extracted from ARPES data and is represented as grey data points. The broad grey line is a guide to the eye.
Fig. 4
Fig. 4. Phonon eigenmodes and microscopic mechanism of electronic band modulation.
a Illustration of the Ru and O atoms, bond lengths between oxygens and the bond angle of O-Ru-O. b The illustrations of the eigen mode of B2P, and c that of B2M. d The averaged ratio of RuO6 octahedra cage apical Ru-O bond length (d) over in-plane bond length (d) modulated by two phonons. e Averaged in-plane bond angle (θ) modulated by the two phonons.  (see Supplementary Figs. 15 for phonon modulated bond length and angles in two types of RuO6f The density of states plots of the AFM-b ground state (middle) and the modulated AFM-b state by B2M (top) and B2P (bottom). g Correlation between octahedra distortion (d/d), in plane bond angle (θ) and the density of states near the Fermi surface. The lines are guides to the eye.
Fig. 5
Fig. 5. Phonon mediated charge density fluctuation observed in electronic Raman scattering.
Temperature dependence of a B2 and b A1 Raman response function (χuω,T) of Ca3Ru2O7 across Tc. The corresponding momentum-space structure of the form factor γkμ are depicted in the insets (Supplementary Note 10) overlayed with a schematic of momentum resolved electronic band features in the low-energy excitation near the Fermi surface from ARPES studies, , . The background responses of c B2 and d A1, after subtracting the background response at 49 K to highlight the dip feature below 400 cm-1 arising from the pseudogap opening, and the hump feature seen above 550 cm-1. e Temperature dependence of the pseudogap Raman signal obtained by summing between 120 cm-1 and 400 cm-1 in ΔχB2ω,T (red circles) and ΔχA1ω,T (black circles). The signal is normalized to the maximum signal at 28 K and the solid line is a BCS gap model. f Correlation between B2P spectral weight and charge transfer Raman response at 300μW (black circles) and 600μW (red circles) incident laser power. g A schematic diagram of the proposed 3 step mechanism for the hump feature in B2: the orbital flip excitation is mediated by B2 phonons. The orbital flip excitation transiently differentiates the neighboring RuO6 octahedra and induces dynamical charge and spin density fluctuations. Errorbars of integrated area is estimated from variance of featureless section in Δχuω,T, and the errorbars of phonon spectral weight are standard deviations from fitting results.

References

    1. Imada M, Fujimori A, Tokura Y. Metal-insulator transitions. Rev. Mod. Phys. 1998;70:1039–1263. doi: 10.1103/RevModPhys.70.1039. - DOI
    1. Basov DN, Averitt RD, van der Marel D, Dressel M, Haule K. Electrodynamics of correlated electron materials. Rev. Mod. Phys. 2011;83:471–541. doi: 10.1103/RevModPhys.83.471. - DOI
    1. Gruner, G. Density waves in solids. (CRC press, 2018).
    1. Baldini, E. Nonequilibrium dynamics of collective excitations in quantum materials. (Springer, 2018).
    1. Sigrist M, Ueda K. Phenomenological Theory of Unconventional Superconductivity. Rev. Mod. Phys. 1991;63:239–311. doi: 10.1103/RevModPhys.63.239. - DOI