. 2023 Sep 18;14(1):5770.
doi: 10.1038/s41467-023-41452-x.

Whole-genome screens reveal regulators of differentiation state and context-dependent migration in human neutrophils

Affiliations

Whole-genome screens reveal regulators of differentiation state and context-dependent migration in human neutrophils

Nathan M Belliveau et al. Nat Commun. .

Abstract

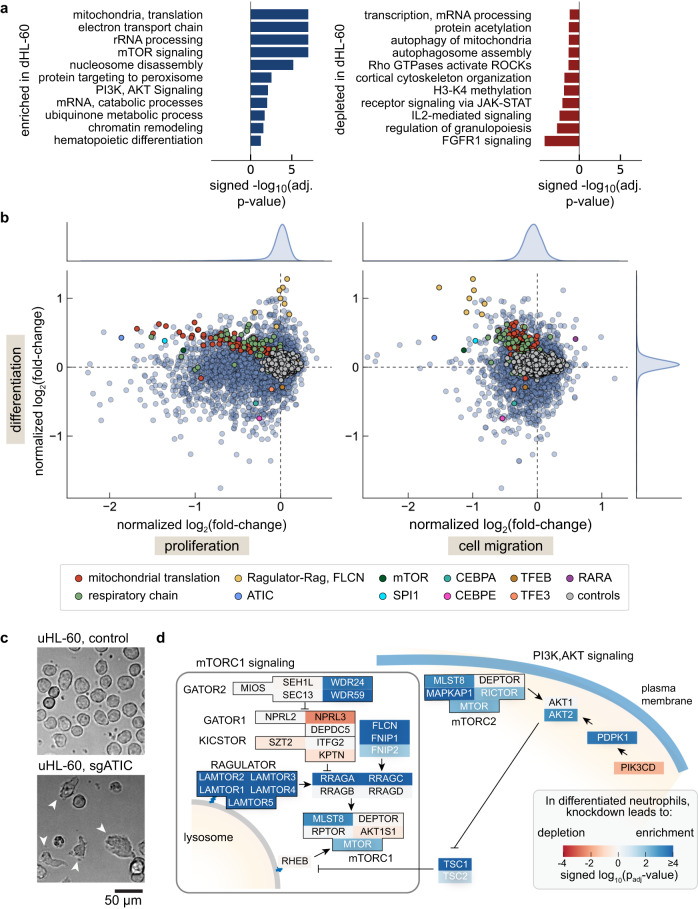
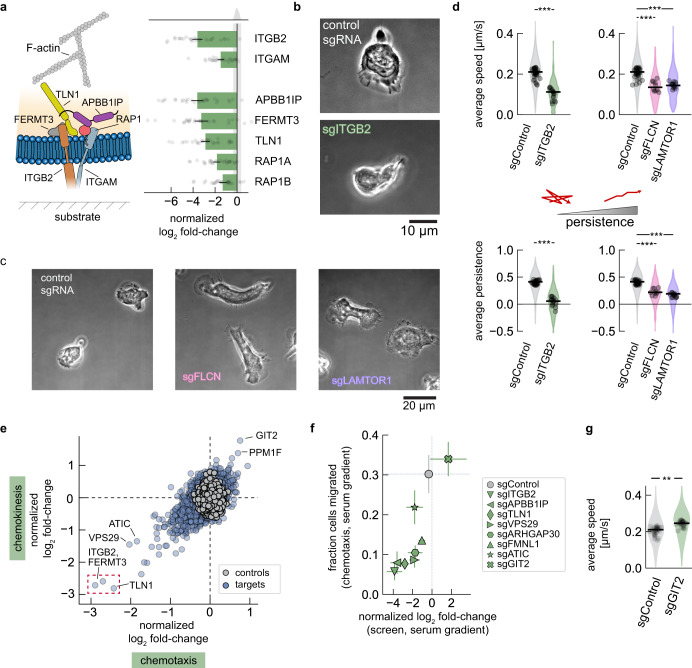
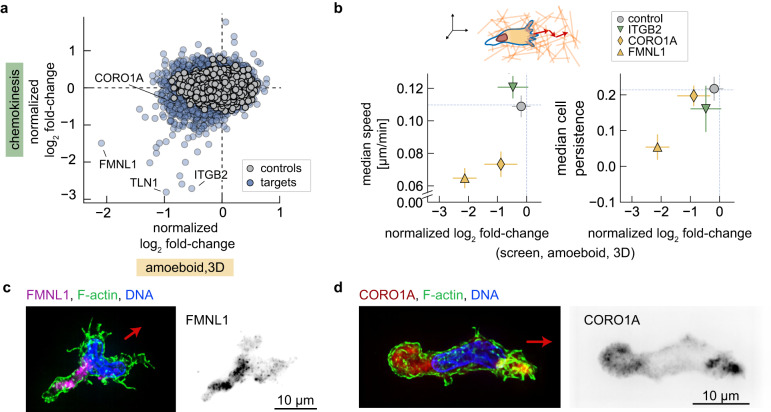
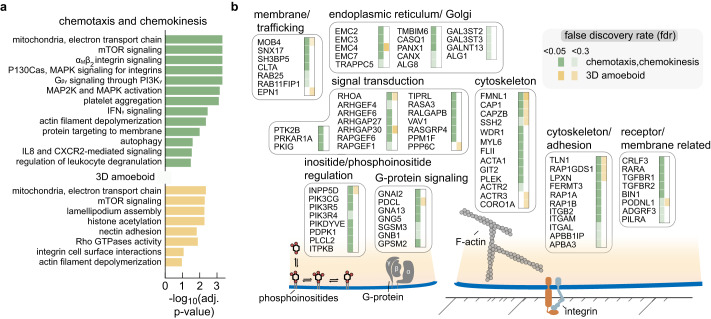
Neutrophils are the most abundant leukocyte in humans and provide a critical early line of defense as part of our innate immune system. We perform a comprehensive, genome-wide assessment of the molecular factors critical to proliferation, differentiation, and cell migration in a neutrophil-like cell line. Through the development of multiple migration screen strategies, we specifically probe directed (chemotaxis), undirected (chemokinesis), and 3D amoeboid cell migration in these fast-moving cells. We identify a role for mTORC1 signaling in cell differentiation, which influences neutrophil abundance, survival, and migratory behavior. Across our individual migration screens, we identify genes involved in adhesion-dependent and adhesion-independent cell migration, protein trafficking, and regulation of the actomyosin cytoskeleton. This genome-wide screening strategy, therefore, provides an invaluable approach to the study of neutrophils and provides a resource that will inform future studies of cell migration in these and other rapidly migrating cells.


Conflict of interest statement

J.A.T. is chief scientific advisor at the Allen Institute for Cell Science (Seattle, WA, 98109). The authors otherwise declare no competing interests.

Figures

Fig. 1
Fig. 1. Genome-wide CRISPRi screens of proliferation, differentiation, and cell migration.
a Flow cytometry immunofluorescence shows near-complete loss of CD4 protein (blue) in uHL-60 cells expressing dCas9-KRAB, relative to normal expression (orange) and an isotype control (gray, shaded). b Schematic of pooled genome-wide CRISPRi dropout experiments of uHL-60 cell proliferation and differentiation into dHL-60 neutrophils. Proliferation was assayed by comparing sgRNA abundances following six days of growth (~24 hr doubling time) (set 2 versus set 1; 4 independent replicates). Differentiation was assayed by comparing sgRNA abundance between dHL-60 neutrophils and uHL-60 cells (set 3 versus set 1; 8 independent replicates). c Schematic of pooled CRISPRi cell migration assays. Migration of dHL-60 cells were assayed across three experiments: chemotaxis (serum gradient), chemokinesis (uniform serum stimulation), and 3D amoeboid migration in an extracellular matrix (see “Methods”). For quantification, sgRNA abundance in both migratory fractions (sets 4i and 5i) and remaining cells (sets 4ii and 5ii) were compared to our initial dHL-60 library (set 3). Membrane, pores and cells drawn to scale. d Error bars represent mean values +/− SD of the migratory fraction across independent experiments (3D amoeboid: 6 replicates; chemokinesis 2 hr and 6 hr: 4 replicates each; chemotaxis 2 hr: 4 replicates; chemotaxis 6 hr: 16 replicates). For 3D amoeboid experiments, the migratory fraction of cells was collected from the fibrin layer. e Volcano plots across the screens of proliferation, differentiation, and cell migration. Data points represent the average log2 fold-change from three sgRNAs per gene across independent experiments (4 replicate screens for proliferation, 8 replicate screens for differentiation, and 20 migration screens). Cell migration values represent an average across all migration assays. Controls were generated by randomly selecting groups of three control sgRNAs. P-values were calculated using a one-sided permutation test, adjusted for multiple comparisons using the Benjamini–Hochberg procedure (dashed line: p = 0.05). f Screen overlap. The number of significant genes are identified in the left horizontal bar plot using an adjusted p value cutoff of 0.05, while the intersection of genes across screens is shown in the vertical bar plot (dot diagram identifies the specific intersection).
Fig. 2
Fig. 2. Identification of genes and pathways important for neutrophil differentiation.
a Pathways enriched in our CRISPRi differentiation screen (dHL-60 cells relative to uHL-60 cells). Pathways that were associated with genes whose knockdown predominantly led to an enrichment of target sgRNAs in the dHL-60 cell population are identified in blue, while those that decreased in abundance are in red. P-values estimate the statistical significance of gene set enrichment, calculated using a one-sided permutation test and adjusted for multiple comparisons using the Benjamini–Hochberg procedure. b Comparison of log2 fold-changes across the CRISPRi screens of proliferation, differentiation, and cell migration. Several gene sets identified through our pathway enrichment analysis and several known regulators of neutrophil differentiation are identified. The cell migration data points represent normalized log2 fold-change values, calculated by averaging across all individual migration screen replicates. c Brightfield microscopy of uHL-60 CRISPRi knockdown lines targeting ATIC and a control sgRNA. Control uHL-60 cells exhibit an expected round morphology, while sgRNA targeting of ATIC resulted in many cells that exhibited a migratory capability (white arrows). Images are representative of acquisitions across three fields of view. d Schematic of mTORC1/mTORC2 signaling pathway, color coded by signed statistical significance values (log10 padj value) from the differentiation screen results. Blue indicates gene targets whose sgRNA were enriched in the dHL-60 cells, while red indicates those that were depleted.
Fig. 3
Fig. 3. Characterization of cellular growth and survival following knockdown of mTOR-related genes.
a Differentiation screen results were confirmed across a number of sgRNA targets. Cell density was monitored at 5-days following the initiation of neutrophil differentiation. The dashed lines represent the values obtained for dHL-60 cells with a control sgRNA. Error bars represent mean values +/− SD across independent experiments (8 experiments for screen and 3 experiments for cell density measurements). b Change in dHL-60 cell density following differentiation. Cell density measurements were normalized to day 4, following initiation of cell differentiation of uHL-60 cells. Error bars represent mean values +/− SD across 3 independent experiments. Note that media was replenished every three days, with cell density measurements corrected to account for changes in media volume and evaporation. c Rapamycin treatment in dHL-60 CRISPRi knockdown lines targeting FLCN, LAMTOR1, and a control sgRNA. Treatment of dHL-60 cells was begun on day 4 post-initiation of differentiation. Cells were either untreated (solid line), or treated with rapamycin at 10 nM rapamycin (dashed lines) and 100 nM rapamycin (dash-dot lines). Error bars represent mean values +/− SD across 3 independent experiments.
Fig. 4
Fig. 4. Knockdown of FLCN and LAMTOR1 alters differentiation trajectory and results in cells with poorer chemotactic sensitivity.
a Flow cytometry immunofluorescence measurements of CD11b (ITGAM) and fMLP receptor 1 (FPR1) cell surface expression in uHL-60 and dHL-60 cells. b The two-dimensional heatmap shows the induced expression of CD11b and fMLP receptor 1 in dHL-60 cells. The axis associated with induction of these surface markers were identified by applying principal components analysis. Measurements using isotype control antibodies are shown in gray. c The first principal component identified in (b) was used to compare changes in expression induction in different gene knockdown lines. Black lines indicate the 99% confidence interval for the log expression mean along the first principle component, calculated by bootstrapping across single-cell flow cytometry measurements. A two-sided Mann-Whitney U test was applied to the bootstrapped log expression values from each knockdown cell line and the control cell line (***p < 0.001). d Transcriptional changes following knockdown of FLCN, LAMTOR1, and SPI1 were assayed by RNA-seq pre-differentiation (undiff.), 1-day, 5-day, and 7-day post-differentiation. Dimensionality reduction using UMAP was applied to transcription data and pseudo-plotted using a spline to show temporal trajectory. Individual data points represent an average across 6 independent RNA-seq samples. e The acute chemotaxis response of dHL-60 cells was assayed by photo-uncaging fMLP during migration of agarose-confined cells on BSA passivated coverslips. Average instantaneous speed (i), angular bias (ii), and the directed speed (projected speed along direction of fMLP gradient) (iii) are shown. Data points indicate mean across 5 independent experiments (~3500 cells per cell line, per experiment), with the shaded regions showing the distribution across measurements. A two-sided Mann–Whitney U-test indicated a significant difference in angular bias (*p = 0.03) and directed speed (**p = 0.008).
Fig. 5
Fig. 5. Cell migration CRISPRi screen identifies genes important for adhesion and migration on 2D surfaces.
a Left, components of inside-out αMβ2 integrin signaling. Right, normalized log2 fold-changes values for most significant sgRNA in the chemotaxis and chemokinesis screens. Error bars represent mean values +/− SEM across n = 28 measurements from 14 independent experiments. The gray shaded region shows the histogram of control sgRNAs. b Representative phase images of cell migration on fibronectin-coated coverslips (ITGB2 sgRNA and control cells). Three fields of view were collected for each cell line. c Representative phase images of cell migration on fibronectin-coated coverslips (FLCN sgRNA, LAMTOR1 sgRNA, and control cells). Two fields of view were collected for each cell line. d Characterization of cell migration phenotypes. Speed was calculated by tracking cell nuclei during migration on fibronectin-coated coverslips. Persistence was inferred from the cell velocity data as described by Metzner et al. (see “Methods”). Measurements represent experiments performed over 2–3 days,  acquired across 32 (sgControl), 10 (sgFLCN), and 14 (sgLAMTOR1) fields of view. Differences were identified using a two-sided Mann–Whitney U-test (***p < 0.001). e Comparison of normalized log2 fold-changes across the pooled CRISPRi cell migration screens of chemotaxis and chemokinesis. ITGB2, FERMT3 and TLN1 genes are identified in red. f Comparison between chemotaxis screen normalized log2 fold-changes and measurements of migration fraction of individual knockdown lines exposed to a serum gradient with 10% hiFBS, for 2 h. The gray data point and dashed lines represent the values obtained for control cells. Error bars represent mean values +/− SEM across independent experiments (8 screen replicates and 4 replicates for stable knockdown lines). g Characterization of cell migration speed following knockdown of GIT2 from nuclei tracking during migration on fibronectin-coated coverslips. Measurements represent experiments performed over 3 days, acquired across 29 fields of view. The data was compared using a two-sided Mann–Whitney U-test (**p < 0.01). For (dg), individual data points represent average values for cells across a single field of view, with the shaded regions showing the distribution of all measurements.
Fig. 6
Fig. 6. Cell migration CRISPRi screen identifies genes important for 3D amoeboid migration.
a Comparison of normalized log2 fold-changes across the pooled CRISPRi cell migration screens of 3D amoeboid migration and chemokinesis. b Comparison of 3D migration normalized log2 fold-changes with measurements of cell speed and migratory persistence via single-cell nuclei tracking. Cells from individual sgRNA knockdown lines were tracked during migration in collagen for 60 min (1 min frame rate). The median cell speed (left) and inferred migratory persistence (right, see “Methods”) are plotted against their measured normalized log2 fold-change from the pooled screen. Error bars represent mean values +/− SEM across independent experiments (6 screen replicates and 4 for experiments using stable knockdown lines). Individual cell line measurements represent experiments performed over 2–5 days, acquired across 10 (sgControl), 7 (sgFLMN1), 7 (sgCORO1A), and 4 (sgITGB2) fields of view. c, d show immunofluorescence localization of FMNL1 and CORO1A in amoeboid-migrating cells in collagen. F-actin was labeled by phalloidin, while DNA was stained by DAPI. Left images are maximum projection composite images; right images show grayscale localization of formin-like 1 (c) and coronin 1A (d). Red arrows indicate the approximate direction of cell migration based on cell shape and a more intense phalloidin intensity expected at the cell front.
Fig. 7
Fig. 7. Summary of pathways and genes identified across cell migration CRISPRi screens.
a Pathways enriched in cell migration screens. Since the majority of gene knockdowns lead to poorer migratory phenotypes (i.e., negative log2 fold-changes), disruption of the noted pathways are associated with poorer migratory success. Due to the correlation across the chemotaxis and chemokinesis screens, their data was combined in this analysis (green). Pathways enriched in the 3D amoeboid migration screen are shown in yellow. p values estimate the statistical significance of gene set enrichment, calculated using a one-sided permutation test and adjusted for multiple comparisons using the Benjamini–Hochberg procedure. b Summary of the genes identified across the cell migration screens. Genes were identified from the collated chemotaxis/chemokinesis screens (green) and 3D amoeboid screen (yellow), with the shading intensity indicating the false discovery rate threshold that each gene fell into (adjusted p < 0.05 or <0.3). Empty column entries (i.e. white entries) indicate that the gene was not identified as significant. Genes associated with transcription, translation, and gene regulation, or genes that perturbed the processes of either proliferation or differentiation with absolute log2 fold-changes values larger than 0.7 were excluded.
Fig. 8
Fig. 8. 2D and 3D migration show context specific sensitivities to integrin expression and recycling.
a Summary of normalized log2 fold-changes of the most significant sgRNA for protein trafficking genes in the chemotaxis and chemokinesis screens (green), and the 3D amoeboid screen (yellow). Error bars represent mean values +/− SEM (green: n = 28 measurements from 14 independent experiments; yellow: n = 7 measurements from 6 independent experiments). Shared gene products for the protein complexes (retromer/ retriever and HOPS/CORVET) are indicated by a solid black line. The histograms and shaded region identify the distribution of the control sgRNAs. b Immunofluorescence flow cytometry of CD11b (ITGAM gene; left column) and CD18 (ITGB2 gene; right column). Histograms show surface distribution in control sgRNA (black, solid), ITGB2 (blue, solid), SNX17 (blue, dashed), VPS29 (blue, dash-dot). Shaded histograms indicate cellular autofluorescence from a non-targeting isotype control antibody. c Summary of normalized log2 fold-changes of the most significant sgRNA for integrin genes in the chemotaxis and chemokinesis screens (green), and the amoeboid screen (yellow). Integrin genes whose transcription is not detected in HL-60 cells were excluded. Error bars represent mean values +/− SEM (green: n = 28 measurements from 14 independent experiments; yellow: n = 7 measurements from 6 independent experiments). The histogram and shaded region identify the distribution of the control sgRNAs. d Characterization of cell migration phenotypes in integrin knockdown lines. Speed was calculated by tracking cell nuclei during migration in a collagen ECM. Persistence was inferred from the cell velocity data as described by Metzner et al. (see “Methods”). Individual data points represent mean values for cells across a single field of view, with the shaded regions showing the distribution of all measurements. Measurements represent experiments performed over 2–3 days, acquired across 10 (sgControl), 4 (sgITGB2), and 5 (sgITGA1) fields of view. A two-sided Mann-Whitney U test found the persistence of the ITGA1 knockdown line differed from control cells (*p = 0.002).

Similar articles

Cited by

References

    1. Sender R, Milo R. The distribution of cellular turnover in the human body. Nat. Med. 2021;27:45–48. - PubMed
    1. Evrard M, et al. Developmental analysis of bone marrow neutrophils reveals populations specialized in expansion, trafficking, and effector functions. Immunity. 2018;48:364–379.e8. - PubMed
    1. De Filippo, K. & Rankin, S. M. The secretive life of neutrophils revealed by intravital microscopy. Front. Cell Dev. Biol. 8, 603230 (2020). - PMC - PubMed
    1. Liew PX, Kubes P. The neutrophil’s role during health and disease. Physiol. Rev. 2019;99:1223–1248. - PubMed
    1. Németh T, Sperandio M, Mócsai A. Neutrophils as emerging therapeutic targets. Nat. Rev. Drug Discov. 2020;19:253–275. - PubMed

Publication types