. 2023 Sep 18;14(1):5773.
doi: 10.1038/s41467-023-41370-y.

Aedes aegypti Argonaute 2 controls arbovirus infection and host mortality

Affiliations

Aedes aegypti Argonaute 2 controls arbovirus infection and host mortality

Shengzhang Dong et al. Nat Commun. .

Abstract

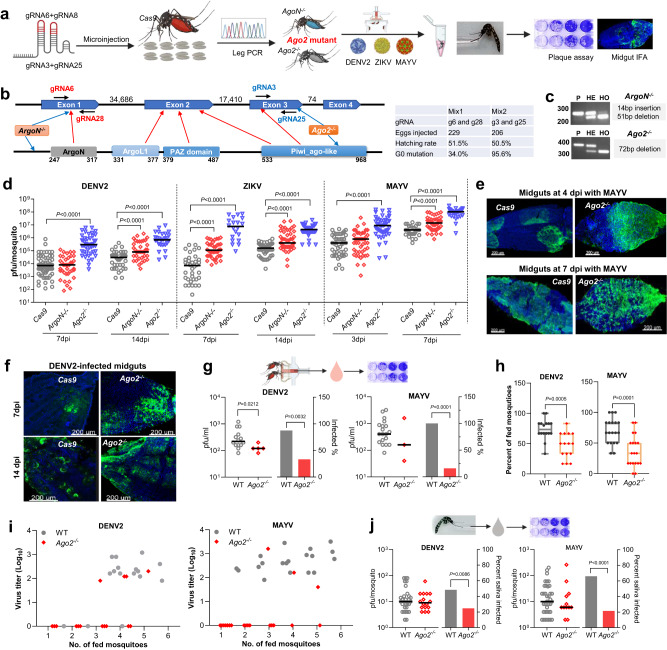
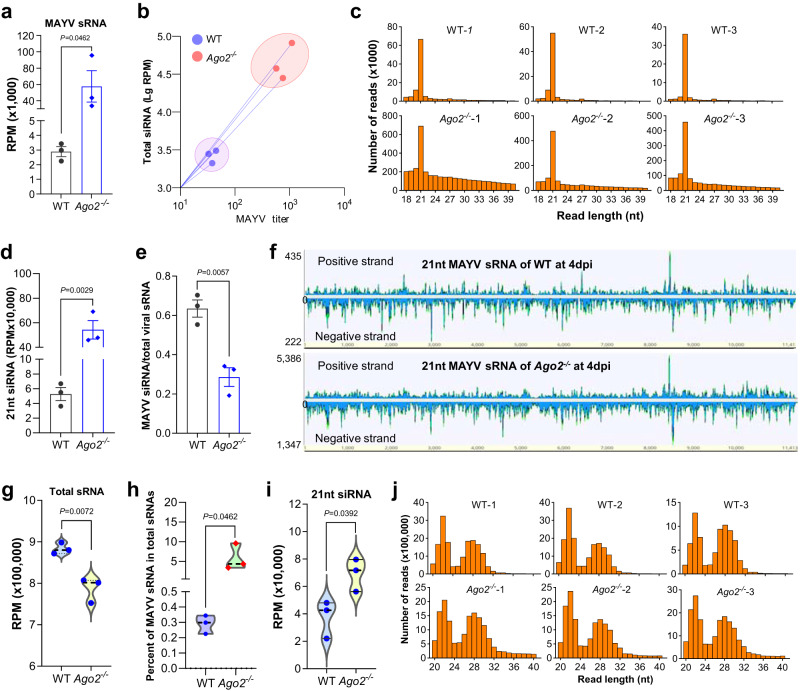
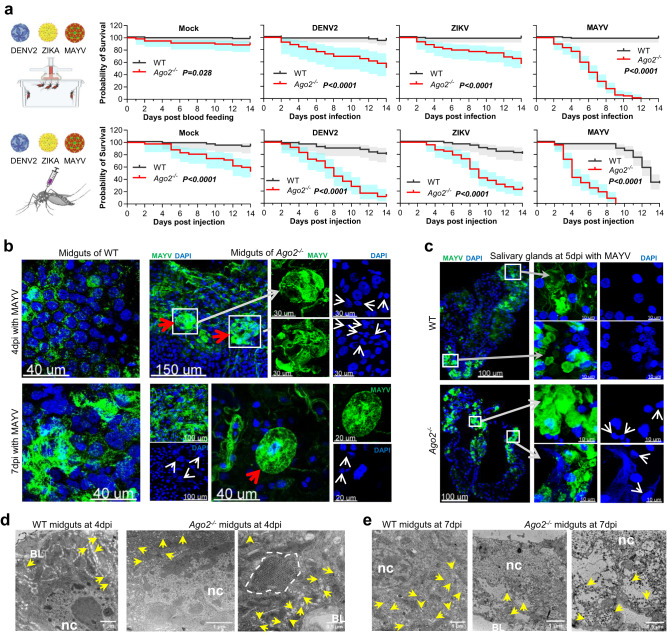
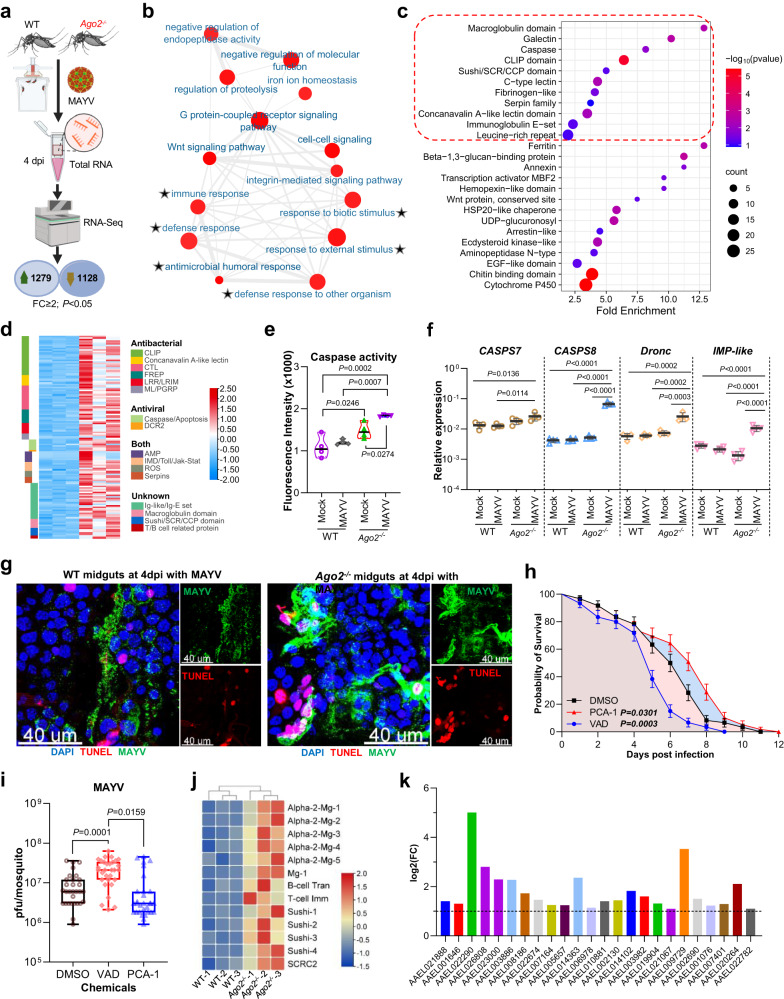
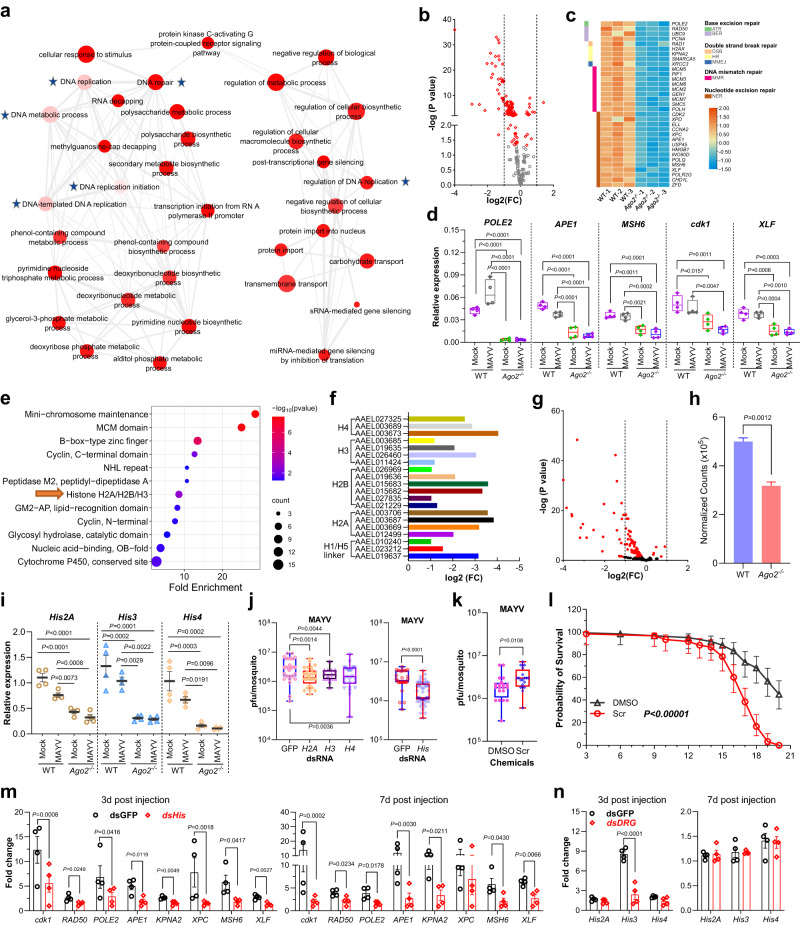
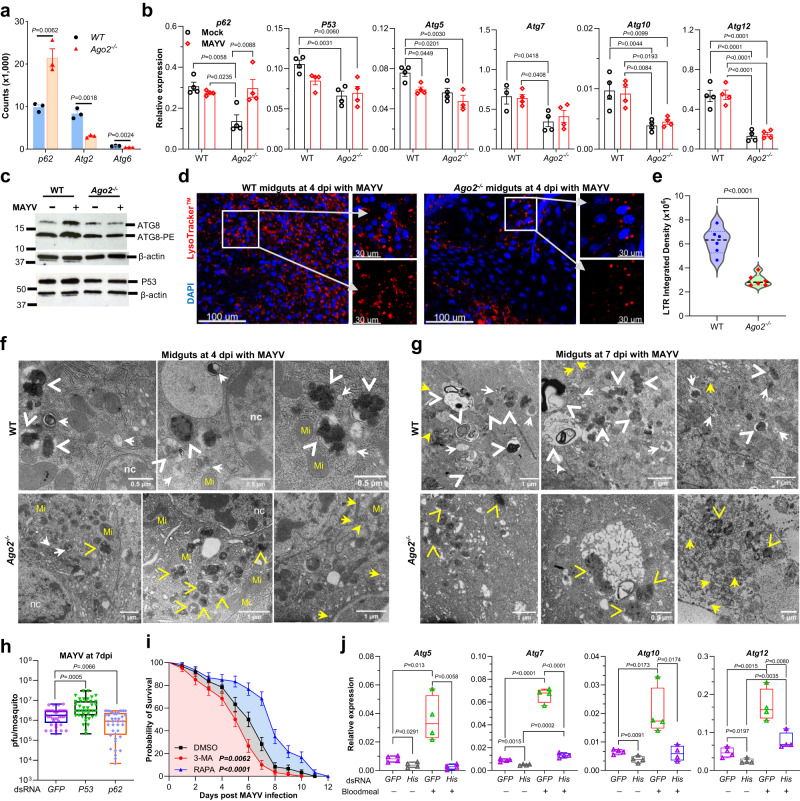
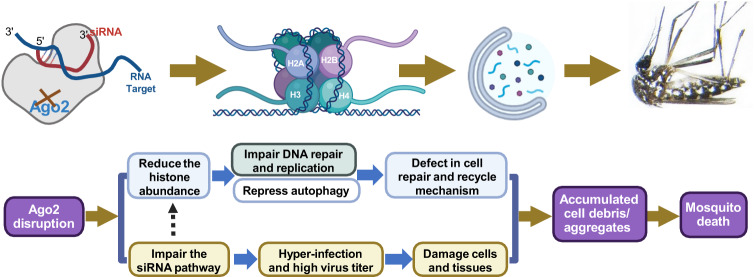
Ae. aegypti mosquitoes transmit some of the most important human viral diseases that are responsible for a significant public health burden worldwide. The small interfering RNA (siRNA) pathway is considered the major antiviral defense system in insects. Here we show that siRNA pathway disruption by CRISPR/Cas9-based Ago2 knockout impaired the mosquitoes' ability to degrade arbovirus RNA leading to hyper-infection accompanied by cell lysis and tissue damage. Ago2 disruption impaired DNA repair mechanisms and the autophagy pathway by altering histone abundance. This compromised DNA repair and removal of damaged cellular organelles and dysfunctional aggregates promoted mosquito death. We also report that hyper-infection of Ago2 knockout mosquitoes stimulated a broad-spectrum antiviral immunity, including apoptosis, which may counteract infection. Taken together, our studies reveal novel roles for Ago2 in protecting mosquitoes from arbovirus infection and associated death.


Conflict of interest statement

The authors declare no competing interests.

Figures

Fig. 1
Fig. 1. Generation of Ago2 knockout Ae. aegypti lines and the effect of Ago2 disruption on arbovirus infection and transmission.
a flowchart of experiment design. b gene structure of Ago2, predicted functional domains, and guide RNA (gRNA) design for CRISPR/Cas9. The table shows data from generating Ago2 knockout lines. c Ago2 amplification in Ago2 knockout lines. P, parental line Cas9; HE, heterozygous mutants; HO, homozygous mutants. d virus titer in Ago2 knockout (Ago2−/− and ArgoN−/−) and Cas9 mosquitoes on various days post-infection (dpi) with DENV2, ZIKV, or MAYV. IFA detection of MAYV (e) and DENV2 (f) antigen in midguts of Cas9 and Ago2−/− mosquitoes at different days post virus infection. MAYV and DENV2 were detected with the corresponding monoclonal antibody (green). Nuclei were stained with DAPI (blue). g virus titer and infection prevalence in the feeding solution collected from a feeder exposed to a group of females at 14 dpi with DENV2 or 5 dpi with MAYV. The Liverpool strain was used as a control (WT). For DENV2 infection, n = 16 for WT and n = 15 for Ago2−/−; for MAYV infection, n = 19 for both WT and Ago2−/−. h percentage of the fed mosquitoes in each group of females at 14 dpi with DENV2 or 5 dpi with MAYV. Data were presented as box and whiskers (Min to Max). i virus titer plotted against the number of the fed mosquitoes in each cup. j virus titer and infection prevalence of individual saliva samples collected from Ago2−/− and WT at 14 dpi with DENV2 or 5 dpi with MAYV. For DENV2 infection, n = 62 for WT and n = 61 for Ago2−/−; for MAYV infection, n = 56 for both WT and Ago2−/−. Each experiment comprised at least two biological replicates, and the data were pooled for generating the graphs. Virus titers were determined by plaque assay, and horizontal lines indicate the medians of the virus titer (d, g and j). P values were determined by an unpaired two-sided Mann-Whitney test for virus titer, an unpaired two-sided Fisher’s exact test for infection prevalence, or an unpaired two-sided t-test for (h). Source data are provided as a Source Data file.
Fig. 2
Fig. 2. Impact of Ago2 disruption on production of MAYV- and mosquito-derived small RNAs.
a total number (reads per million mapped reads, RPM) of MAYV sRNAs in Ago2−/− mutants and WT mosquitoes at 4 days post-infection (dpi) as determined by sRNA sequencing. Three replicates were performed for each sample. b correlation between the abundance of sRNAs and titer of MAYV in Ago2−/− mutants and WT mosquitoes as determined by principal component analysis (PCA). c distribution by length of sRNAs mapping to the MAYV genome. d number of 21-nt siRNAs mapped to the MAYV genome. e the ratio of siRNA-sized (21 nt) MAYV reads to the total MAYV sRNA (18nt to 40nt) reads. f distribution and the relative abundances of 21-nt MAYV siRNAs in the MAYV genome. g number of total sRNAs mapped to the Ae. aegypti genome. h percent of MAYV sRNAs in the total sRNAs in mosquitoes. i number of 21-nt siRNAs mapped to the Ae. aegypti genome. j length distribution of the mosquito sRNAs. P values were determined by using an unpaired two-sided t-test (n = 3) with GraphPad Prism. Data are presented as mean ± SEM (a, d and e). Source data are provided as a Source Data file.
Fig. 3
Fig. 3. Effect of arbovirus infection on mosquito death and tissue/cell damage in Ago2−/− mutants.
a survival curves of Ago2−/− and wild-type (WT) females that ingested a blood meal containing DENV2, ZIKV, or MAYV or were mock-infected (given C6/36 cell culture medium), or were injected with DENV2, ZIKV, or MAYV or mock-infected medium. P values between Ago2−/− mutants and WT mosquitoes were determined using the logrank (Mantel-Cox) test. Each experiment comprised at least three biological replicates. The error bands were indicated by the shaded region. IFA detection with the anti-MAYV monoclonal antibody (green) of MAYV in midguts (b) and salivary glands (c) of Ago2−/− and WT females at various days post-infection (dpi). Nuclei were stained with DAPI (blue). The zoomed areas are indicated as white boxes and arrows. White arrows indicate abnormal nuclei, and red arrows indicate strong fluorescence with a “ball” shape. Ultrastructural TEM images showing cross-sections of midgut tissue of Ago2−/− mutants and WT mosquitoes at 4 dpi (d) and 7 dpi (e) with MAYV. Yellow arrows indicate individual virion; white dotted lines outline a cluster of virions. Scale bars are indicated on each image. Abbreviations: BL basal lamina, nc nucleus. The IFA and TEM images in (be) are representative of three biologically independent samples. Source data are provided as a Source Data file.
Fig. 4
Fig. 4. Transcriptomic analysis of antiviral immune signaling in Ago2−/− mutants upon MAYV infection.
a flowchart illustrating the design and outcome of RNAseq experiments comparing transcriptome changes in Ago2−/− mutants and WT mosquitoes. DE genes, differentially expressed genes. n = 3 biological replicates. b interaction network illustrating the upregulated gene families in Ago2−/− mutants. The light color indicates the small P-value (one-sided Fisher’s exact test), and the small size of the bubble indicates the few genes in the GO term. The immunity- and defense-related GOs are indicated by asterisks. c fold enrichment of the significantly upregulated gene families in Ago2−/− mutants. The immunity-related gene families are outlined red. d heatmap illustrating transcriptome changes in the upregulated immunity genes in Ago2−/− mutants. e detection of caspase activity in midguts of Ago2−/− and WT females. Data are presented as mean ± SD (n = 4). f confirmation by qPCR of the upregulated expression of caspase and apoptosis genes in midguts of Ago2−/− females. Data are presented as mean ± SD (n = 4). g TUNEL assay to detect apoptotic cells (red) in midguts of Ago2−/− and WT females. MAYV antigen is indicated by green, and nuclei are in blue. h survival curves for the MAYV-infected WT females that were fed with apoptosis inducer PAC-1 or apoptosis inhibitor Z-VAD-FMK (VAD) or an equal amount of DMSO in 10% sucrose solution. Data are presented as percents ± SE (n = 3). i virus titer in WT females treated with PAC-1 or VAD at 7 dpi with MAYV. Data were presented as box and whiskers (Min to Max), n = 30. j upregulated immune genes related to B-cell, T-cell, complement (Suchi), or macroglobulin (Mg) in Ago2−/− mutants. k upregulated immunoglobulin (Ig)-like genes in Ago2−/− mutants. P values were determined by one-way ANOVA (e and f), an unpaired two-sided Mann-Whitney test (i), or a logrank (Mantel-Cox) test (h). Source data are provided as a Source Data file.
Fig. 5
Fig. 5. Transcriptomic analysis of DNA repair and histone genes in Ago2−/− mutants upon MAYV infection and effect of histone reduction on virus infection and mosquito mortality.
a interaction network illustrating downregulated gene families in Ago2−/− mutants. The light color indicates small P-value (one-sided Fisher’s exact test), and the small size indicates few genes in the GO term. GOs related to DNA repair and replication are indicated by asterisks. b volcano plot illustrating fold changes in DNA repair genes (DRGs) in Ago2−/− mutants. c heatmap illustrating transcriptome changes in upregulated DRGs in Ago2−/− mutants. d qPCR detecting expression of downregulated DRGs in Ago2−/− carcasses. e fold enrichment of downregulated gene families in Ago2−/− mutants. f downregulated histone genes in MAYV infected Ago2−/− mutants. g volcano plot illustrating fold changes of histones-related genes in Ago2−/− mutants. h overall histone level in MAYV infected Ago2−/− and WT mosquitoes. i qPCR detecting expression of histone genes in carcasses of Ago2−/− and WT mosquitoes at 4 days post-infection (n = 4). j virus titer in histone dsRNA-injected WT females at 7 dpi as determined by plaque assay. Left: n = 35 (dsGFP), n = 28 (dsHis2A), n = 15 (dsHis3) and n = 26 (dsHis4). Righ: n = 29 (dsGFP) and n = 51 (dsHis). k virus titer in WT mosquitoes treated with histone deacetylase inhibitor Scriptaid (Scr), n = 20. l survival curves of MAYV-infected WT females that were fed with Scriptaid or DMSO in 10% sucrose solution. Data are represented as percents ± SE (n = 3). qPCR detecting DRG expression (m) and histone expression (n) in WT females that were injected with dsHis (mixture of dsRNAs of His2A, His3 and His4) or dsDRG (mixture of dsRNAs of cdk1, RAD50, APE1 and KPNA2) at 3- and 7-days post injection, respectively. n = 4. P values were determined by a one-way ANOVA (d, i), an unpaired two-sided t-test (h), two-way ANOVA with multiple comparisons (m and n), a logrank (Mantel-Cox) test (l), or an unpaired two-sided Mann-Whitney test (j, k). Data are presented as mean ± SEM (h, i, m and n), and box and whiskers (Min to Max) (d and j) from 4 replicates. Source data are provided as a Source Data file.
Fig. 6
Fig. 6. Effect of Ago2 disruption and histone loss on autophagy in mosquitoes upon MAYV infection.
a upregulated p62 and downregulated autophagy-related genes (Atg) in the transcriptome of Ago2−/− mutants. n = 3. b expression of p62, P53 and Atg genes in the carcasses of Ago2−/− and WT females at 4 days post-infection (dpi) with MAYV, as detected by qPCR. n = 4 biological replicates. c western blot showing protein levels of ATG8, ATG8-phosphatidylethanolamine (ATG8-PE) and P53 in Ago2−/− and WT females at 4 dpi with MAYV; β-actin was used as a loading control. Western blots were repeated at least three times, and representative results are shown. Lysotracker Red (LTR) staining (d) showing the impairment of autophagy and LTR integrated density (e) in midguts of Ago2−/− females at 4 dpi with MAYV. Nuclei were stained with DAPI (blue). n = 6 biologically independent samples. Autolysosomes (arrowheads) and autophagosomes (white arrows) were detected by TEM in the midguts of Ago2−/− and WT females at 4 dpi (f) and 7 dpi (g) with MAYV. Yellow arrows indicate virions, and yellow arrowheads indicate cell debris. Abbreviations: Mi mitochondria, nc nucleus. n = 3 biologically independent samples. h virus titer in P53- or p62- dsRNA-injected WT females at 10 dpi with MAYV as determined by plaque assay. dsRNA for GFP was injected as a control. Data were presented as box and whiskers (Min to Max), n = 41 (dsGFP), n = 40 (dsP53 and dsp62). i survival curves of the MAYV-infected WT females that were fed with autophagy inhibitor 3-MA or inducer rapamycin (RAPA) or an equal amount of DMSO in 10% sucrose solution. Data were presented as percents ± SE (n = 3). j qPCR detecting the expression of a panel of Atg genes in histone dsRNA-injected WT mosquitoes at 3 days post-injection and 4 days post-blood-feeding. n = 4 biological replicates. P values were determined by an unpaired two-sided t-test (a, e and j), one-way ANOVA for (b), an unpaired two-sided Mann-Whitney test for (h), and a logrank (Mantel-Cox) test (i). Data are represented as mean ± SEM (a and b). Source data are provided as a Source Data file.
Fig. 7
Fig. 7
A proposed model summarizing arboviruses-induced death in Ago2-deficient Ae. aegytpi.

Similar articles

Cited by

References

    1. Stanaway JD, et al. The global burden of dengue: an analysis from the Global Burden of Disease Study 2013. Lancet Infect. Dis. 2016;16:712–723. doi: 10.1016/S1473-3099(16)00026-8. - DOI - PMC - PubMed
    1. Bhatt S, et al. The global distribution and burden of dengue. Nature. 2013;496:504–507. doi: 10.1038/nature12060. - DOI - PMC - PubMed
    1. Messina JP, et al. The current and future global distribution and population at risk of dengue. Nat. Microbiol. 2019;4:1508–1515. doi: 10.1038/s41564-019-0476-8. - DOI - PMC - PubMed
    1. Monath TP. Dengue: the risk to developed and developing countries. Proc. Natl Acad. Sci. USA. 1994;91:2395–2400. doi: 10.1073/pnas.91.7.2395. - DOI - PMC - PubMed
    1. Senior K. Vector-borne diseases threaten Europe. Lancet Infect. Dis. 2008;8:531–532. doi: 10.1016/S1473-3099(08)70192-0. - DOI - PubMed

Publication types

Substances