. 2023 Sep 18;14(1):5778.
doi: 10.1038/s41467-023-41470-9.

Metabolic Reprogramming via ACOD1 depletion enhances function of human induced pluripotent stem cell-derived CAR-macrophages in solid tumors

Affiliations

Metabolic Reprogramming via ACOD1 depletion enhances function of human induced pluripotent stem cell-derived CAR-macrophages in solid tumors

Xudong Wang et al. Nat Commun. .

Abstract

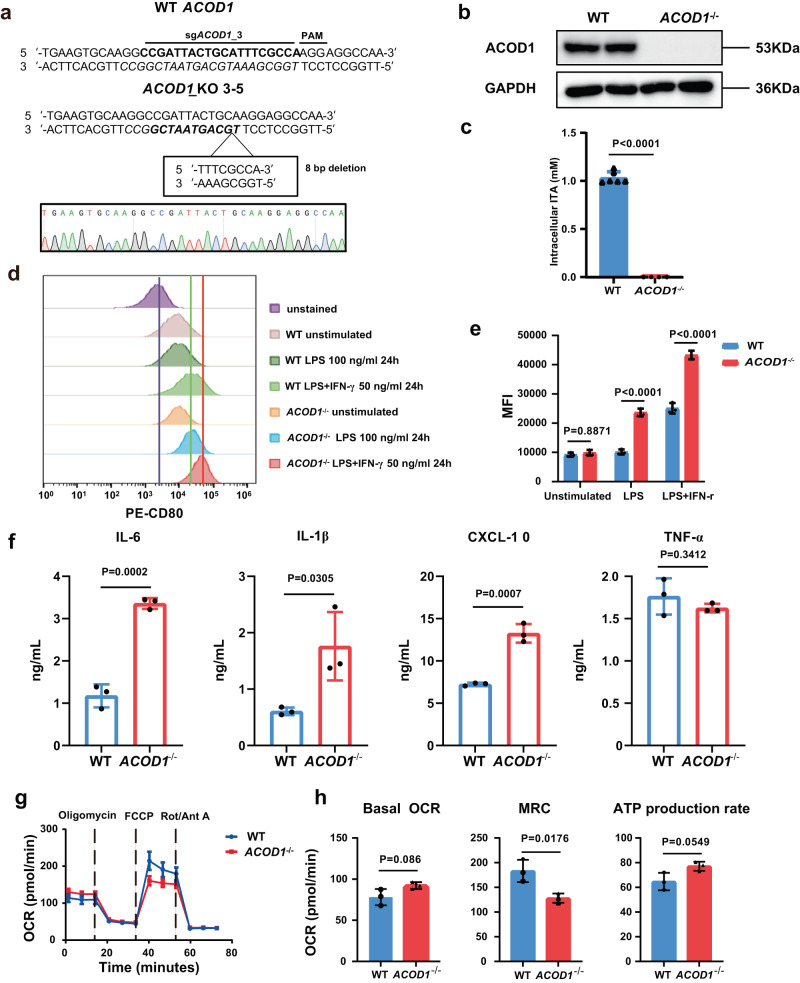
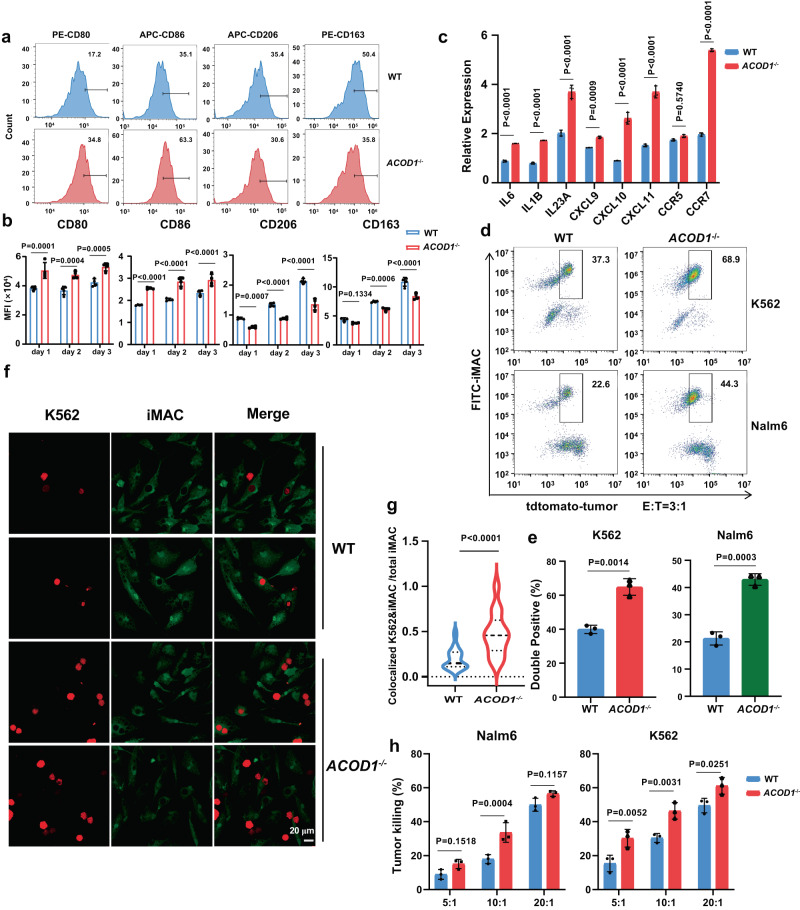
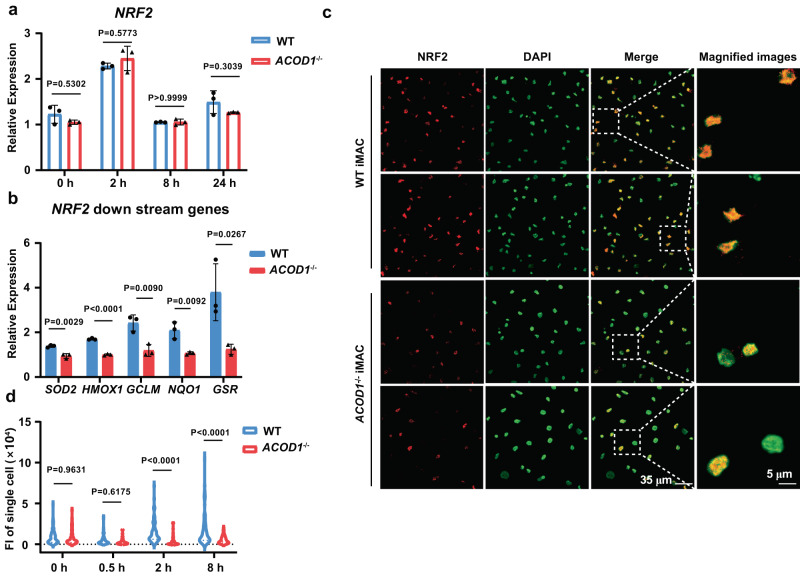
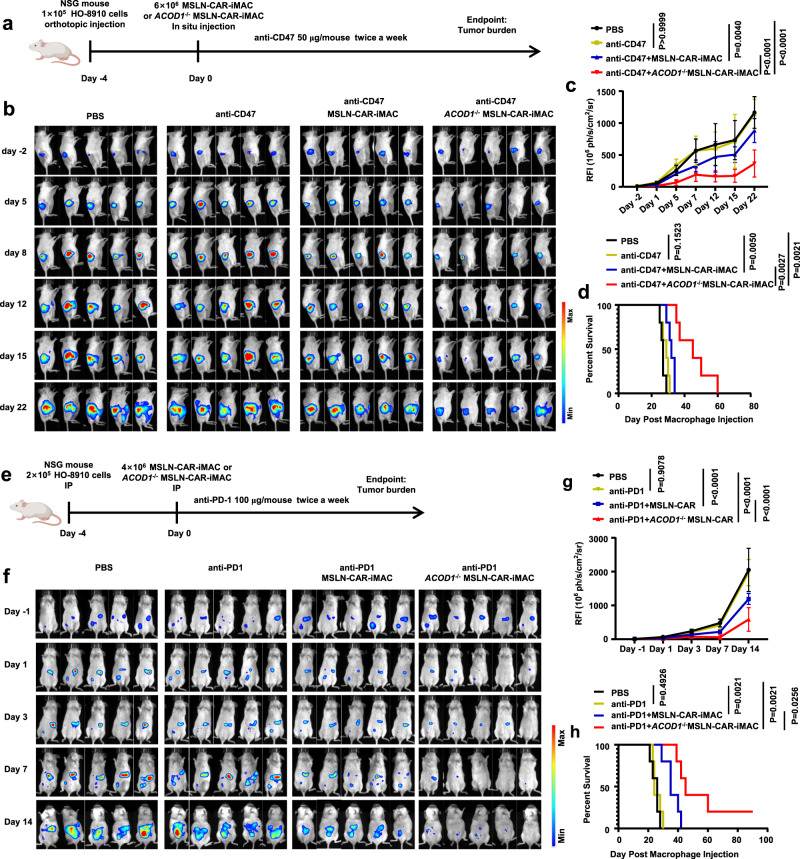
The pro-inflammatory state of macrophages, underpinned by their metabolic condition, is essentially affecting their capacity of combating tumor cells. Here we find, via a pooled metabolic gene knockout CRISPR screen that KEAP1 and ACOD1 are strong regulators of the pro-inflammatory state in macrophages. We show that ACOD1 knockout macrophages, generated in our induced pluripotent stem cell-derived CAR-macrophage (CAR-iMAC) platform, are strongly and persistently polarized toward the pro-inflammatory state, which manifests in increased reactive oxygen species (ROS) production, more potent phagocytosis and enhanced cytotoxic functions against cancer cells in vitro. In ovarian or pancreatic cancer mouse models, ACOD1-depleted CAR-iMACs exhibit enhanced capacity in repressing tumors, leading to increased survival. In addition, combining ACOD1-depleted CAR-iMACs with immune checkpoint inhibitors (ICI), such as anti-CD47 or anti-PD1 antibodies, result in even stronger tumor suppressing effect. Mechanistically, the depletion of ACOD1 reduces levels of the immuno-metabolite itaconate, allowing KEAP1 to prevent NRF2 from entering the nucleus to activate an anti-inflammatory program. This study thus lays down the proof of principle for targeting ACOD1 in myeloid cells for cancer immunotherapy and introduces metabolically engineered human iPSC-derived CAR-iMACs cells with enhanced polarization and anti-tumor functions in adoptive cell transfer therapies.


Conflict of interest statement

J.Z. is a scientific co-founder of CellOrigin. The remaining authors declare no competing interests.

Figures

Fig. 1
Fig. 1. A CRISPR screen identified KEAP1 deletion abrogated LPS and IFN-γ induced pro-inflammatory activation in macrophages.
a A schematic diagram of the pooled CRISPR screen of metabolic genes in THP1-induced macrophages (tMAC). b A volcano plot displaying sgRNA-targeted genes enriched in the CD80high (blue) and CD80low (red) populations. c The protein level of KEAP1 in WT and KEAP1-deficient tMACs. d, e Flow cytometry plots and quantification of CD80 expression on WT and KEAP1-deficient tMACs after LPS and IFN-γ stimulation for 0, 2, 8, and 24 h. e n = 3 biologically independent samples. Statistics by two-way ANOVA test. (8 h, P < 0.0001; 24 h, P < 0.0001) f qRT-PCR analysis of IL6, IL1B, CXCL9, and CXCL10 expression in WT and KEAP1-deficient tMACs after LPS and IFN-γ stimulation at different time points (n = 3 biologically independent samples). Statistics by two-way ANOVA test. e, f The data were displayed as mean ± SD. Source data are provided as a Source Data file.
Fig. 2
Fig. 2. ACOD1 deletion promoted pro-inflammatory activation in THP1-induced macrophages.
a The relative expression of ACOD1 in WT and sgACOD1 transduced THP1-induced macrophages (tMAC) with LPS and IFN-γ stimulation at the indicated time points (n = 3 biologically independent samples). Statistics by two-way ANOVA test. (Day 0, P < 0.0001; Day 1, P < 0.0001; Day 2, P = 0.4529) b The protein level of ACOD1 in WT and sgACOD1-transduced cells after LPS and IFN-γ stimulation for 24 h. This experiment has been repeated for three times with similar results. c, d Flow cytometry plots and quantification of CD80 expression in unstimulated, WT, and sgACOD1 transduced tMACs with indicated treatments (d, n = 3 biologically independent samples). Statistics by two-way ANOVA test. The tMACs were stimulated by 50 ng/mL LPS and 50 ng/mL IFN-γ for 24 h, then withdrawn from the stimulation and further cultured for 24 h (Day 1) or 48 h (Day 2). e qRT-PCR for mRNA expression of pro-inflammatory genes in WT and sgACOD1 transduced tMACs after LPS and IFN-γ stimulation at different time points (n = 3 biologically independent samples). Statistics by two-way ANOVA test. (IL6: 2 h, P = 0.0211; 8 h, P < 0.0001; 24 h, P < 0.0001. CXCL9: 8 h, P < 0.0001; 24 h, P = 0.9755. CXCL10: 8 h, P < 0.0001; 24 h, P = 0.0026. CXCL11: 8 h, P < 0.0001; 24 h, P = 0.0075.) a, d, e Data was shown as mean ± SD. Source data are provided as a Source Data file.
Fig. 3
Fig. 3. ACOD1-deleted human iPSC-derived macrophages demonstrated enhanced pro-inflammatory activation.
a Comparison of the DNA sequence in the ACOD1 knockout iPSC clone (by Sanger sequencing) with the ACOD1 WT DNA sequence showed an 8 bp deletion in the sgRNA targeted region. b Western blotting for ACOD1 expression in WT and ACOD1-/- iPSC-derived macrophages (iMAC) after LPS and IFN-γ stimulation for 24 h. This experiment has been repeated for three times with similar results. c Mass spectrometry quantification of the cellular itaconate (ITA) concentration in WT and ACOD1-/- iMACs after LPS and IFN-γ stimulation for 24 h (WT, n = 6 biologically independent samples; ACOD1-/-, n = 4 biologically independent samples). Statistics by unpaired t test. (P < 0.0001) d, e CD80 expression on WT and ACOD1-/- iMACs and quantification was determined by flow cytometry under different treatments, including 100 ng/mL LPS or 50 ng/mL LPS plus 50 ng/mL IFN-γ stimulation for 24 h (e, n = 3 biologically independent samples). Statistics by two-way ANOVA test. (unstimulated, P = 0.8871; LPS, P < 0.0001; LPS + IFN-γ, P < 0.0001) f The levels of the indicated cytokines/chemokines in the medium of iMAC culturing were determined 24 h post IFN-γ and LPS challenge (n = 3 biologically independent samples). Statistics by unpaired t test. g Seahorse extracellular metabolic flux analysis of oxygen consumption rates (OCR). LPS and IFN-γ stimulated WT or ACOD1-/- iMACs were sequentially treated with oligomycin (1.5 μM), fluorcarbonylcyanide phenylhydrazone (FCCP; 2 μM), and rotenone and antimycin A (0.5 μM each) (n = 3). h Basal OCR, maximal respiration capacity (MRC), and ATP production rate were calculated with Wave 2.4.0. (n = 3 biologically independent samples). Statistics by unpaired t test. c, e, f, g and h Data was shown as mean ± SD. Source data are provided as a Source Data file.
Fig. 4
Fig. 4. ACOD1-/- iMACs had stronger phagocytosis and anti-cancer cell function.
a CD80, CD86, CD163, and CD206 expression in WT or ACOD1-/- iMACs after co-cultured with Nalm6 (E:T = 5:1) for 24 h were measured by flow cytometry and displayed as histograms. b Quantification of mean fluorescence intensity (MFI) measured by flow cytometry after co-cultured with Nalm6 (E:T = 5:1) for 24 h (day 1), 48 h (day 2), or 72 h (day 3) (n = 4 biologically independent samples). Statistics by two-way ANOVA test. (CD80: day 1, P = 0.0001; day 2, P = 0.0004; day 3, P = 0.0005. CD86: day 1, P < 0.0001; day 2, P < 0.0001; day 3, P < 0.0001. CD206: day 1, P = 0.0007; day 2, P < 0.0001; day 3, P < 0.0001. CD163: day 1, P = 0.1334; day 2, P = 0.0006; day 3, P < 0.0001.) c qRT-PCR for mRNA expression of pro-inflammatory genes in WT and ACOD1-/- iMACs after co-cultured with Nalm6 (E:T = 5:1) for 24 h (n = 3 biologically independent samples). Statistics by two-way ANOVA test. (IL6, IL1B, IL23A, CXCL10, CXCL11 and CCR7, P < 0.0001. CXCL9, P = 0.0009.) d, e Representative flow cytometry plots and quantification of double positive iMACs after WT and ACOD1-/- iMACs were co-cultured with Nalm6 and K562 cells (E:T = 3:1) for 24 h (e, n = 3 biologically independent samples). Statistics by unpaired t test. f, g Representative confocal images and quantification of K562 cells phagocytosed by WT or ACOD1-/- iMACs after co-cultured for 24 h (g, WT, n = 27 views from 3 biologically independent samples; ACOD1-/-, n = 14 views from 3 biologically independent samples). Statistics by unpaired t test. (P < 0.0001) Representative confocal images were obtained using the Olympus FV3000 microscope and ImageJ software. The number of colocalized K562&iMAC and total iMAC in one view was used to calculate the ratio. h Luciferase assays showing iMAC cytotoxicity against cancer cells when co-cultured with Nalm6 or K562 cells for 24 h (E:T = 5:1, 10:1, or 20:1) (n = 3 biologically independent samples). Statistics by two-way ANOVA test. The luciferase gene has been introduced by lentivirus to tumor cells and expressed in tumor cells, so that tumor cell viability can be measured by D-luciferin sodium salt in a luciferase assay. b, c, g, e, h Data was shown as mean ± SD. Source data are provided as a Source Data file.
Fig. 5
Fig. 5. ACOD1 deletion decreased nucleolar NRF2 protein expression and its activity in iMACs.
a qRT-PCR for mRNA expression of NRF2 in WT and ACOD1-/- iMACs after LPS and IFN-γ stimulation for 2, 8, or 24 h (n = 3 biologically independent samples). Statistics by two-way ANOVA test. b qRT-PCR for mRNA expression of NRF2 downstream genes in WT and ACOD1-/- iMACs after LPS and IFN-γ stimulation for 24 h (n = 3 biologically independent samples). Statistics by two-way ANOVA test. (SOD2, P = 0.0029; HMOX1, P < 0.0001; GCLM, P = 0.009; NQO1, P = 0.0092; GSR, P = 0.0267) c, d Representative confocal images and quantification of the NRF2 protein in WT and ACOD1-/- iMACs after LPS and IFN-γ stimulation for 2 h, fluorescence intensity (FI) of single cells was counted (d, n = 60 cells from 3 biologically independent samples each group). Statistics by two-way ANOVA test. (2 h, P < 0.0001; 8 h, P < 0.0001) This experiment has been repeated for three times with similar results. Representative confocal images were obtained using the Olympus FV3000 microscope. a, b, d Data was shown as mean ± SD. Source data are provided as a Source Data file.
Fig. 6
Fig. 6. ACOD1 deletion promoted anti-cancer cell activity of iMACs against solid tumors in vitro and in vivo.
a, b The expression and quantification of CD80, CD86, CD163, and CD206 in MSLN-CAR-iMACs or ACOD1-/- MSLN-CAR-iMACs after co-cultured with HO-8910 cells (E:T = 5:1) for 24 h were measured by flow cytometry and displayed as histograms (b, n = 3 biologically independent samples). statistics by two-way ANOVA test. (CD80, P = 0.0035; CD86, P = 0.0324; CD206, P < 0.0001; CD163, P < 0.0001) c Luciferase assays for CAR-iMAC cytotoxicity activity against cancer cells when co-cultured with HO-8910 cells for 24 h (E:T = 5:1, 10:1, or 20:1) (5:1, n = 3; 10:1, n = 5; 20:1, n = 5 biologically independent samples). statistics by two-way ANOVA test. (5:1, P = 0.2969; 10:1, P < 0.0001; 20:1, P < 0.0001) d Luciferase assays for CAR-iMAC cytotoxicity activity against cancer cells with or without 4-Octyl Itaconate (4-OI) addition when co-cultured with HO-8910 cells for 24 h (n = 3 biologically independent samples) (E:T = 10:1). Statistics by one-way ANOVA test. (MSLN(-) vs MSLN(+), P < 0.0001; ACOD1-/- MSLN(-) vs ACOD1-/- MSLN(+), P < 0.0001; MSLN(-) vs ACOD1-/- MSLN(-), P = 0.0002; MSLN(+) vs ACOD1-/- MSLN(+), P = 0.00021) iMACs were pre-treated with 4-OI (250 μM) or DMSO control for 3 h before challenge with LPS plus IFN-γ (50 ng/mL each) for 24 h. e Luciferase assays for MSLN-CAR-iMAC cytotoxicity activity against cancer cells with or without sulforaphane (SFN) (10 μM) when co-cultured with HO-8910 cells for 24 h (E:T = 10:1) (n = 3 biologically independent samples). Statistics by one-way ANOVA test. f Luciferase assays for the cytotoxicity activity of the co-culture supernatant with IgG control, neutralizing antibody (10 μg/mL) of IFN-γ or TNF-α (n = 3 biologically independent samples). Statistics by two-way ANOVA test. The supernatant was collected after iMACs were co-cultured with HO-8910 cells for 24 h (E:T = 10:1). g The levels of the indicated cytokines/chemokines in the medium of iMAC-HO-8910 co-culture system were determined 24 h post IFN-γ and LPS challenge (n = 3 biologically independent samples). Statistics by unpaired t test. (IL-6, P < 0.0001; IL-1β, P = 0.0016; CXCL-10, P = 0.0003; TNF-α, P = 0.2075; IFN-γ, P = 0.2026) h Luciferase assays for MSLN-CAR-iMAC cytotoxicity activity against cancer cells with or without N-Acetyl-L-cysteine (NAC) (2.5 mM) when co-cultured with HO-8910 cells for 48 h (E:T = 10:1) (n = 3 biologically independent samples). Statistics by one-way ANOVA test. (MSLN(-) vs MSLN(+), P < 0.0001; ACOD1-/- MSLN(-) vs ACOD1-/- MSLN(+), P < 0.0001; MSLN(-) vs ACOD1-/- MSLN(-),P < 0.0001; MSLN(+) vs ACOD1-/- MSLN(+), P < 0.0001) (b-h) Data was shown as mean ± SD. i A diagram of the in vivo treatment scheme. j In Vivo Imaging system (IVIS) images showing progression of tumor in the above conditions (n = 5 per group). k Tumor burden on day −1, 7, 11, and 14 was quantified and displayed as mean ± SD. (n = 5 per group) statistics by two-way ANOVA test. (PBS vs MSLN-CAR, P < 0.0001; PBS vs ACOD1-/- MSLN-CAR, P < 0.0001; MSLN-CAR vs ACOD1-/- MSLN-CAR, P = 0.0051) l The Kaplan-Meier curve demonstrating survival of the mice. Statistics by two-tailed log-rank test. Source data are provided as a Source Data file.
Fig. 7
Fig. 7. ACOD1 deletion promoted the anti-ovarian cancer activity of iMACs combining with ICIs in vivo.
a A schematic of the in vivo study using HO-8910 cells for a mouse ovarian orthotopic injection model treated with MSLN-CAR-iMACs and ACOD1-/- MSLN-CAR-iMACs, and combined with an anti-CD47 antibody. b Tumor burden was determined by bioluminescent imaging (BLI). Images of representative time points were shown (n = 5 per group). c Quantification of tumor burden of representative time points was displayed as mean ± SD. Statistics by two-way ANOVA test. (PBS vs anti-CD47, P > 0.9999; PBS vs anti-CD47 + MSLN-CAR-iMAC, P = 0.004; PBS vs anti-CD47 + ACOD1-/- MSLN-CAR-iMAC, P < 0.0001; anti-CD47 + MSLN-CAR-iMAC vs anti-CD47 + ACOD1-/- MSLN-CAR-iMAC, P < 0.0001) d The Kaplan-Meier curve demonstrating survival of the mice. Statistics by two-tailed log-rank test. e A schematic of the in vivo study using HO-8910 cells for a mouse intraperitoneal (IP) injection model treated with MSLN-CAR-iMACs and ACOD1-/- MSLN-CAR-iMACs, and combined with an anti-PD1 antibody. f Tumor burden was determined by BLI. Images of representative time points were shown (n = 5 per group). g Quantification of tumor burden of representative time points was displayed as mean ± SD. Statistics by two-way ANOVA test. (PBS vs anti-PD1, P = 0.9078; PBS vs anti-PD1 + MSLN-CAR, P < 0.0001; PBS vs anti-PD1 + ACOD1-/- MSLN-CAR, P < 0.0001; anti-PD1 + MSLN-CAR vs anti-PD1 + ACOD1-/- MSLN-CAR, P < 0.0001) h The Kaplan-Meier curve demonstrating survival of the mice. Statistics by two-tailed log-rank test. Source data are provided as a Source Data file.

References

    1. Varol C, Mildner A, Jung S. Macrophages: development and tissue specialization. Ann. Rev. Immunol. 2015;33:643–675. doi: 10.1146/annurev-immunol-032414-112220. - DOI - PubMed
    1. Murray PJ, et al. Macrophage activation and polarization: nomenclature and experimental guidelines. Immunity. 2014;41:14–20. doi: 10.1016/j.immuni.2014.06.008. - DOI - PMC - PubMed
    1. Xue J, et al. Transcriptome-based network analysis reveals a spectrum model of human macrophage activation. Immunity. 2014;40:274–288. doi: 10.1016/j.immuni.2014.01.006. - DOI - PMC - PubMed
    1. Italiani P, Boraschi D. From monocytes to M1/M2 macrophages: phenotypical vs. functional differentiation. Front. Immunol. 2014;5:514. doi: 10.3389/fimmu.2014.00514. - DOI - PMC - PubMed
    1. Lu T, et al. Tumor-infiltrating myeloid cells induce tumor cell resistance to cytotoxic T cells in mice. J. Clin. investig. 2011;121:4015–4029. doi: 10.1172/JCI45862. - DOI - PMC - PubMed

Publication types

Substances