. 2023 Oct;3(10):1201-1209.
doi: 10.1038/s43587-023-00478-y. Epub 2023 Sep 18.

DOPA decarboxylase is an emerging biomarker for Parkinsonian disorders including preclinical Lewy body disease

Affiliations

DOPA decarboxylase is an emerging biomarker for Parkinsonian disorders including preclinical Lewy body disease

Joana B Pereira et al. Nat Aging. 2023 Oct.

Abstract

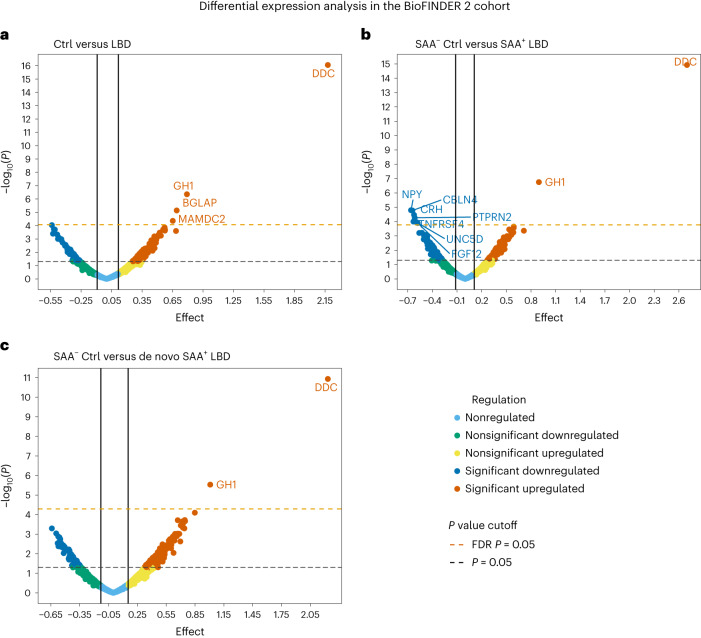
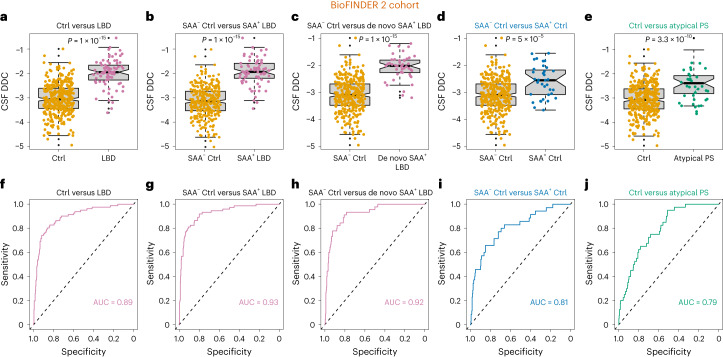
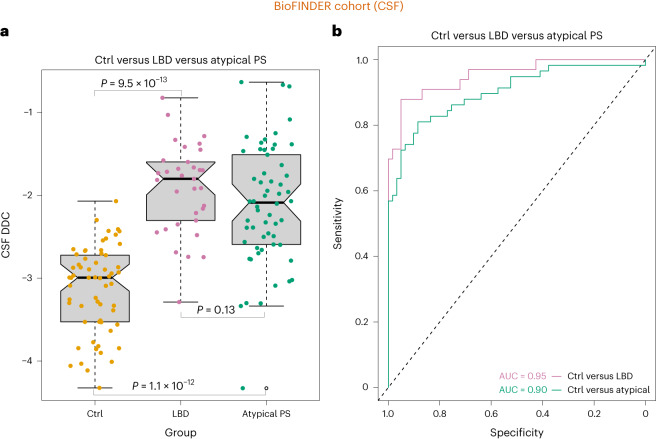
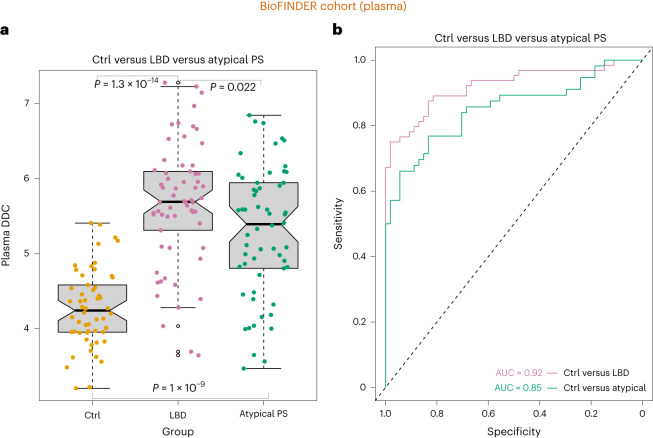
The diagnosis of Parkinsonian disorders is currently based on clinical criteria, which have limited sensitivity until most dopaminergic neurons are lost. Here we show that cerebrospinal fluid levels of DOPA decarboxylase (DDC) (also known as aromatic L-amino acid decarboxylase) can accurately identify patients with Lewy body disease (LBD) (area under the curve (AUC) = 0.89; PFDR = 2.6 × 10⁻¹³) and are associated with worse cognitive performance (P < 0.05). We also found that DDC can detect preclinical LBD stages in clinically unimpaired individuals with a positive seed amplification α-synuclein assay (AUC = 0.81, P = 1.0 × 10⁻⁵) and that this biomarker could predict progression to clinical LBD over a 3-year period in preclinical cases (hazard ratio = 3.7 per s.d. change, confidence interval = 1.1-12.7). Moreover, DDC levels were also increased in atypical Parkinsonian disorders but not in non-Parkinsonian neurodegenerative disorders. These cerebrospinal fluid results were replicated in an independent cohort, where we also found that DDC levels in plasma could identify both LBD and atypical Parkinsonian disorders (AUC = 0.92, P = 1.3 × 10⁻¹⁴). Our results show that DDC might have a future role in clinical practice as a biomarker of dopaminergic dysfunction to detect Parkinsonian disorders even during the preclinical disease stages and predict their progression to clinical LBD.


Conflict of interest statement

O.H. has acquired research support (for the institution) from ADx, AVID Radiopharmaceuticals, Biogen, Eli Lilly, Eisai, Fujirebio, GE Healthcare, Pfizer and Roche. In the past 2 years, he has received consultancy and speaker fees from AC Immune, Amylyx, Alzpath, BioArctic, Biogen, Cerveau, Eisai, Eli Lilly, Fujirebio, Genentech, Merck, Novartis, Novo Nordisk, Roche, Sanofi and Siemens. S.P. has acquired research support (for the institution) from ki elements/ADDF. In the past 2 years, he has received consultancy and speaker fees from Bioartic, Biogen, Cytox, Eli Lilly, Geras Solutions and Roche. The other authors declare no competing interests.

Figures

Fig. 1
Fig. 1. Differential expression analyses of patients with LBD compared to controls in BioFINDER 2.
a, Results comparing all CUIs or controls (ctrl) to patients with LBD. b, Results comparing α-synuclein SAA controls to SAA+ patients with LBD. c, Results comparing α-synuclein SAA controls to SAA+ patients with de novo LBD. The upper horizontal indicates proteins that survived FDR correction. The strongest top hit corresponded to DDC (also known as aromatic l-amino acid decarboxylase).
Fig. 2
Fig. 2. Increased CSF DDC levels in clinical LBD, preclinical LBD and atypical PS.
ae, Higher CSF levels were observed in (a) all patients with LBD, n = 428 independent samples (347 CUIs and 81 patients with LBD, including PD (n = 48) and DLB (n = 33)) (b), LBD with α-synuclein SAA+, n = 384 independent samples (310 CUIs and 74 patients with LBD) (c), de novo SAA+ patients with LBD, n = 355 independent samples (310 CUIs and 45 patients with LBD) (d), preclinical LBD defined as SAA+ CUIs or controls (SAA+ controls), n = 345 (SAA+ (n = 35); SAA (n = 310)) (e) and atypical PS compared to CUIs or controls, n = 387 independent samples (347 CUIs and 40 patients with PS). The boxes in ae denote the limits of the interquartile range (IQR), which is calculated by dividing the median by the range of the data; the whiskers extend beyond the box to a maximum of 1.5 times the IQR. fj, Results from the ROC analyses for the group comparisons, with the corresponding AUCs. (f), all patients with LBD, n = 428 independent samples (347 CUIs and 81 patients with LBD, including PD (n = 48) and DLB (n = 33)) (g), LBD with α-synuclein SAA+, n = 384 independent samples (310 CUIs and 74 patients with LBD) (h), de novo SAA+ patients with LBD, n = 355 independent samples (310 CUIs and 45 patients with LBD) (i), preclinical LBD defined as SAA+ CUIs or controls (SAA+ controls), n = 345 (SAA+ (n = 35); SAA− (n = 310)) (j) and atypical PS compared to CUIs or controls, n = 387 independent samples (347 CUIs and 40 patients with PS). All results were obtained using an analysis of covariance (ANCOVA) while adjusting for age and sex and controlling for multiple comparisons using Bonferroni correction. All P values are two-sided.
Fig. 3
Fig. 3. Increased CSF DDC levels in clinical LBD and atypical PS in an independent cohort.
a, Higher CSF DDC levels were observed in all patients with LBD and atypical PS compared to CUIs or controls, n = 152 (patients with LBD (PD = 32, DLB = 1), 61 controls (CUIs = 29, SCD = 32) and 58 atypical Parkinsonian disorders (MSA = 30, PSP = 28). The box denotes the limits of the IQR, which is calculated by dividing the median by the range of the data; the whiskers extend beyond the box to a maximum of 1.5 times the IQR. b, Results from the ROC analyses for the group comparisons with the corresponding AUCs. All results were obtained using an ANCOVA while adjusting for age and sex and controlling for multiple comparisons using Bonferroni correction. All P values are two-sided.
Fig. 4
Fig. 4. Increased plasma DDC levels in clinical LBD and atypical PS in an independent cohort.
a, Higher plasma DDC levels were observed in all patients with LBD and atypical PS compared to CUIs or controls, n = 174 (64 patients with LBD; PD = 2; DLB = 2), 54 controls (CUIs = 29, showing SCD = 25) and 56 atypical PS (MSA = 30, PSP = 26). The box denotes the limits of the IQR, which is calculated by dividing the median by the range of the data; the whiskers extend beyond the box to a maximum of 1.5 times the IQR. b, Results from the ROC analyses for the group comparisons with the corresponding AUCs. All results were obtained using an ANCOVA while adjusting for age and sex and controlling for multiple comparisons using Bonferroni correction. All P values are two-sided.
Extended Data Fig. 1
Extended Data Fig. 1. Increased CSF DDC levels in medicated SAA+ De novo LBD.
Higher CSF DDC levels are observed in (a) medicated Lewy body disease (LBD) patients compared to drug naive LBD, n=74 [de novo SAA+ LBD patients (n=29), the medicated SAA+ LBD group (n=45)]. The box denotes the limits of the interquartile range, which is calculated by dividing the median by the range of the data, and the whiskers extend beyond the box to a maximum of 1.5 times the interquartile range. Results from the receiver operating curve analyses for the above group comparisons (b) with the corresponding areas under the curve (AUC). All results were obtained using an analysis of covariance (ANCOVA) while adjusting for age and sex and controlling for multiple comparisons using Bonferroni. All P values are two-sided.
Extended Data Fig. 2
Extended Data Fig. 2. The Kaplan–Meier survival curve.
The Kaplan–Meier survival curve of different DDC levels for clinically unimpaired SAA+ individuals. Samples were categorized into low-and high-DDC groups using a median NPX value of DDC.
Extended Data Fig. 3
Extended Data Fig. 3. Cerebrospinal fluid DDC levels are associated with worse motor and cognitive functions in clinical LBD.
Higher cerebrospinal fluid (CSF) DDC levels are associated with a) worse global cognition measured with the modified Preclinical Alzheimer Cognitive Composite (mPACC), b) higher delayed memory recall from ADAS-Cog (indicating worse performance), c) higher AQT form color scores, (indicating worse performance) and d) worse visuospatial scores measured with visual object and space perception battery – cube analysis subtest in patients with clinical LBD.
Extended Data Fig. 4
Extended Data Fig. 4. Results from the receiver operating curve analyses for the group comparisons.
a) LBD vs Atypical PS: BioFINDER−2 (CSF), b) LBD vs Atypical PS: BioFINDER−1 (CSF), c) ROC Curve: LBD vs Atypical PS: BioFINDER−1 (Plasma). All results were obtained using an analysis of covariance (ANCOVA) while adjusting for age and sex and controlling for multiple comparisons using Bonferroni.
Extended Data Fig. 5
Extended Data Fig. 5. Differential expression analyses of patients with LBD compared to non-Parkinsonian disorders in BioFINDER-2.
a) Results comparing all non-Parkinsonian disorders (Alzheimer’s disease, AD; fronto-temporal dementia, FTD; vascular dementia, VaD) to Lewy body disease (LBD) patients. b) Results comparing AD/FTD/VaD with a negative α-synuclein Seed Amplification Assay (SAA) (SAA-) to LBD patients with a positive SAA (SAA+). c) Results comparing SAA- AD/FTD/VaD patients to SAA+ de novo LBD patients. The upper horizontal indicates proteins that survived FDR corrections. The strongest top hit corresponded to DOPA decarboxylase (DDC, aka aromatic L-amino acid decarboxylase).
Extended Data Fig. 6
Extended Data Fig. 6. Differential expression analyses of patients with LBD compared to controls in the BioFINDER-1 cohort with CSF samples.
Results comparing all clinical unimpaired individuals or controls (CTR) to Lewy body disease (LBD) patients. The upper horizontal indicates proteins that survived FDR corrections. The strongest top hit corresponded to DOPA decarboxylase (DDC, also known as aromatic L-amino acid decarboxylase).
Extended Data Fig. 7
Extended Data Fig. 7. Differential expression analyses of patients with LBD compared to controls in the BioFINDER-1 cohort with plasma samples.
Results comparing all clinical unimpaired individuals or controls (CTR) to Lewy body disease (LBD) patients. The upper horizontal indicates proteins that survived FDR corrections. The strongest top hit corresponded to plasma DOPA decarboxylase (DDC, also known as aromatic L-amino acid decarboxylase).
Extended Data Fig. 8
Extended Data Fig. 8. Relationship between CSF and plasma DDC in the BioFINDER-1 cohort.
The plot shows a significant relationship between the levels of DDC measures in the cerebrospinal fluid (CSF) and plasma.

Comment in

References

    1. Dorsey ER, George BP, Leff B, Willis AW. The coming crisis: obtaining care for the growing burden of neurodegenerative conditions. Neurology. 2013;80:1989–1996. doi: 10.1212/WNL.0b013e318293e2ce. - DOI - PMC - PubMed
    1. Poewe W, et al. Parkinson disease. Nat. Rev. Dis. Primers. 2017;3:17013. doi: 10.1038/nrdp.2017.13. - DOI - PubMed
    1. Amaoutoglou NA, O’Brien JT, Underwood BR. Dementia with Lewy bodies—from scientific knowledge to clinical insights. Nat. Rev. Neurol. 2019;15:103–112. doi: 10.1038/s41582-018-0107-7. - DOI - PubMed
    1. Parnetti L, et al. CSF and blood biomarkers for Parkinson’s disease. Lancet Neurol. 2019;18:573–586. doi: 10.1016/S1474-4422(19)30024-9. - DOI - PubMed
    1. van Dijk KD, et al. Diagnostic cerebrospinal fluid biomarkers for Parkinson’s disease: a pathogenetically based approach. Neurobiol. Dis. 2010;39:229–241. doi: 10.1016/j.nbd.2010.04.020. - DOI - PMC - PubMed

Publication types

MeSH terms