. 2023 Sep 18;13(1):15451.
doi: 10.1038/s41598-023-42652-7.

Heatwave resilience of juvenile white sturgeon is associated with epigenetic and transcriptional alterations

Affiliations

Heatwave resilience of juvenile white sturgeon is associated with epigenetic and transcriptional alterations

Madison L Earhart et al. Sci Rep. .

Abstract

Heatwaves are increasing in frequency and severity, posing a significant threat to organisms globally. In aquatic environments heatwaves are often associated with low environmental oxygen, which is a deadly combination for fish. However, surprisingly little is known about the capacity of fishes to withstand these interacting stressors. This issue is particularly critical for species of extreme conservation concern such as sturgeon. We assessed the tolerance of juvenile white sturgeon from an endangered population to heatwave exposure and investigated how this exposure affects tolerance to additional acute stressors. We measured whole-animal thermal and hypoxic performance and underlying epigenetic and transcriptional mechanisms. Sturgeon exposed to a simulated heatwave had increased thermal tolerance and exhibited complete compensation for the effects of acute hypoxia. These changes were associated with an increase in mRNA levels involved in thermal and hypoxic stress (hsp90a, hsp90b, hsp70 and hif1a) following these stressors. Global DNA methylation was sensitive to heatwave exposure and rapidly responded to acute thermal and hypoxia stress over the course of an hour. These data demonstrate that juvenile white sturgeon exhibit substantial resilience to heatwaves, associated with improved cross-tolerance to additional acute stressors and involving rapid responses in both epigenetic and transcriptional mechanisms.


Conflict of interest statement

The authors declare no competing interests.

Figures

Figure 1
Figure 1
Nechako river temperature measured at the Vanderhoof station (teal) and recorded temperatures from the simulated heatwave (black). Temperatures taken during the British Columbia heatwave in June and July 2021.
Figure 2
Figure 2
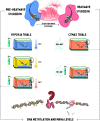
Experimental design for juvenile white sturgeon heatwave exposure. Juvenile sturgeon acclimated to 13 °C were exposed to a simulated heatwave mimicking the heatwave recorded in the Nechako river in June 2021. The laboratory exposures were performed in June through July of 2021 lagging a few days behind recorded river temperatures. This ensured that fish were exposed to the heatwave at the same life stage that they would have encountered these temperatures in the river. Temperature was increased to 20 °C over the course of three days and then maintained at that level for 20 days. Hypoxia and thermal tolerance (CTMax) were assessed in pre-heatwave (13 °C) fish and those exposed to 20 °C for 20 days. Hypoxia trials were conducted at the acclimation temperature and after acute exposure to 13 °C, 17 °C or 20 °C, acute increases to 17 °C and 20 °C for pre-heatwave fish and acute decreases 17 °C and 13 °C for heatwave fish. CTMax trials were conducted at either 70% or 100% air saturation. Sturgeon gills and heart were sampled at pre-heatwave, mid-heatwave (10 days), and heatwave (20 days) to assess baseline mRNA levels and global DNA methylation. Following hypoxia and CTMax trials stress induced levels of mRNA and global DNA methylation were also assessed (pre-heatwave and heatwave fish). Illustration by Madison Earhart.
Figure 3
Figure 3
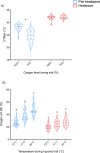
CTMax and hypoxia tolerance in pre-heatwave (pre-heatwave; blue) and heatwave exposed (heatwave; pink) juvenile white sturgeon. Panel (A) represents CTMax under normoxia (100% air saturation) or hypoxia (70% air saturation). Asterisks indicate CTMax differences between normoxic and hypoxic test conditions within pre-heatwave or heatwave fish respectively. Panel (B) shows % air saturation at the time of loss of equilibrium in pre heatwave and heatwave sturgeon at three different temperatures. Letters indicate differences in LOE between temperatures during the hypoxia trial, within each acclimation group. For both panels, data are expressed as a median with quartiles and individual data points are shown (n = 25–50).
Figure 4
Figure 4
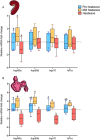
Baseline mRNA levels for hsp90a, hsp90b, hsp70, and hif1a in juvenile white sturgeon over time during the heatwave in fish that have not been exposed to an acute stressor. Data are normalized to the reference genes (see text) and presented as fold change compared to the mean of the control group (pre-heatwave). Pre-heatwave (blue), mid-heatwave (yellow), and heatwave (pink). For both panels, data are expressed as a median with quartiles and individual data points are shown (n = 5–8). Panel (A) is gill mRNA and panel (B) is heart mRNA. Letters that differ indicate significant differences between pre-heatwave, mid-heatwave, or heatwave fish within a gene (P < 0.05).
Figure 5
Figure 5
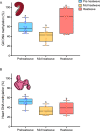
Baseline global DNA methylation levels in juvenile white sturgeon over time during the heatwave in fish that have not been exposed to an acute stressor. Pre-heatwave (blue), mid-heatwave (yellow), and heatwave (pink). Panel (A) is gill and panel (B) is heart. Letters that differ indicate significant differences between pre-heatwave, mid-heatwave, and heatwave fish as determined by Tukey HSD (P < 0.05). For both panels, data are expressed as a median with quartiles and individual data points are shown (n = 7–10).
Figure 6
Figure 6
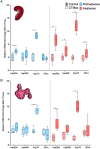
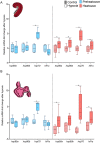
Fold change in mRNA transcript levels in unstressed fish (checkered boxes) and after CTMax trials (solid boxes) in pre-heatwave (blue) and heatwave (pink) juvenile white sturgeon. All mRNA levels are normalized to reference genes and fold change is computed relative to mRNA levels in unstressed fish for each gene. Panel (A) shows fold changes in gill mRNA and panel (B) shows fold changes in heart mRNA. An asterisk indicates differences in the fold change between unstressed fish and post-CTmax fish for each gene. Significance was determined via two-way ANOVA and a Tukey’s HSD (P < 0.05). For both panels, data are expressed as a median with quartiles and individual data points are shown (n = 4–8).
Figure 7
Figure 7
Fold change in mRNA transcript levels in unstressed fish (checkered boxes) and after hypoxia trials (solid boxes) in pre-heatwave (blue) and heatwave (pink) juvenile white sturgeon. All mRNA levels are normalized to reference genes and fold change is computed relative to mRNA levels in unstressed fish for each gene. Panel (A) shows fold changes in gill mRNA and panel (B) shows fold changes in heart mRNA. An asterisk indicates differences in the fold change between unstressed fish and post-hypoxia fish for each gene. Significance was determined via two-way ANOVA and a Tukey’s HSD (P < 0.05). For both panels, data are expressed as a median with quartiles and individual data points are shown (n = 4–8).
Figure 8
Figure 8
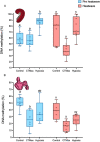
Gill and heart DNA methylation following CTMax and hypoxia trials in pre-heatwave (blue) and heatwave (pink) juvenile white sturgeon. Panel (A) shows gill DNA methylation and panel (B) shows heart DNA methylation. Letters that differ indicate differences between control, CTMax, or hypoxia DNA methylation within pre-heatwave (ABC) or heatwave fish (XYZ). Significance was determined via two-way ANOVA and a Tukey’s HSD (P < 0.05). For both panels, data are expressed as a median with quartiles and individual data points are shown (n = 5–10).

Similar articles

Cited by

References

    1. Vasseur DA, et al. Increased temperature variation poses a greater risk to species than climate warming. Proc. R. Soc. B. 2014;281:20132612. - PMC - PubMed
    1. Stillman JH. Heat waves, the new normal: summertime temperature extremes will impact animals, ecosystems, and human communities. Physiology. 2019;34:86–100. - PubMed
    1. Román-Palacios C, Wiens JJ. Recent responses to climate change reveal the drivers of species extinction and survival. Proc. Natl. Acad. Sci. U.S.A. 2020;117:4211–4217. - PMC - PubMed
    1. Pörtner Climate change and temperature-dependent biogeography: Oxygen limitation of thermal tolerance in animals. Naturwissenschaften. 2001;88:137–146. - PubMed
    1. Verberk WCEP, Bilton DT, Calosi P, Spicer JI. Oxygen supply in aquatic ectotherms: Partial pressure and solubility together explain biodiversity and size patterns. Ecology. 2011;92:1565–1572. - PubMed

Publication types